PhoneGap

PhoneGap Error and Performance Monitoring

Get complete visibility into your PhoneGap errors and performance issues that are impacting your end user experience. Fix critical issues sooner with in depth data points that helps you in analyzing and resolving issues with great speed.
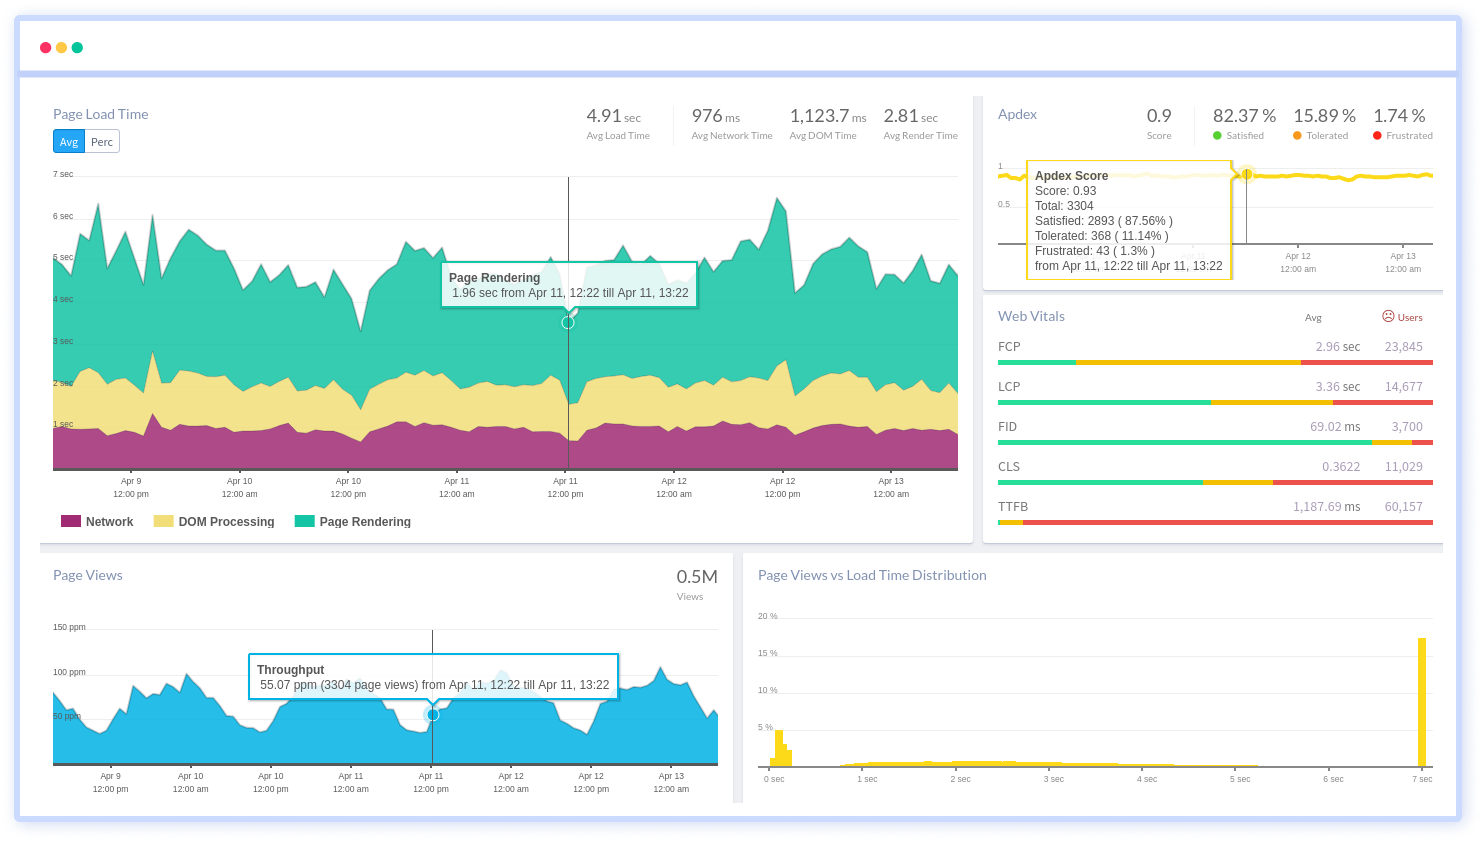
PhoneGap performance monitoring in real-time

Atatus monitors your PhoneGap application to provide detailed overview of the end-user experience your customers have. Uncover performance bottlenecks in frontend for every page request and identify the root cause of slow load times, route changes and more.

PhoneGap End User Experience
Web VitalsWeb Vitals

Optimize your user experience quality

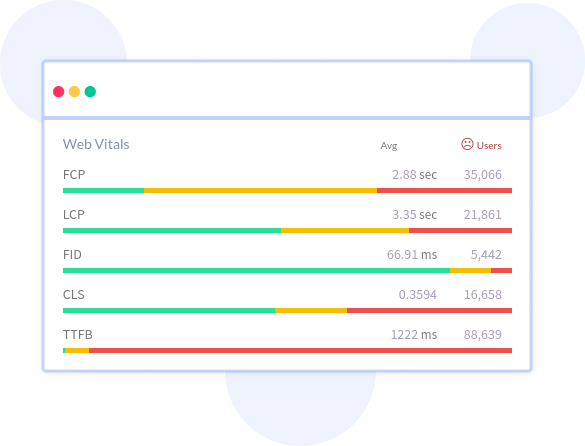
We gather critical performance data for Google's Core Web Vitals and Other Web Vitals that helps you understand what’s the cause of the slow performance at the user level if they are having troubling interacting with the page, seeing sudden changes or having slow loading times.

Core metrics

  • Largest Contentful Paint (LCP)
  • First Input Delay (FID)
  • First Contentful Paint (FCP)
  • Time to First Byte (TTFB)
  • Cumulative Layout Shift (CLS)
Learn moreLearn More
Google Core Web Vitals
Slow resourcesSlow resources

Slow pages leads to more bounce rate - Fix your slow ones!

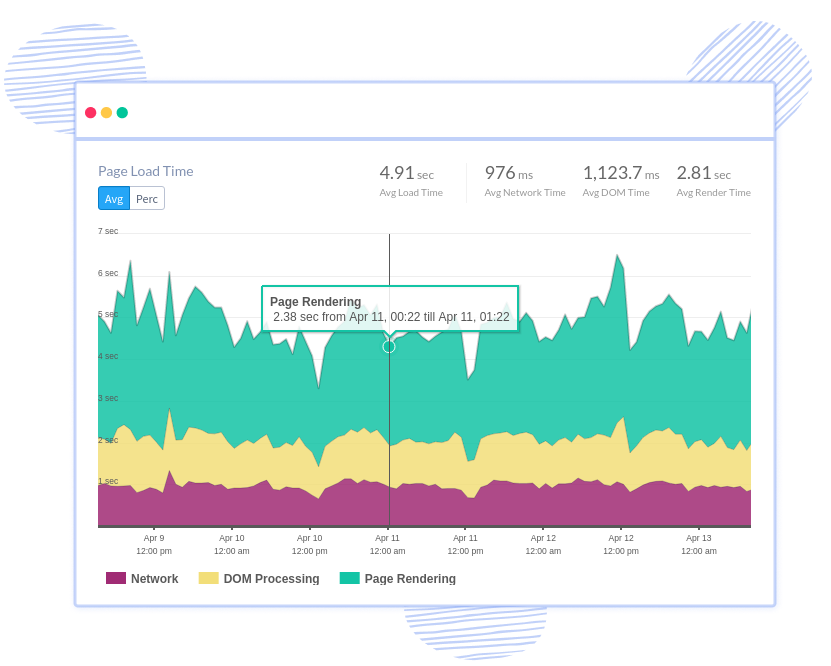
Gain insights into why your customers were affected by bad front end performance and slow page load. Inspect individual users having poor experiences due to slow pages, PhoneGap exceptions or failing AJAX calls. Quickly see how network or geographical region is affecting your end users' experience. Session traces provides waterfall view of the session to identify slow PhoneGap assets, long load times and errors.

Learn moreLearn More
PhoneGap Page Load Performance
XHR CallsXHR Calls

Get full picture of AJAX requests

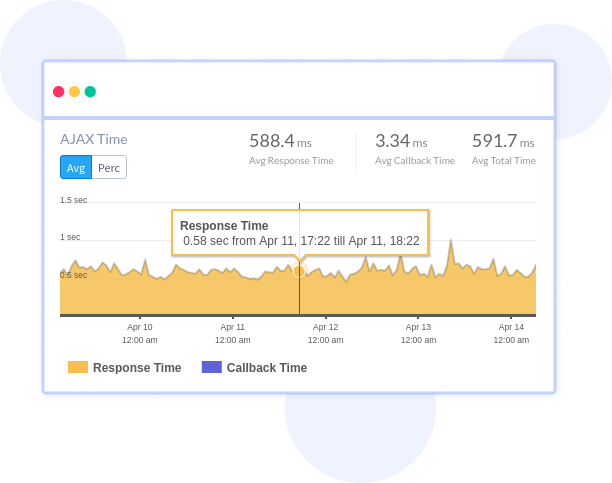
Examine all XHR requests sent by your PhoneGap app. Monitor and measure XHR calls' response times and failure rates. Identify slow and failed AJAX calls and optimize request performance. Slice and dice AJAX calls in real time—based on browser, user, version, tag and other attributes.

Learn moreLearn More
PhoneGap AJAX Monitoring
Frontend errorsFix issues

PhoneGap error monitoring with stack traces

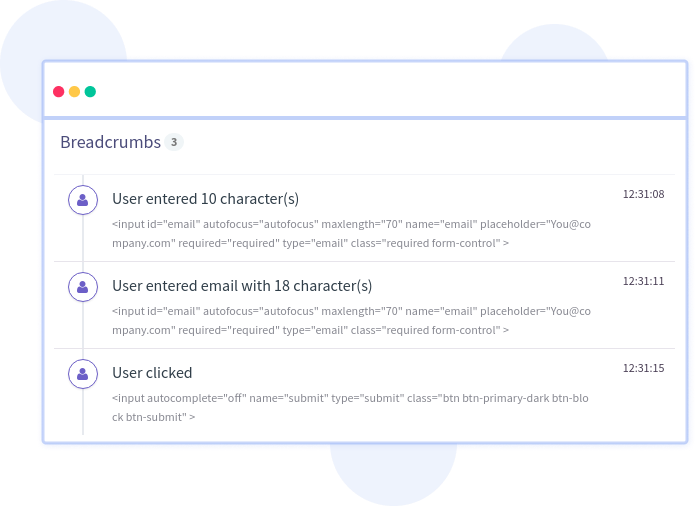
Every PhoneGap error is captured with full stack trace and exact line of source code is highlighted to make bug fixing easier. Source maps are automatically applied to convert your minified code into the original source line that caused the crash. See user actions, console logs and all javascript events at that time to help you to resolve the PhoneGap error. Get alerts for errors and exceptions via Email, Slack, PagerDuty, or using webhooks.

Learn moreLearn More
PhoneGap Error Tracking
SPA MonitoringSPA Monitoring

Discover slow single page route changes

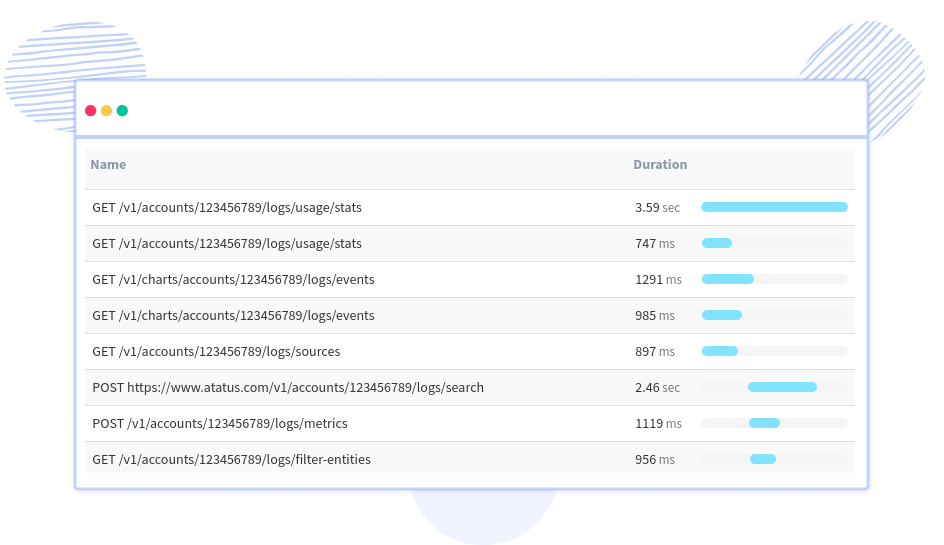
See how much time each route changes takes. Drill down into PhoneGap SPA response times, AJAX breakdown of the route change, slow routes breakdown with trace. Get a detailed view along with the impact that it has on your end-user experience.

Learn moreLearn More
PhoneGap SPA Monitoring

Start resolving frontend performance issues

Try it free. No credit card required. Instant set-up.

Awesome Support

Great product for tracking issues on Production

"We were struggling with site speed on the Production side and it wasn't clear what was causing it. With Atatus we were able to pinpoint exactly what wrong, and after a fix, we saw the speed improvements right away on the performance charts And the installation was so easy. I definitely recommend trying it."

— Ivan S, Engineering Manager, iSavta

Atatus supports major frontend frameworks seamlessly

1. Install atatus-js from the npm registry:

npm install --save atatus-spa

  import and initialize atatus to monitor your application:

import * as atatus from  'atatus-spa';
atatus.config('YOUR_API_KEY').install();

3. To verify that your integration is working, call notify() in your application:

atatus.notify(new Error("Test Atatus Setup"));

Deep dive into your PhoneGap app's performance

Setup

Two Line Setup

Adding two lines of code gets you started with tracking your PhoneGap app's performance and errors. Start seeing immediately what are the pain points your users are facing.

Source Maps

Source Maps

Make readable stack traces in your errors by providing source maps. Un-minifying JavaScript lets you view source code in their original form, which helps in debugging minified code from production.

Block Bots & Malicious IPs

Block Bots & Malicious IPs

You can filter Bots, Domains, IPs, User Agents and many other configurations in making sure that you get actionable insights from the real data that affects your customers.

Smart notifications

Smart notifications

Setup alerts to automatically monitor your applications for increase in response time, API failures, or error rate and much more. Get notified through various channels, including Slack, Teams, Email, PagerDuty and more.

Collaborate

Collaborate

Invite your team members and work together to resolve issues. Add comments to the PhoneGap errors, so that your team members who view the errors, get to know what and how the fix was made.

Search data

Slice and Dice data

Get your questions answered. Use custom queries to slice and dice the data by transaction, URL, error, user, browser, host OS and more.

Unlimited websites

Unlimited websites

Track all your websites in one place. Add your production, dev, staging, QA to monitor your websites through the complete software development cycle.

Email digests

Email digests

Don't miss out on your PhoneGap app's performance and error stats. Atatus can send you weekly and monthly summaries directly to your inbox.

Ticketing Inetgration

Ticketing Integration

Maintain your workflow with Atatus issues in various Project Management integrations. We support Jira, Asana, BugHerd, GitHub, GitLab, and more.

FAQ on PhoneGap Real User Monitoring

What is PhoneGap performance monitoring?

PhoneGap performance monitoring collects in-depth metrics on each user-interaction and analyzes everything from page load events to HTTP requests to front-end application crashes.

Monitoring PhoneGap apps helps you to pinpoint PhoneGap issues, measure user experience with the key metrics provided and fix them as soon as possible.

How does RUM work?

In real-time monitoring, a small piece of code is injected into the application to collect metrics while it is in use.

The browser-based applications can be monitored by injecting a JavaScript code which tracks and detects the front-end performance issues along with the XHR requests.

It also provides you with in-depth front-end metrics which helps you in resolving the issues at a faster rate.

Which types of websites can Atatus RUM monitor?

Atatus Real User Monitoring supports front-end frameworks such as JavaScript, AngularJS, Angular, React, Backbone, Ember, Vue, Ionic, Ionic2+ and Meteor.

Also, you can embed the JavaScript snippet in a web page inside the tag and monitor.

Does the PhoneGap browser agent have the capability of discovering the IP address of the browser client used by the user?

Yes, we collect the IP address of the browser client used by the user, which will be displayed in the users' information along with the page views, load time, error count and last seen of the user, respectively.

Does Atatus collects Google core web vitals in PhoneGap performance monitoring?

Yes, we do collect core web vitals metrics such as:

  1. First Contentful Paint (FCP)
  2. Last Contentful Paint (LCP)
  3. First Input Delay (FID)
  4. Cumulative Layout Shift (CLS)
  5. Time To First Byte (TTFB)
Does Atatus RUM supports single page applications?

As part of Atatus Browser Monitoring, we have a Single Page Application (SPA) Monitoring feature that gives a 360-degree view of what customers are doing with single-page apps and AJAX-based apps.

What are the benefits of real user monitoring?

The benefits of real-time monitoring of users are substantial.

  1. It provides actual end-user experiences
  2. Easily track high value pages
  3. RUM metrics can ‌determine whether service level agreements (SLAs) are being met, and to determine how users interact with an application and how developers can simplify the user interface.
Why choose Atatus as your RUM tool?

Compared to all other browser monitoring tools Atatus offers affordable pricing plans. Collaboration requires in any monitoring tool so we do not limit your capabilities by charging per user.

We collect all the data points including Spans and Traces that are necessary for you without the need for you to select which to retain. With this you can easily monitor your entire application.

What happens if page views exceed the limit?

Rather than stop collecting the front-end performance metrics, our sales team will contact you to discuss the requirements.

Trusted Protection through Global Compliance

Feel assured as we maintain rigorous security protocols, ensuring the safety of your data with every interaction

SOC 2 Type 2 Compliant
ISO 27001 Certified
ISO 27001 Certified
GDPR & CCPA Compliant

Ready to see actionable data?

Avail Atatus features for 14 days free-trial. No credit card required. Instant set-up.