Google Core Web Vitals
Start measuring quality signals that are essential to delivering a great user experience on the web. With a detailed overview of all the Web Vitals that can help you quantify the experience of your site and identify opportunities to improve.

Get full visibility of the distinct facets of the user experience
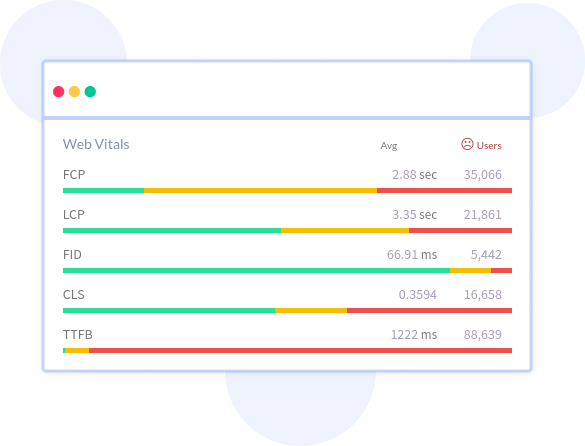
Atatus measures the default set of metrics defined by Google to measure loading performance, interactivity, visual stability, render-blocking resources and slow server response times. Focus on the metrics that matter most.

Find how many of your users have poor experience
Default definition from Google on how it measures the good, needs improvement and poor scores for the web vitals, get your application classified into the three categories. See how many of your distinct users are now affected across mobile and desktop devices.

See the percentile of your users affected
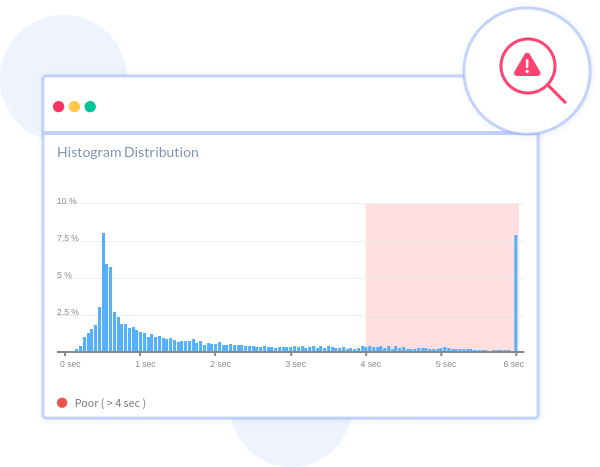
With a clear histogram chart that shows how each web vital is performing, ascertain if the Google recommended 75th percentile of the page loads, segmented across mobile and desktop devices is classified under the good score.

Drill down into the poor performing vitals
Get your questions answered. Use easy to apply filters along with custom queries to slice and dice the web vitals by connection type, URL, user, browser, device, OS and more. Focus on ways to understand and improve your web vitals in a longer run.


 +1-415-800-4104


