MySQL Monitoring & Query Performance
Detect and resolve sluggish MySQL queries in your requests, along with transaction traces, to gather actionable insights for optimized functionality.
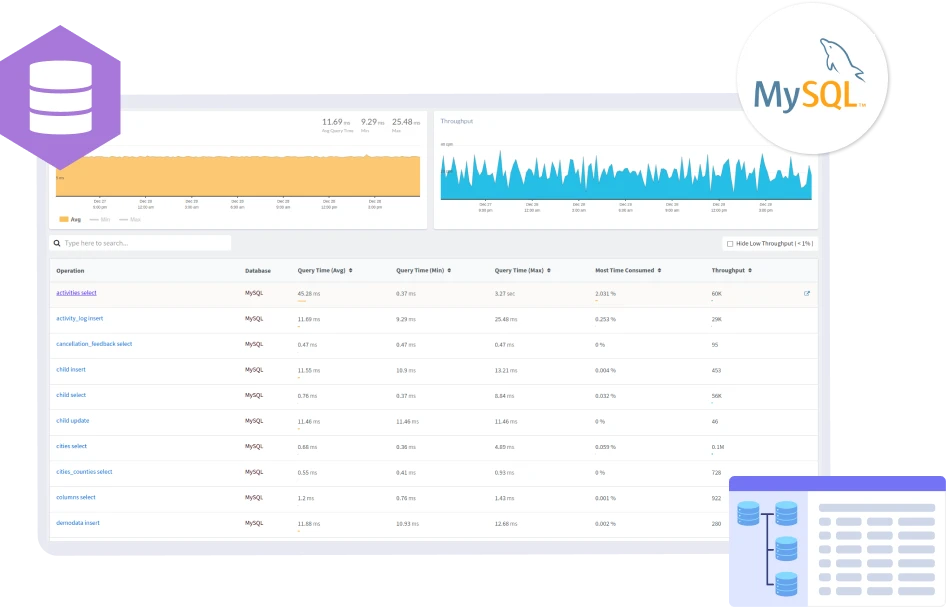
Detect and resolve sluggish MySQL queries in your requests, along with transaction traces, to gather actionable insights for optimized functionality.

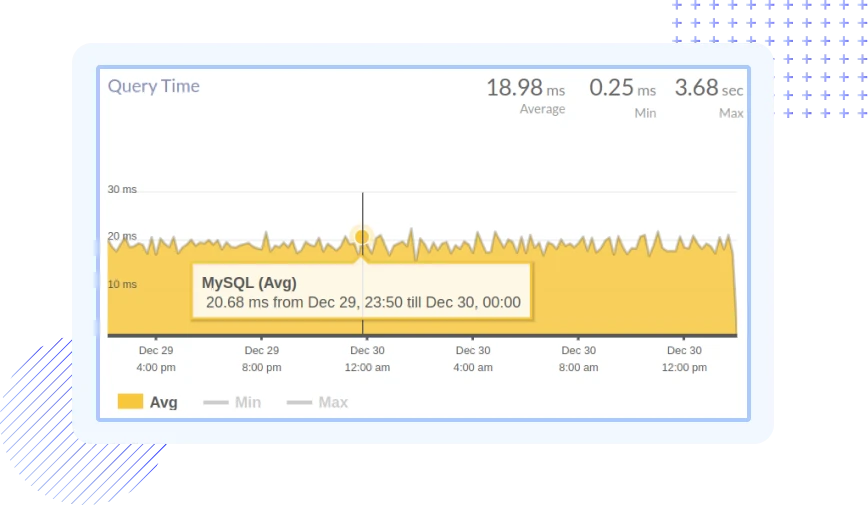
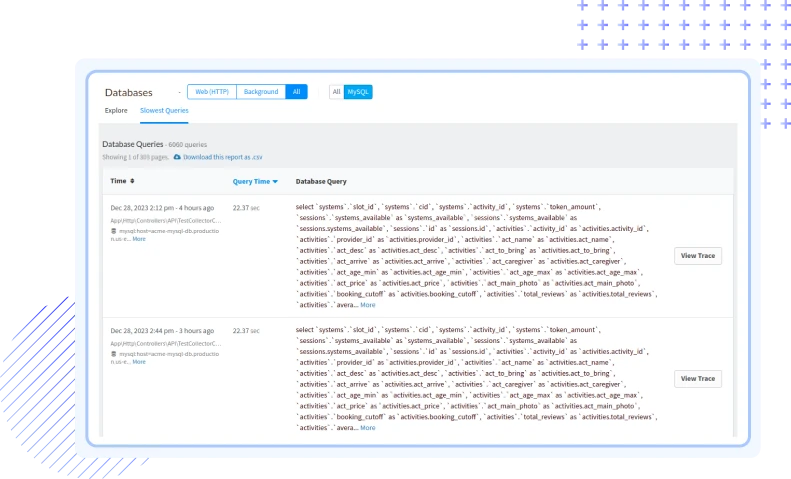
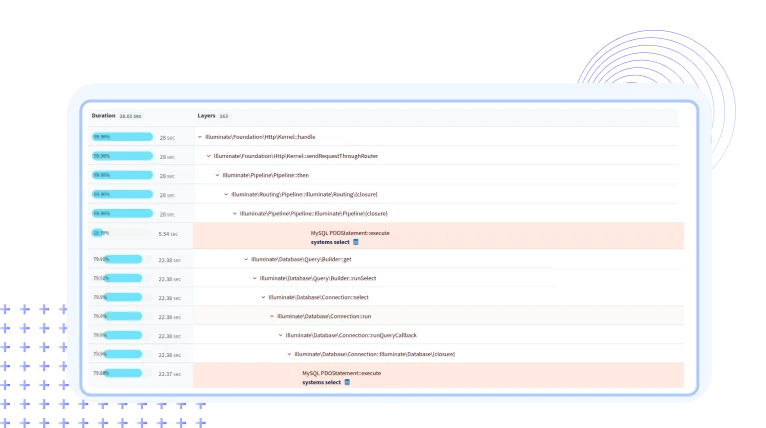
Gain insights into your MySQL performance, enhancing transaction flow and speeding up error resolution.
Visualize end-to-end traces across your stack, ensuring that you catch every MySQL error, performance issue, or bottleneck before it affects users.
Pinpoint and resolve slow database queries and eliminate performance bottlenecks impacting your MySQL application's responsiveness, leading to faster response times
Get alerted to potential library vulnerabilities, preventing security risks before they affect your customers or compliance.
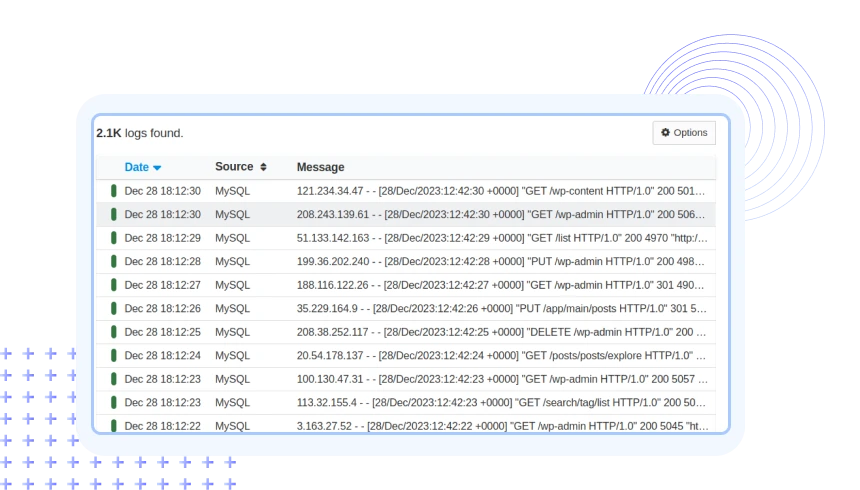
Centralize all your MySQL logs in one place, and quickly identify the root cause of issues using advanced filtering, pattern detection, and log pipelines.
Set up and track custom metrics that align with your app's KPIs to ensure you're monitoring exactly what matters most for your success.
Explore request-level analysis, including stdout APM logs, to understand execution times, bottlenecks, and areas that need optimization.
Correlate your app’s MySQL APM metrics with server health to get a complete picture of your application’s performance and infrastructure dependencies.
Receive real-time alerts for MySQL app performance degradations and critical issues. Take immediate action to prevent downtime and optimize user experiences.
MySQL monitoring involves the systematic observation and analysis of various performance metrics and parameters within a MySQL database. It is crucial for ensuring the optimal performance, availability, and reliability of MySQL instances. Monitoring allows you to detect and address potential issues, optimize resource usage, and maintain the overall health of your MySQL databases, which are fundamental components of many web applications.
Monitoring MySQL with Atatus offers a comprehensive solution for gaining deep insights into the performance of your MySQL databases. Atatus provides real-time visibility, customizable dashboards, and intelligent alerting capabilities, allowing you to proactively manage and optimize MySQL instances. With Atatus, you can ensure high availability, quickly troubleshoot issues, and streamline the performance of your MySQL-powered applications.
Important MySQL metrics to monitor include:
Atatus supports a wide range of popular databases, including but not limited to MySQL, MS SQL, PostgreSQL, MongoDB, MariaDB, Redis, Memcached, SQLite, and Aerospike. The platform provides integrations and pre-built dashboards tailored to each supported database, allowing users to monitor and analyze their database performance effectively. Whether your application relies on MySQL or a combination of different databases, Atatus provides a unified platform for effective monitoring and optimization.
Atatus provides Query Performance Monitoring, allowing you to identify slow queries, view query plans, and assess overall query performance. With this information, you can optimize queries for better database efficiency.
Yes, Atatus is designed to monitor MySQL databases in both traditional and distributed environments. It supports monitoring across on-premises, cloud, and hybrid infrastructure, providing a unified view of your MySQL performance regardless of the deployment model.
Atatus supports various notification channels, including email, Slack, PagerDuty, and others. You can configure alerting policies with specific thresholds and conditions to receive timely notifications when MySQL metrics deviate from expected values.
Data retention for MySQL monitoring is set to 7 days by default. This can be changed in your billing settings to 60 or 90 days. Contact our Customer Success Representative if you require a longer retention period.
You don't have to trust our word. Hear what our customers say!
Atatus is a great product with great support. Super easy to integrate, it automatically hooks into everything. The support team and dev team were also very helpful in fixing a bug and updating the docs.
Atatus is powerful, flexible, scalable, and has assisted countless times to identify issues in record time. With user identification, insight into XHR requests to name a few it is the monitoring tool we choose for our SPAs.
Atatus continues to deliver useful features based on customer feedback. Atatus support team has been responsive and gave visibility into their timeline of requested features.
Avail Atatus features for 14 days free-trial. No credit card required. Instant set-up.