PostgreSQL Monitoring & Observability

Detect and resolve sluggish PostgreSQL queries in your requests, along with transaction traces, to gather actionable insights for optimized functionality.
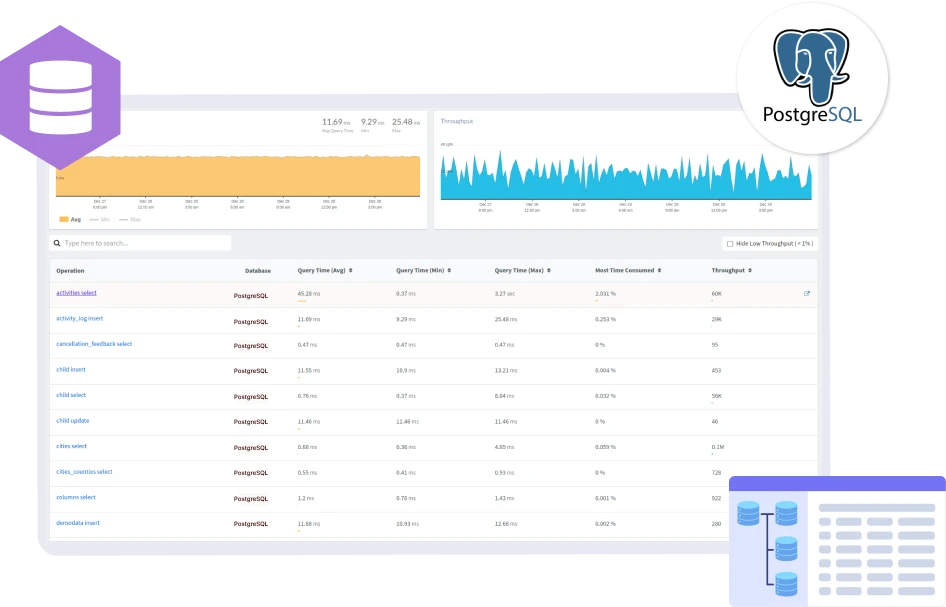
PostgreSQL Monitoring
Query TimePostgreSQL Outage

Detect PostgreSQL Database Outages

Quickly pinpoint and resolve performance problems within your database fleet using user-friendly health summary telemetry. Understand the demands on your databases with PostgreSQL host wait events and efficiently manage, troubleshoot, and address potential outages using top query metrics.
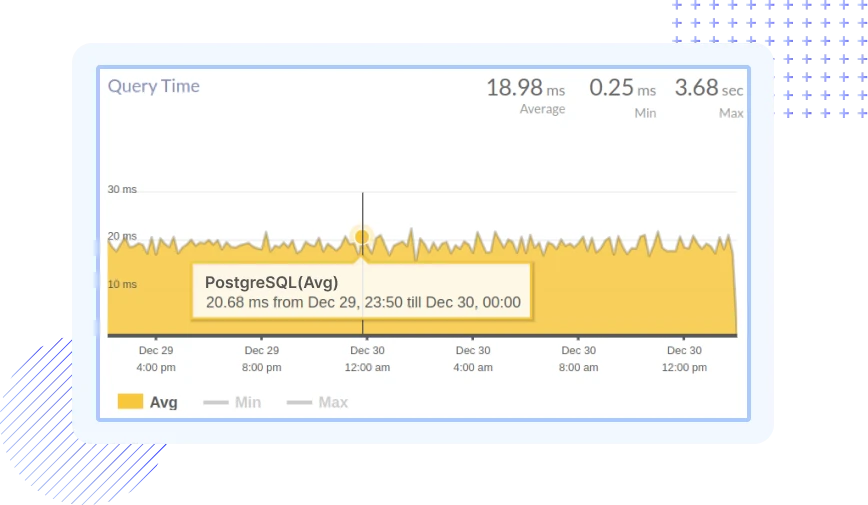
PostgreSQL Outage
Slow QueryPostgreSQL Slow Query

Pinpoint Slow PostgreSQL Queries

Identify PostgreSQL queries with the most significant impact on PostgreSQL responsiveness. Obtain the necessary insights to pinpoint and address inefficiencies at the query level. Comprehend the execution plans, optimize query efficiency, and ensure that each query contributes to the overall optimal performance of your PostgreSQL database.
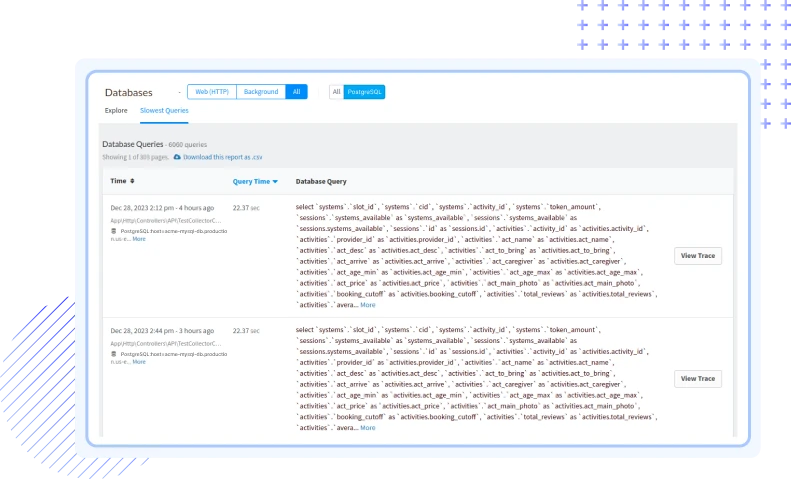
PostgreSQL Slow Queries
DB CallAPM Metrics

Correlating SQL Metrics with APM Data

Drill down into an individual database operation to understand which end points call a particular table and operation, along with specific details of the total time consumed, response time, throughput, slowest SQL queries of that operation.
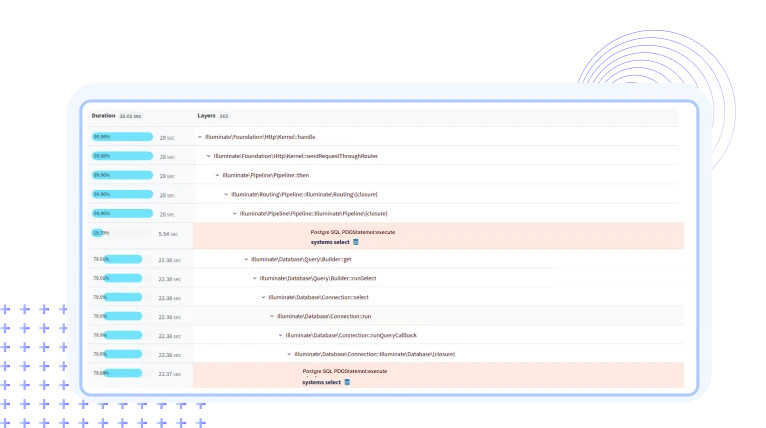
PostgreSQL Stack Trace
PostgreSQL Logs MonitoringPostgreSQL Logs

PostgreSQL Queries and Enriched Logs

Streamline log analysis by parsing PostgreSQL data alongside infrastructure log events, consolidating all information in a centralized hub. Uncover detailed insights into query execution, resource usage, and error conditions to get a holistic perspective on transaction details, index optimizations, and precise timestamp correlations.
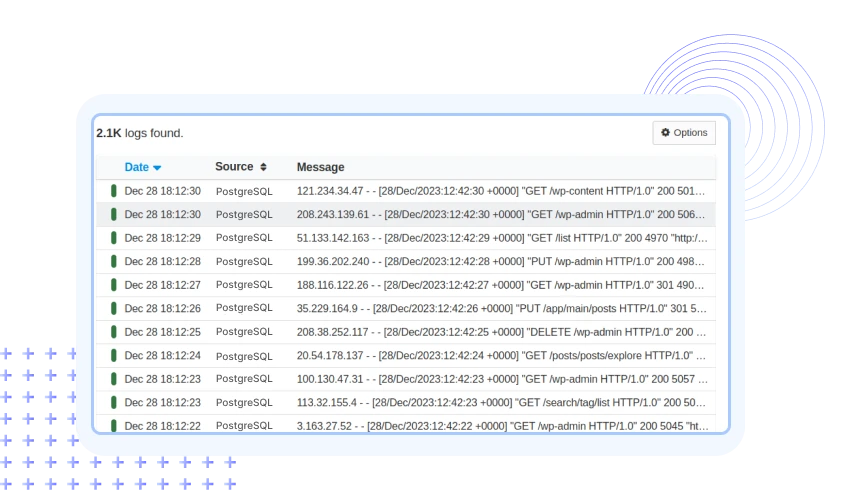
Database PostgreSQL Logs Monitoring
Ensure Continuous Database Monitoring Across all SQL and No-SQL Databases

We've Got Your Stack Covered!

Boost Framework Performance

Boost Framework Performance

Gain insights into your PostgreSQL performance, enhancing transaction flow and speeding up error resolution.

Trace Every Request Instantly

Trace Every Request Instantly

Visualize end-to-end traces across your stack, ensuring that you catch every PostgreSQL error, performance issue, or bottleneck before it affects users.

Identify Slow Queries Instantly

Identify Slow Queries Instantly

Pinpoint and resolve slow database queries and eliminate performance bottlenecks impacting your PostgreSQL application's responsiveness, leading to faster response times

Stay Alert to Vulnerabilities

Stay Alert to Vulnerabilities

Get alerted to potential library vulnerabilities, preventing security risks before they affect your customers or compliance.

Simplify Logs, Troubleshoot Faster

Simplify Logs, Troubleshoot Faster

Centralize all your PostgreSQL logs in one place, and quickly identify the root cause of issues using advanced filtering, pattern detection, and log pipelines.

Custom Metrics That Matter

Custom Metrics That Matter

Set up and track custom metrics that align with your app's KPIs to ensure you're monitoring exactly what matters most for your success.

Quick Request Analysis Anytime

Quick Request Analysis Anytime

Explore request-level analysis, including stdout APM logs, to understand execution times, bottlenecks, and areas that need optimization.

Align APM with Server Metrics

Align APM with Server Metrics

Correlate your app’s PostgreSQL APM metrics with server health to get a complete picture of your application’s performance and infrastructure dependencies.

Actionable Alerts

Actionable Alerts

Receive real-time alerts for PostgreSQL app performance degradations and critical issues. Take immediate action to prevent downtime and optimize user experiences.

FAQs on PostgreSQL Monitoring

What is PostgreSQL monitoring, and why is it important?

PostgreSQL monitoring involves the systematic observation and analysis of various performance metrics and parameters within a PostgreSQL database. It is crucial for ensuring the optimal performance, availability, and reliability of PostgreSQL instances. Monitoring allows you to detect and address potential issues, optimize resource usage, and maintain the overall health of your PostgreSQL databases, which are fundamental components of many web applications.

Why should I monitor PostgreSQL with Atatus?

Monitoring PostgreSQL with Atatus offers a comprehensive solution for gaining deep insights into the performance of your PostgreSQL databases. Atatus provides real-time visibility, customizable dashboards, and intelligent alerting capabilities, allowing you to proactively manage and optimize PostgreSQL instances. With Atatus, you can ensure high availability, quickly troubleshoot issues, and streamline the performance of your PostgreSQL-powered applications.

What metrics should be monitored in PostgreSQL?

Important PostgreSQL metrics to monitor include:

  1. Query performance metrics (execution time, throughput, etc.)
  2. InnoDB metrics (buffer pool usage, transactions, etc.)
  3. Connection statistics (connections, aborted connections, etc.)
  4. Replication metrics (lag, slave status, etc.)
  5. Server resource utilization (CPU usage, memory usage, disk I/O)
Which databases does Atatus support for monitoring?

Atatus supports a wide range of popular databases, including but not limited to MySQL, MS SQL, PostgreSQL, MongoDB, MariaDB, Redis, Memcached, SQLite, and Aerospike. The platform provides integrations and pre-built dashboards tailored to each supported database, allowing users to monitor and analyze their database performance effectively. Whether your application relies on MySQL or a combination of different databases, Atatus provides a unified platform for effective monitoring and optimization.

How does Atatus handle PostgreSQL query analysis for optimization?

Atatus provides Query Performance Monitoring, allowing you to identify slow queries, view query plans, and assess overall query performance. With this information, you can optimize queries for better database efficiency.

Is Atatus suitable for monitoring PostgreSQL in a distributed environment?

Yes, Atatus is designed to monitor PostgreSQL databases in both traditional and distributed environments. It supports monitoring across on-premises, cloud, and hybrid infrastructure, providing a unified view of your PostgreSQL performance regardless of the deployment model.

What kind of notifications does Atatus offer for PostgreSQL alerts?

Atatus supports various notification channels, including email, Slack, PagerDuty, and others. You can configure alerting policies with specific thresholds and conditions to receive timely notifications when PostgreSQL metrics deviate from expected values.

How long is my PostgreSQL query metrics available?

Data retention for PostgreSQL monitoring is set to 7 days by default. This can be changed in your billing settings to 60 or 90 days. Contact our Customer Success Representative if you require a longer retention period.

You're in good company.

You don't have to trust our word. Hear what our customers say!

Atatus is a great product with great support. Super easy to integrate, it automatically hooks into everything. The support team and dev team were also very helpful in fixing a bug and updating the docs.
Tobias
Tobias L
Full Stack Engineer, ClearVoyage
Atatus is powerful, flexible, scalable, and has assisted countless times to identify issues in record time. With user identification, insight into XHR requests to name a few it is the monitoring tool we choose for our SPAs.
Jan Paul
Jan-Paul B
Chief Executive Officer, iSavta
Atatus continues to deliver useful features based on customer feedback. Atatus support team has been responsive and gave visibility into their timeline of requested features.
Daniel
Daniel G
Software Engineer, MYND Management

Ready to see actionable data?

Avail Atatus features for 14 days free-trial. No credit card required. Instant set-up.