Web Page Monitoring
Get a complete overview of your website performance bottlenecks with the poor performing pages, highly detailed breakdown along with percentile and apdex charts giving you a granular view with actionable insights.

Get the whole story behind poor performing frontend issues
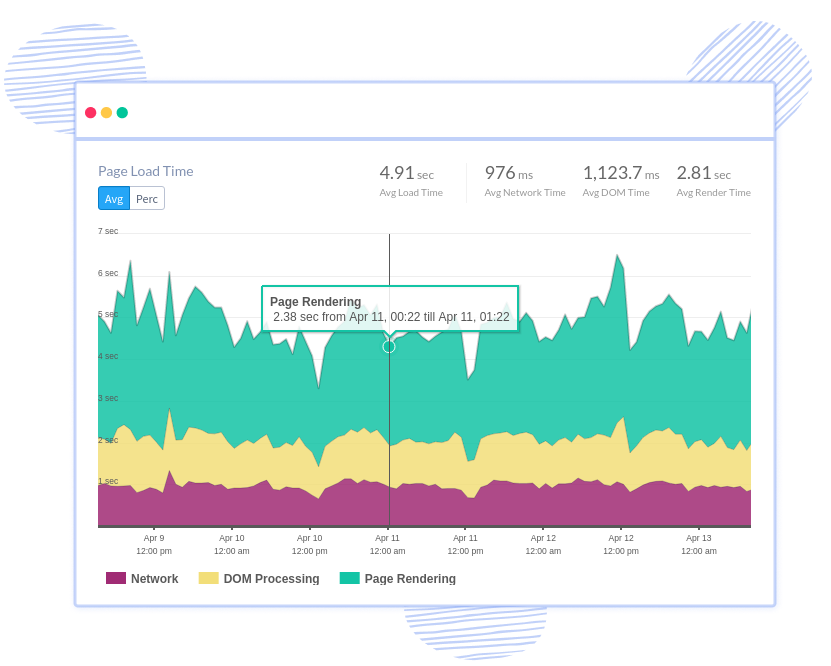
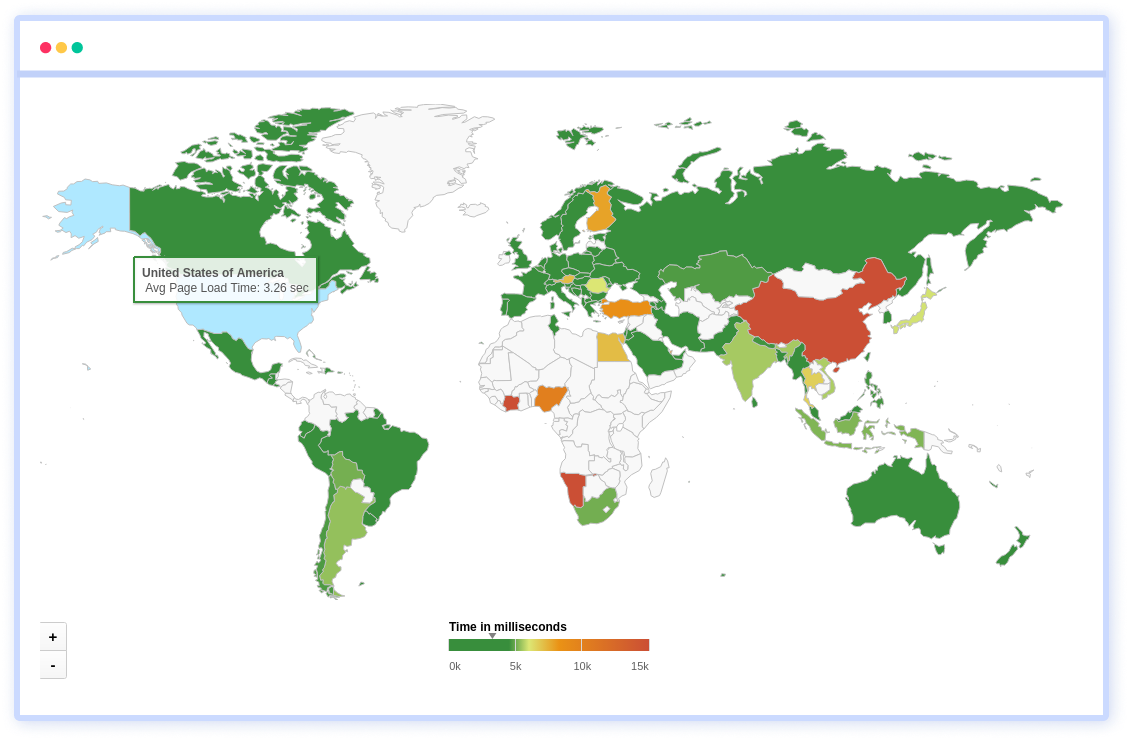
Automatically start monitoring your frontend and get to know where your app is spending its time with breakdown on DOM processing, Rendering and backend time. Analyze performance data to see how fast your website loads for users, and group them by country, browser and more.

Under performance impacts immediately
Identify performance bottlenecks immediately with the individual percentile of each page, along with apdex score, user satisfaction report, JS errors, session traces and more. Get actionable data to resolve issues and root cause problems faster.

Recognize how your users are impacted
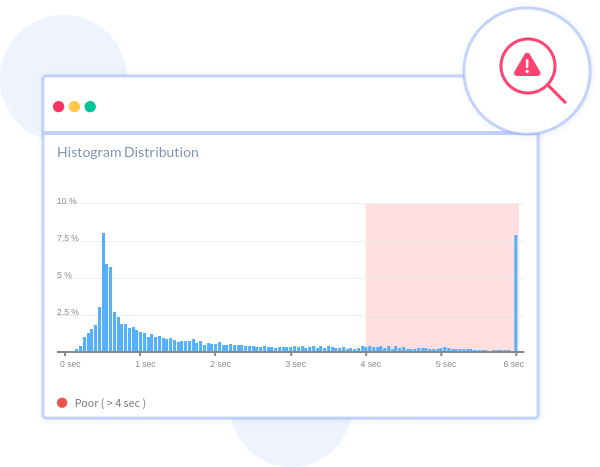
Get an immediate overview of the worst performing URLs and how your users experience these pages with user scores for all the pages. Dig deeper into each page URL with it’s own histogram, apdex charts, slow traces and more.


 +1-415-800-4104


