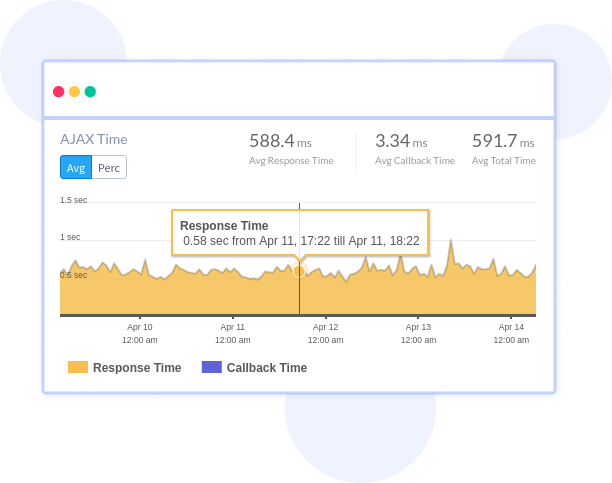
Ajax Calls Monitoring
Get the full visibility into how your AJAX requests are performing and having an impact on your frontend application’s performance. See the individual view of each network calls metrics, transfer sizes, errors and more.

Complete visibility into all outgoing network requests
Automatically capture and analyze AJAX requests to know which third party call is slowing down your application. Find the most resource-intensive AJAX requests by percentile, throughput, transferred data, received data, callback time and response time.

See AJAX calls impact on you frontend
Know all the AJAX calls that a particular Page or a SPA route change is dependent on. See how the performance of these calls have an impact on your users’ experience. Find it on a beautiful visual graph that makes bottlenecks immediately obvious.

Analyze and resolve XHR failures
Quickly see the failures that each of the AJAX endpoints have broken down into 4xx and 5xx error codes. Trace them into session traces, giving you an accurate sense of what your customers are experiencing.


 +1-415-800-4104


