Python Application Performance Monitoring
Get end-to-end visibility into your Python performance with application monitoring tools. Gain insightful metrics on performance bottlenecks with Python monitoring to optimize your application.
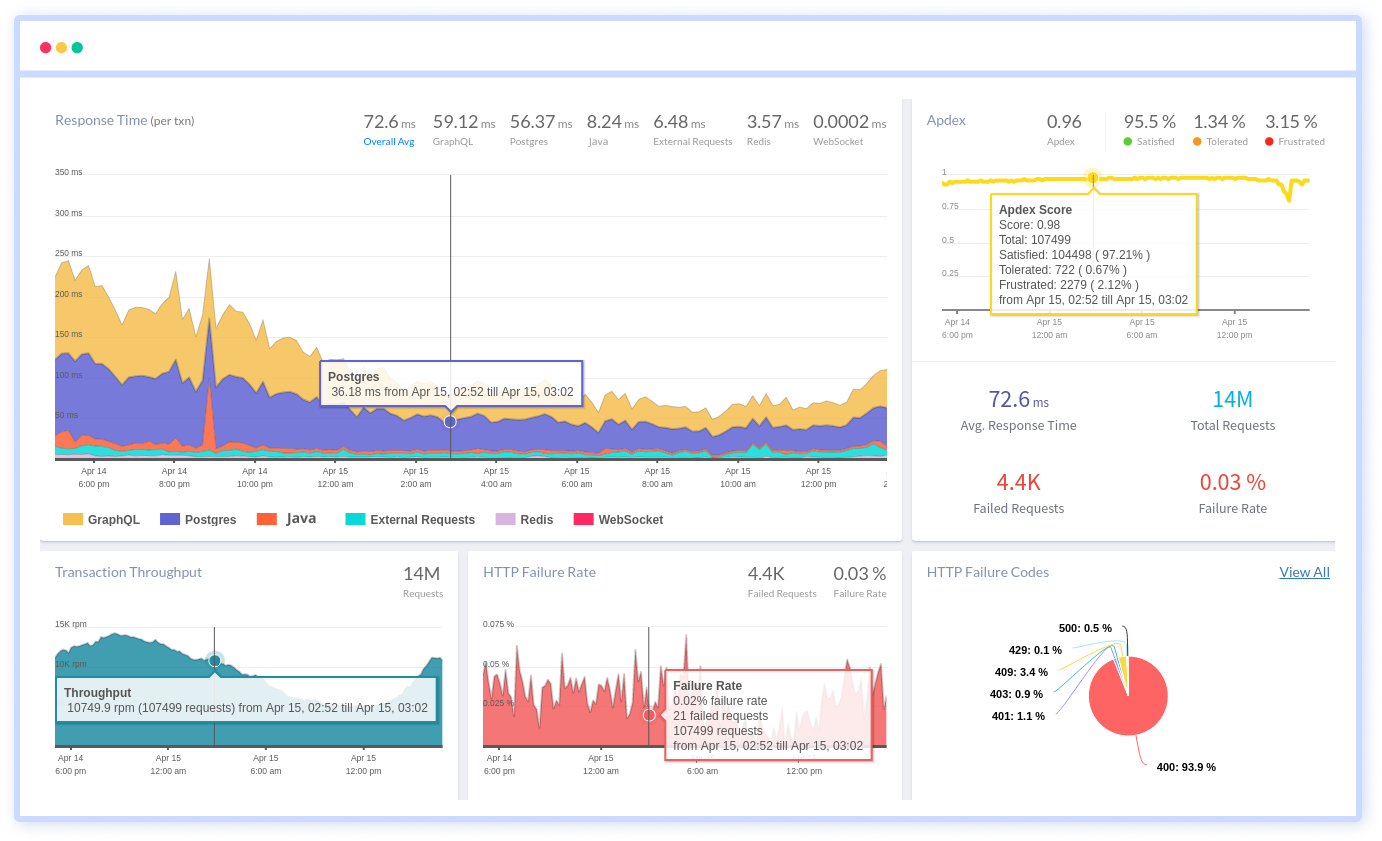
Why Python Production Issues Take Too Long to Diagnose
Hidden Execution Paths
Python services often run through layers of frameworks, middleware, and background workers. Critical execution paths disappear in production, leaving teams unsure how requests actually flow under real traffic.
Slow Root Analysis
When incidents hit, engineers jump between logs, metrics, and assumptions. Correlating symptoms to a single cause takes too long, especially when failures cascade across services.
Async Blind Spots
Event loops, coroutines, and task queues introduce behavior that is hard to reason about after deployment. Timing issues surface only at scale, without clear signals explaining why.
Scale Pressure Points
Code that works at low volume behaves differently under load. Memory growth, thread contention, and worker saturation emerge suddenly, often without obvious early warnings.
Noisy Error Signals
Production errors are rarely clean exceptions. Partial failures, retries, and timeouts blur the signal, making it difficult to separate real faults from background noise.
Ownership Confusion
In shared platforms, it is unclear which team owns a slowdown or failure. Without precise context, incidents turn into handoff loops instead of fast resolution.
Environment Drift
Differences between local, staging, and production environments hide critical behavior. Subtle config or dependency changes surface only when users are already impacted.
Confidence Erosion
Repeated incidents without clear explanations reduce trust in the system. Teams start shipping more cautiously, slowing delivery to avoid unknown risks.
End-to-End Performance Insight for
Python Applications
Real-time observability built for Python workloads to help teams diagnose issues faster, optimize execution, and maintain reliable production systems.
Follow Python Requests Across Every Layer
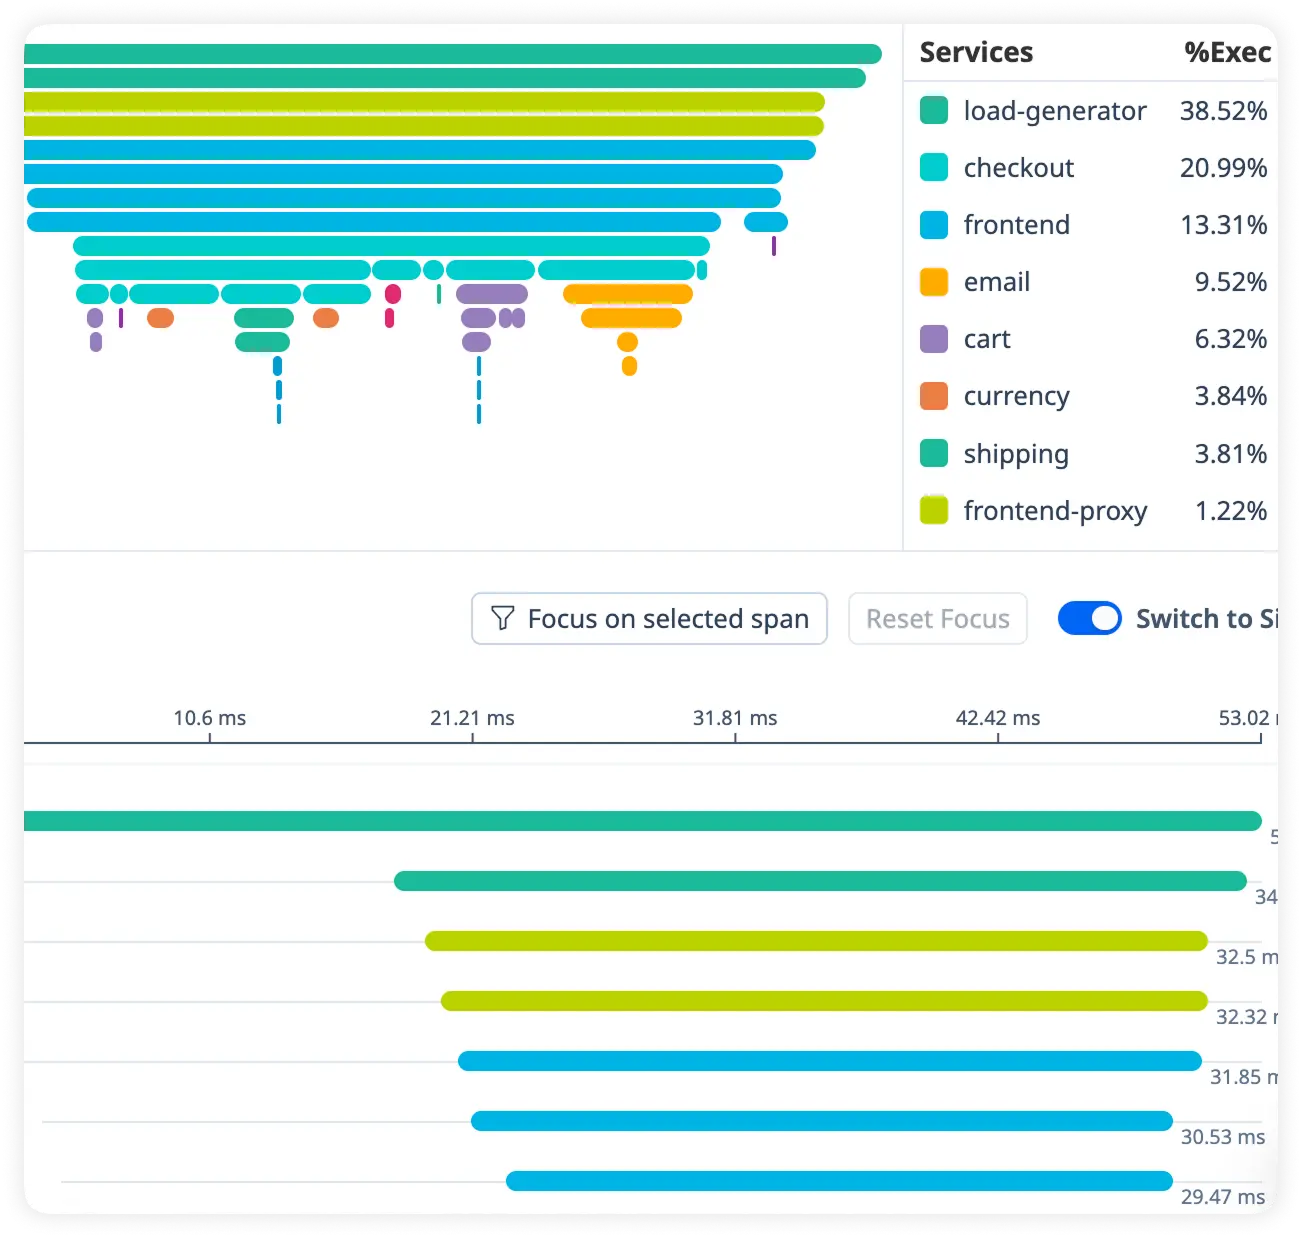
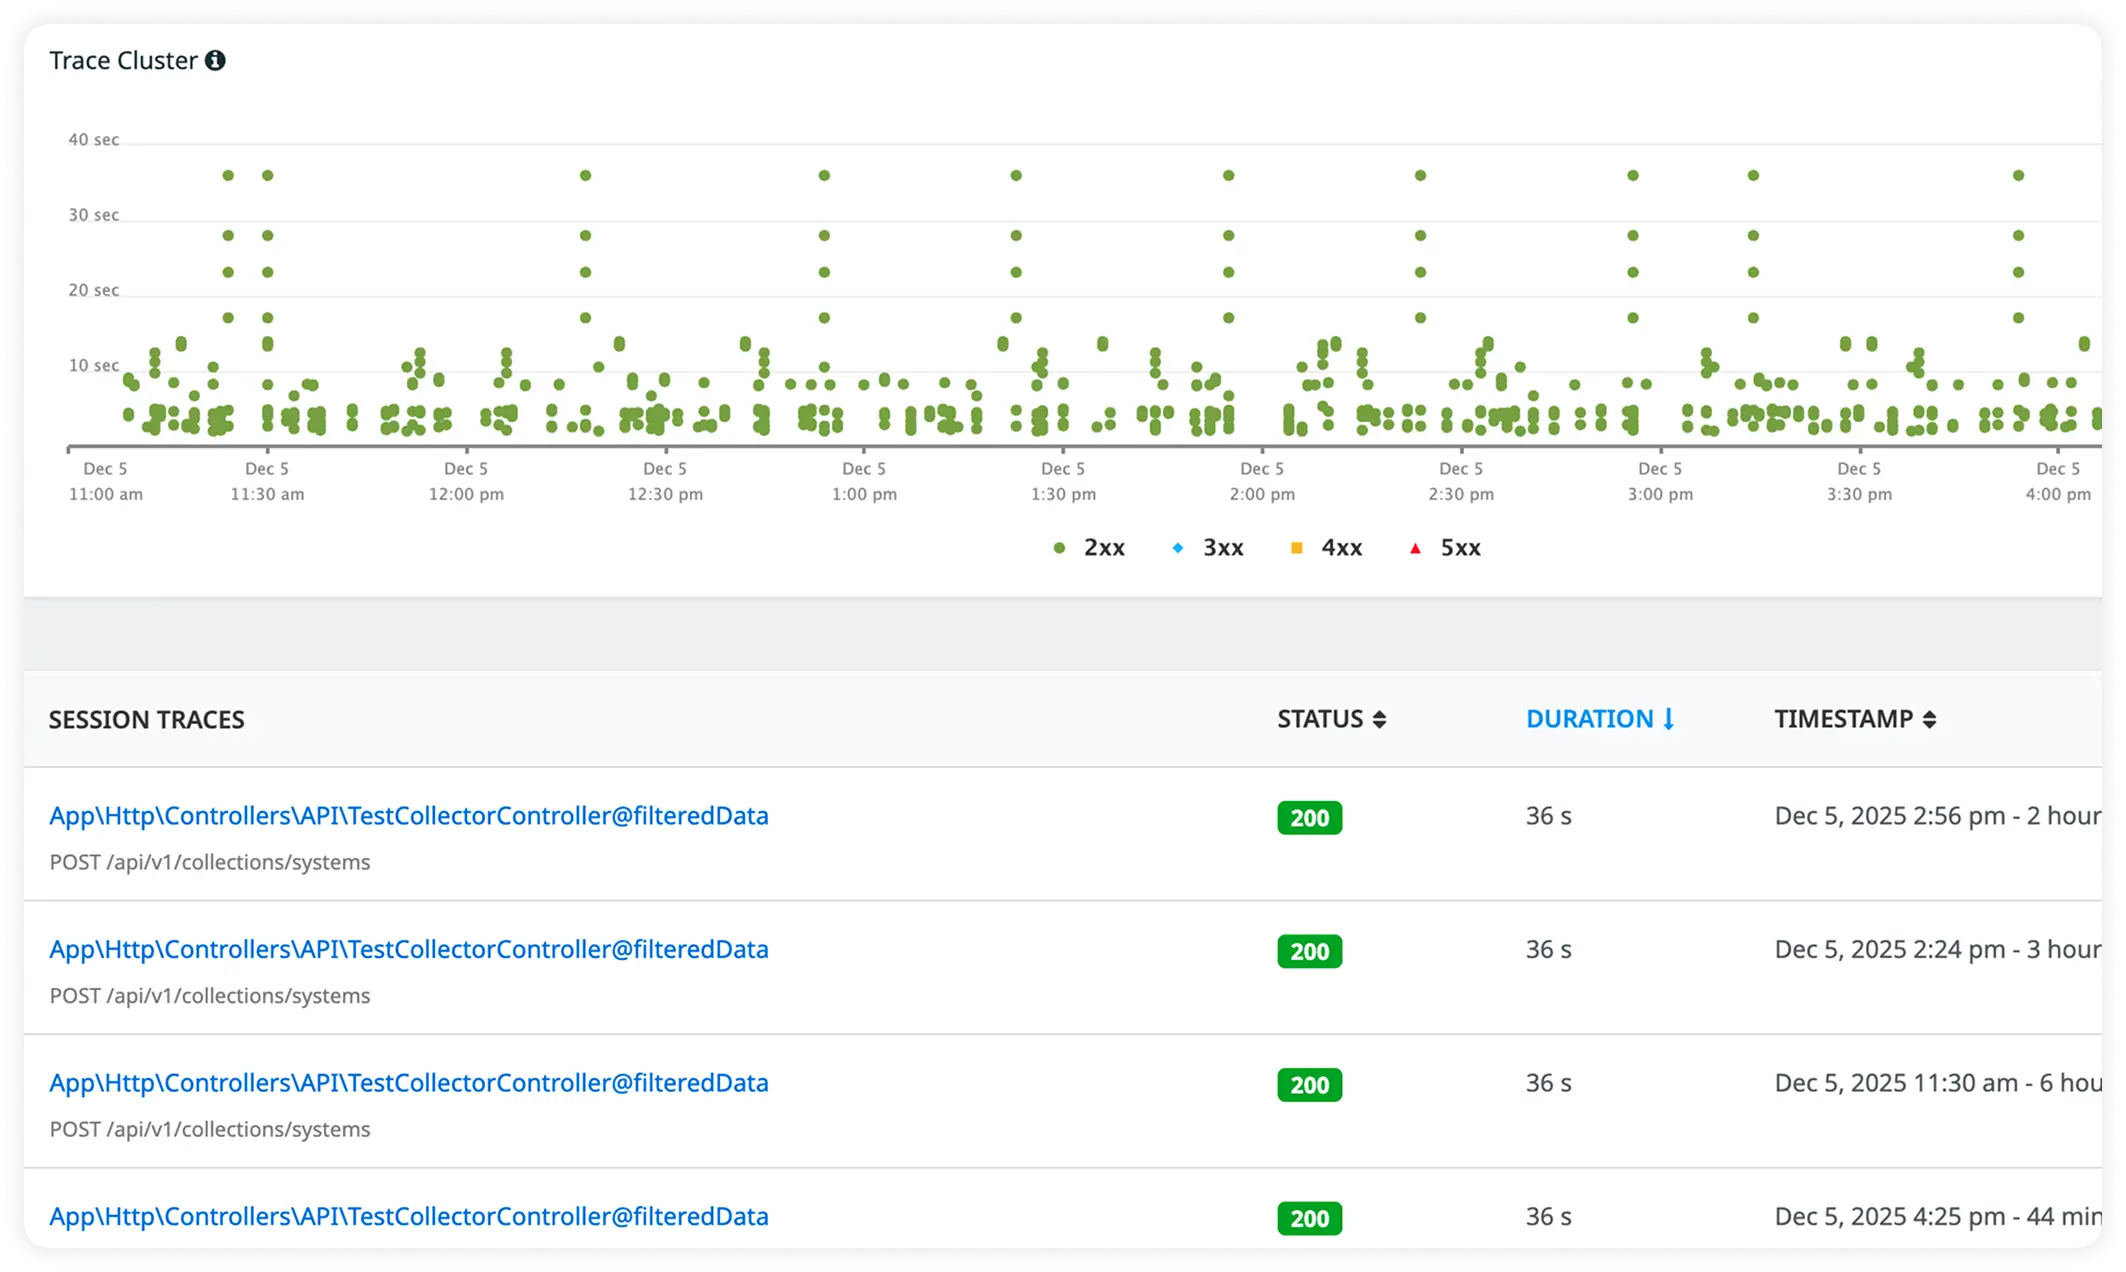
Track each request through services, APIs, databases, and background workers in a single distributed trace. Gain clear visibility into execution flow and performance behavior across your Python application.
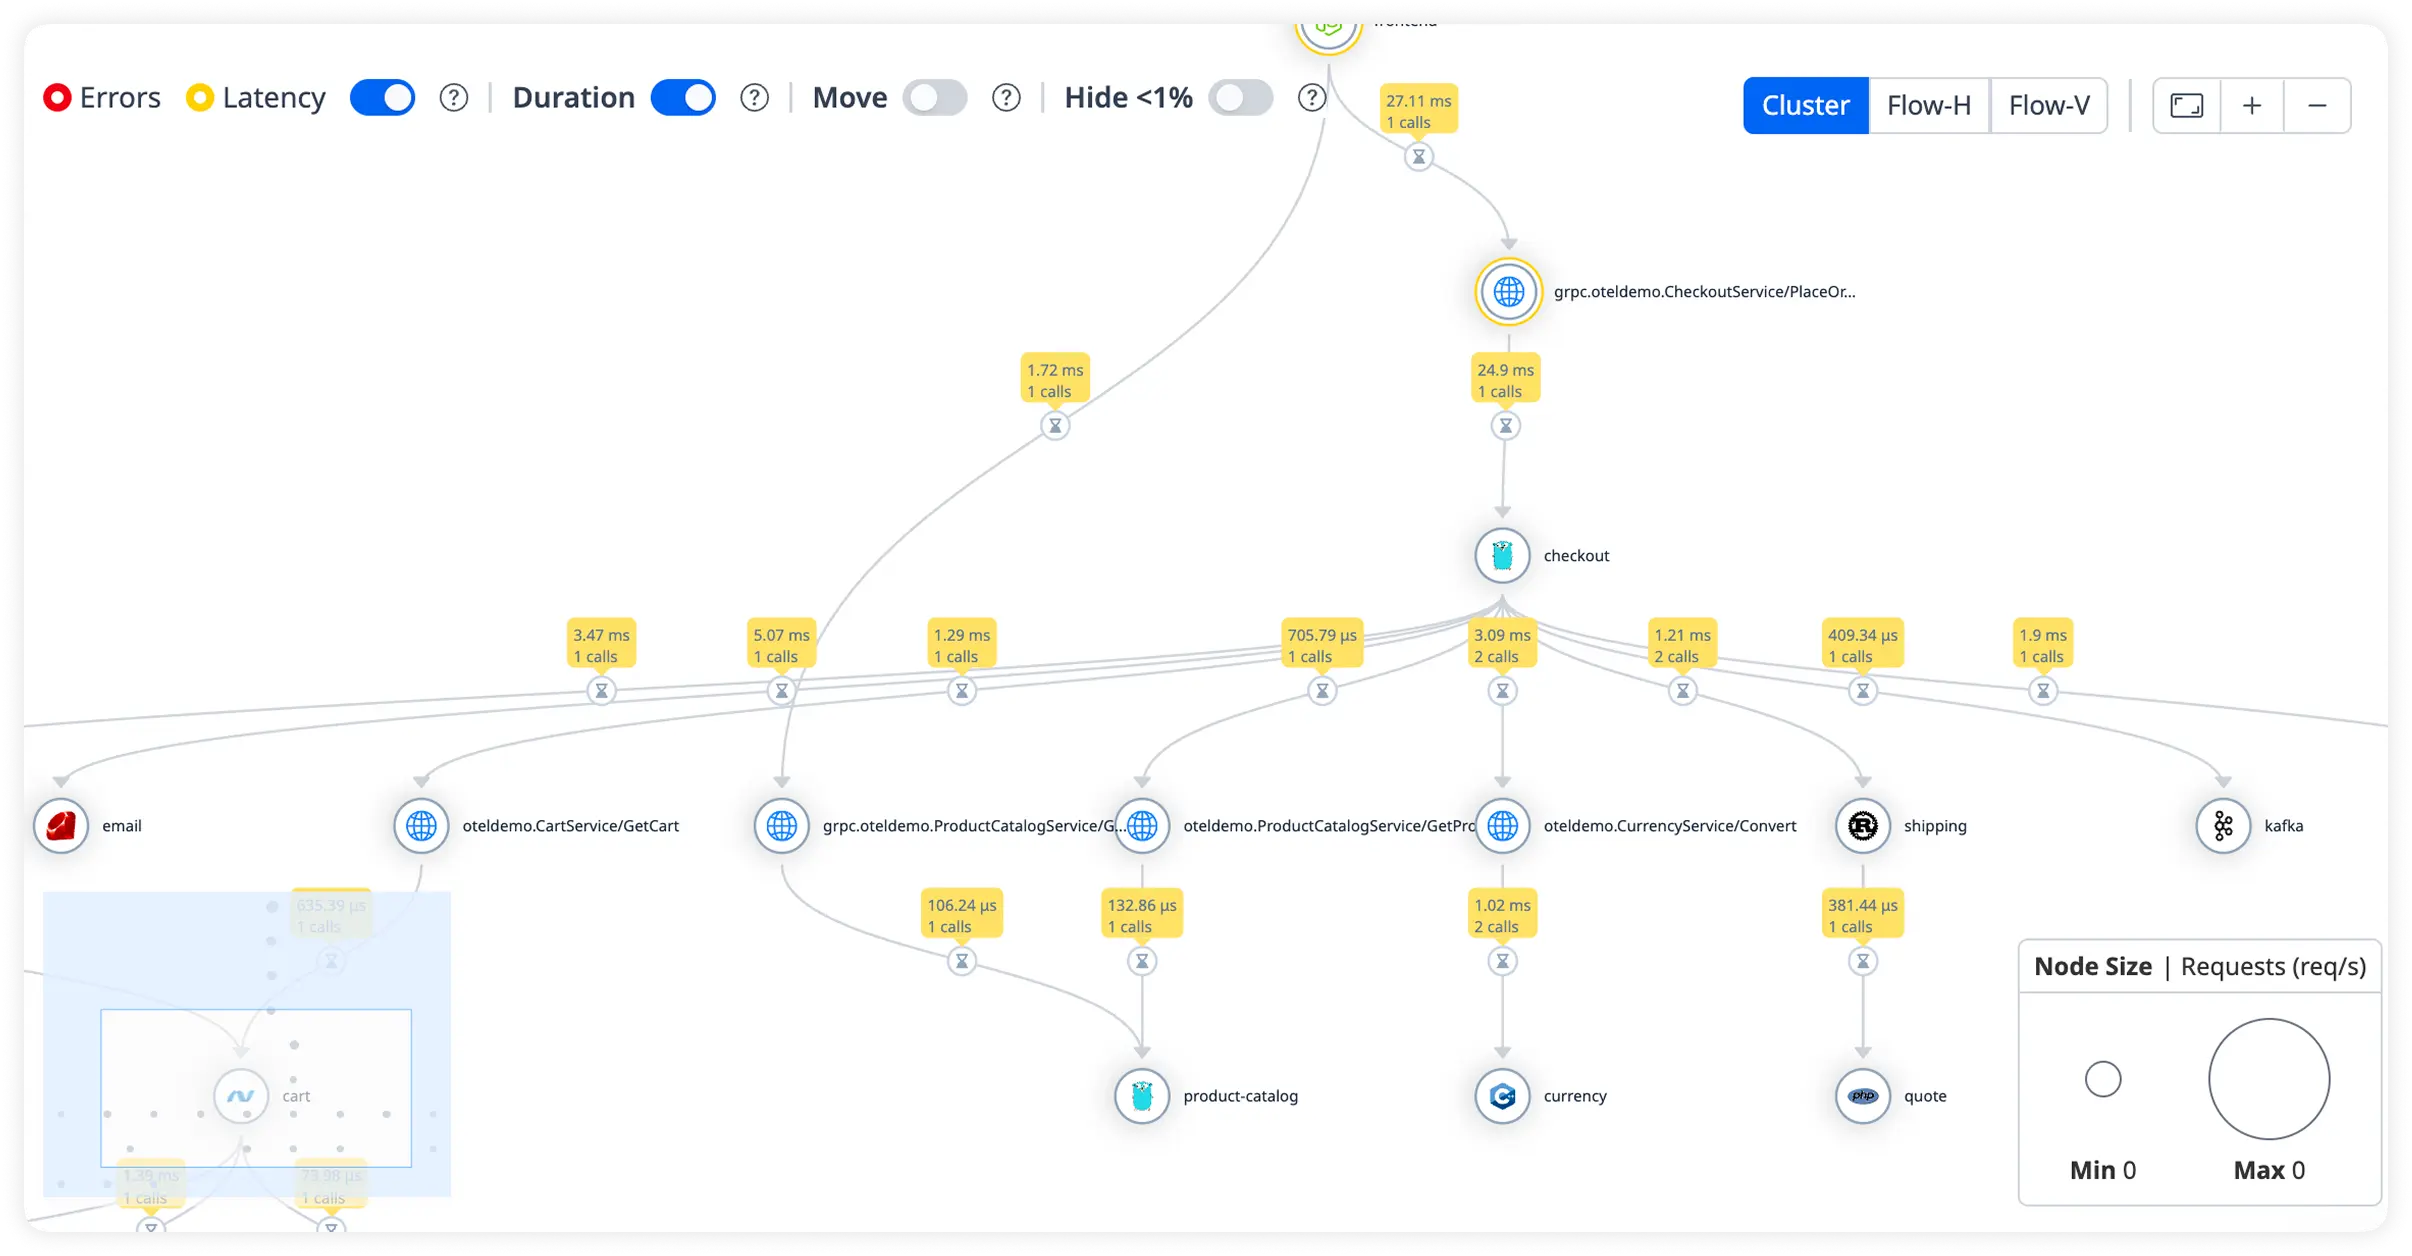
Understand Your Python Service Architecture
See how Python services connect with databases, message queues, caches, and third-party APIs. Quickly uncover latency patterns, failure points, and performance bottlenecks.
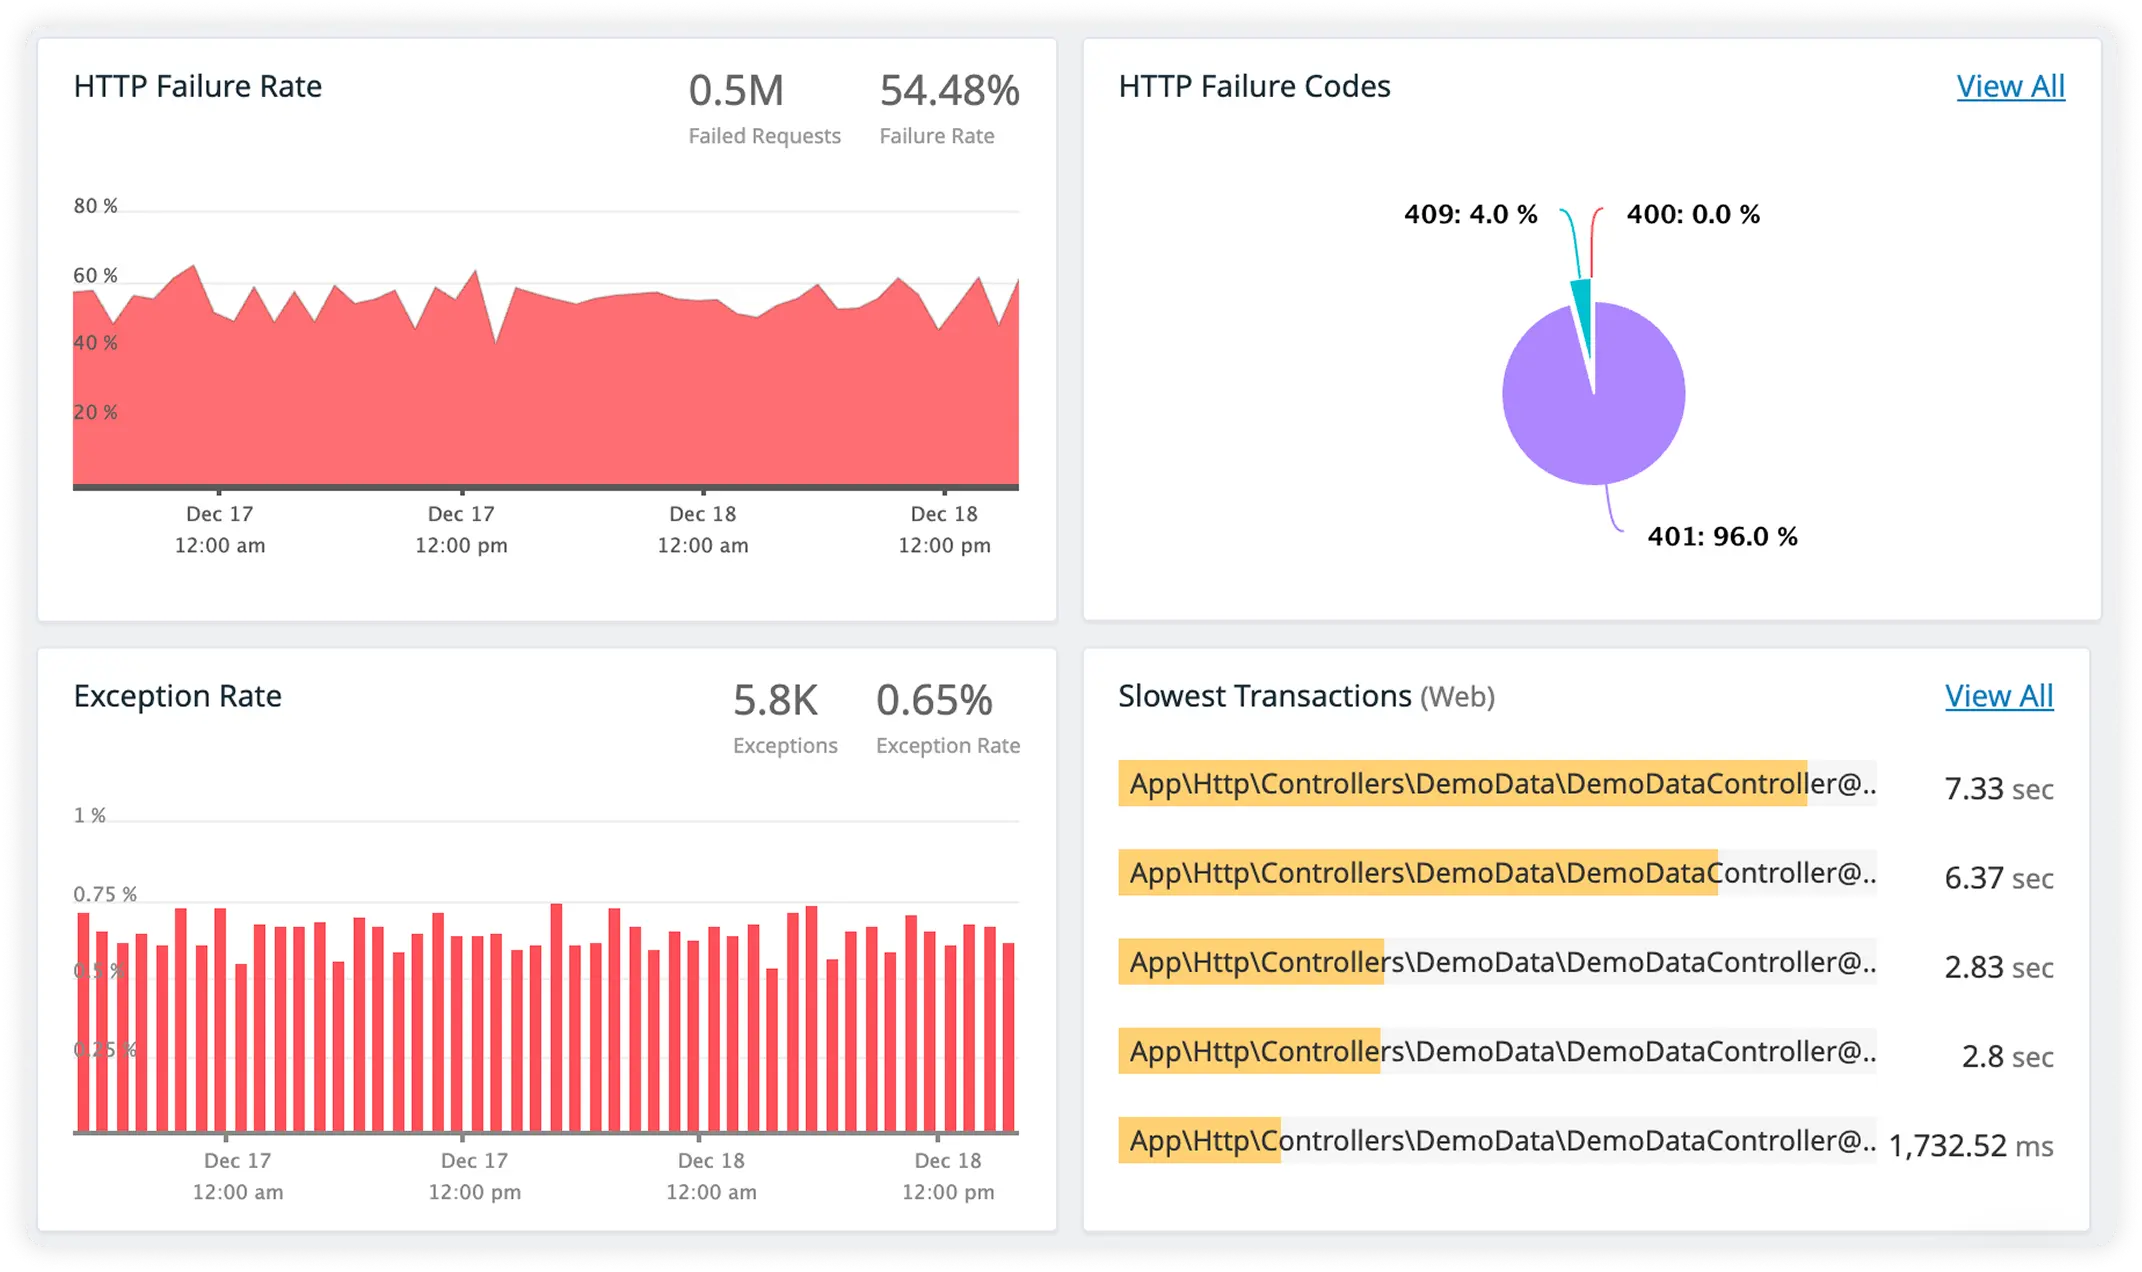
Keep Critical Python Workflows Running Smoothly
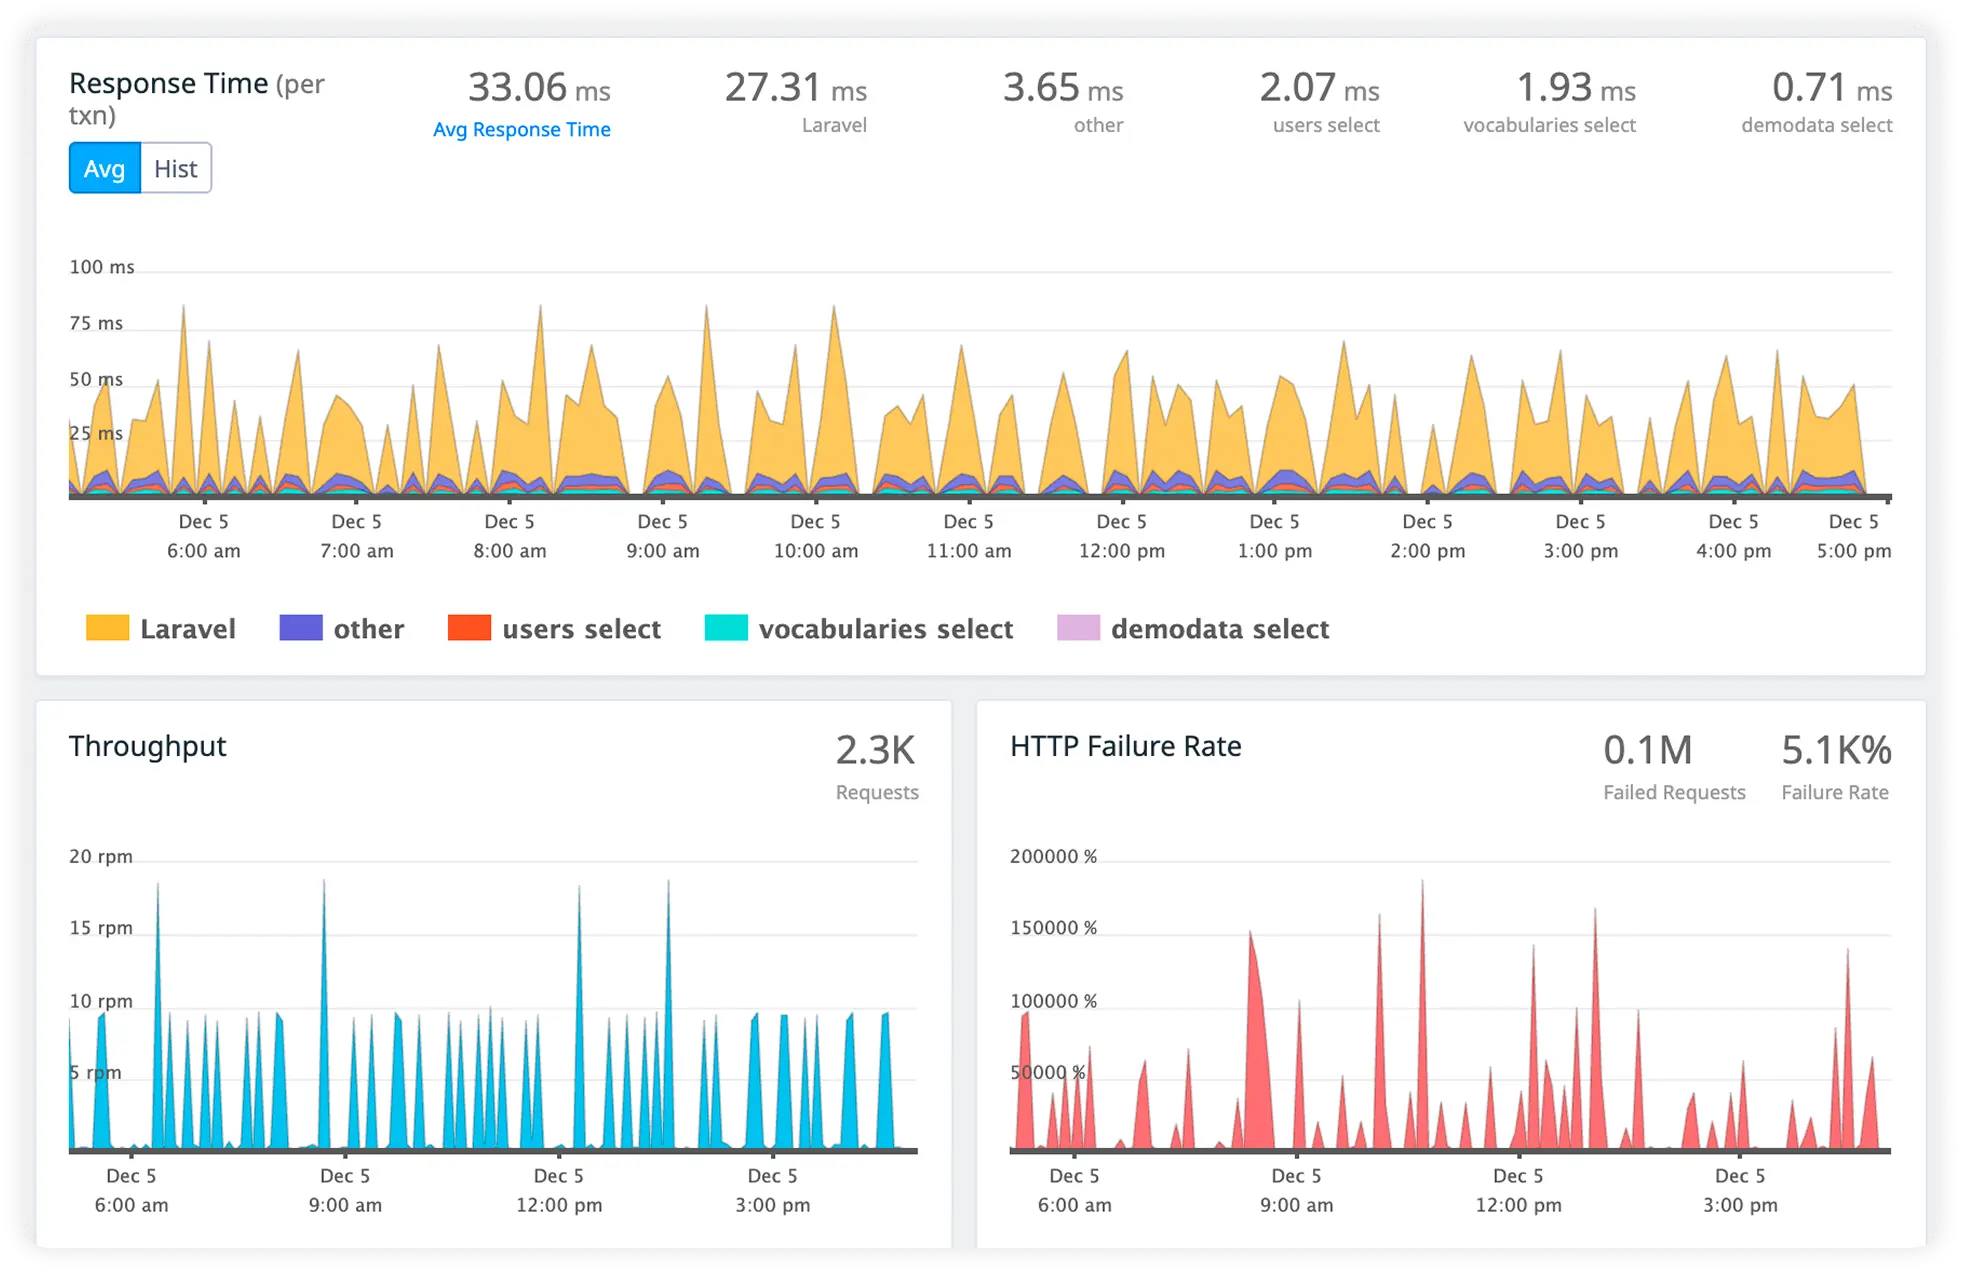
Monitor high-impact operations like data processing, authentication, API calls, and scheduled jobs. Spot slow transactions, error spikes, and performance regressions before users are affected.
Monitor External Services with Confidence
Track third-party dependencies and integrations your Python applications rely on. Detect outages and slow responses early to protect overall application performance.
Why Engineering Teams Commit to Atatus?
Atatus fits teams that value directness and accuracy. It integrates into engineering workflows without changing how teams think or work.
Clear Models
Teams want to understand how their Python systems behave in reality, not how they are supposed to behave. Atatus aligns observed behavior with how engineers think about execution.
Fast Team Adoption
Platform and backend teams value tools that fit naturally into existing workflows. Engineers can reason about production behavior without long onboarding cycles.
Developer trust
Engineers trust what they see because the system reflects real execution, not sampled guesses or partial views.
Trustworthy Signals
SREs rely on signals that reflect real system state. Atatus earns confidence by presenting data that matches what engineers see during incidents.
Reduced Guesswork
Decisions in production should be evidence-driven. Atatus helps teams move from assumptions to concrete understanding when something feels off.
Incident Readiness
When failures occur, teams need immediate context. Atatus supports faster incident response by grounding discussions in shared, reliable information.
Engineer Alignment
Backend, and SRE teams need a shared view of reality. Atatus helps reduce debate and aligns teams around the same operational truth.
Operational Confidence
Teams ship faster when they trust production. Atatus reinforces confidence by making system behavior understandable under real workloads.
Long Term Clarity
Teams want sustained insight into how systems evolve. Atatus supports continuous understanding as architectures and traffic patterns change.
Unified Observability for Every Engineering Team
Atatus adapts to how engineering teams work across development, operations, and reliability.
Developers
Trace requests, debug errors, and identify performance issues at the code level with clear context.
DevOps
Track deployments, monitor infrastructure impact, and understand how releases affect application stability.
Release Engineer
Measure service health, latency, and error rates to maintain reliability and reduce production risk.