Vue.js Application Performance Monitoring
Get deeper visibility into your Vue.js front-end app. Debug Vue.js apps and improve web app performance with powerful insights using Vue.js monitoring.
Achieve complete visibility into Vue reactivity chains and real user component lifecycles
Full Vue reactivity chain tracing
Track reactive ref/computed dependencies, watcher executions, and proxy traps to identify expensive reactivity cascades in production.
Vue Router navigation waterfalls
Monitor route guards, keep-alive cache hits, and dynamic imports to pinpoint slow transitions and page load delays.
Composition API performance
Measure setup() function execution, reactive() scope tracking, and composable function overhead across real sessions.
Vue runtime error capture
Capture template compilation errors, runtime assertion failures, and vnode hydration mismatches with full component lineage.
Teleport & portal interaction delays
Detect responsiveness issues in teleported modals, popovers, and off-DOM content that affect user flows.
Reactivity to DOM correlation
Connect slow user interactions to specific reactive dependencies, watcher triggers, and template re-render paths.
SSR & hydration insights
Analyze Nuxt/Vite SSR hydration mismatches, island architecture performance, and partial hydration timing.
Component tree optimization
Validate dynamic component switching, async component loading, and Suspense boundary performance in real traffic.
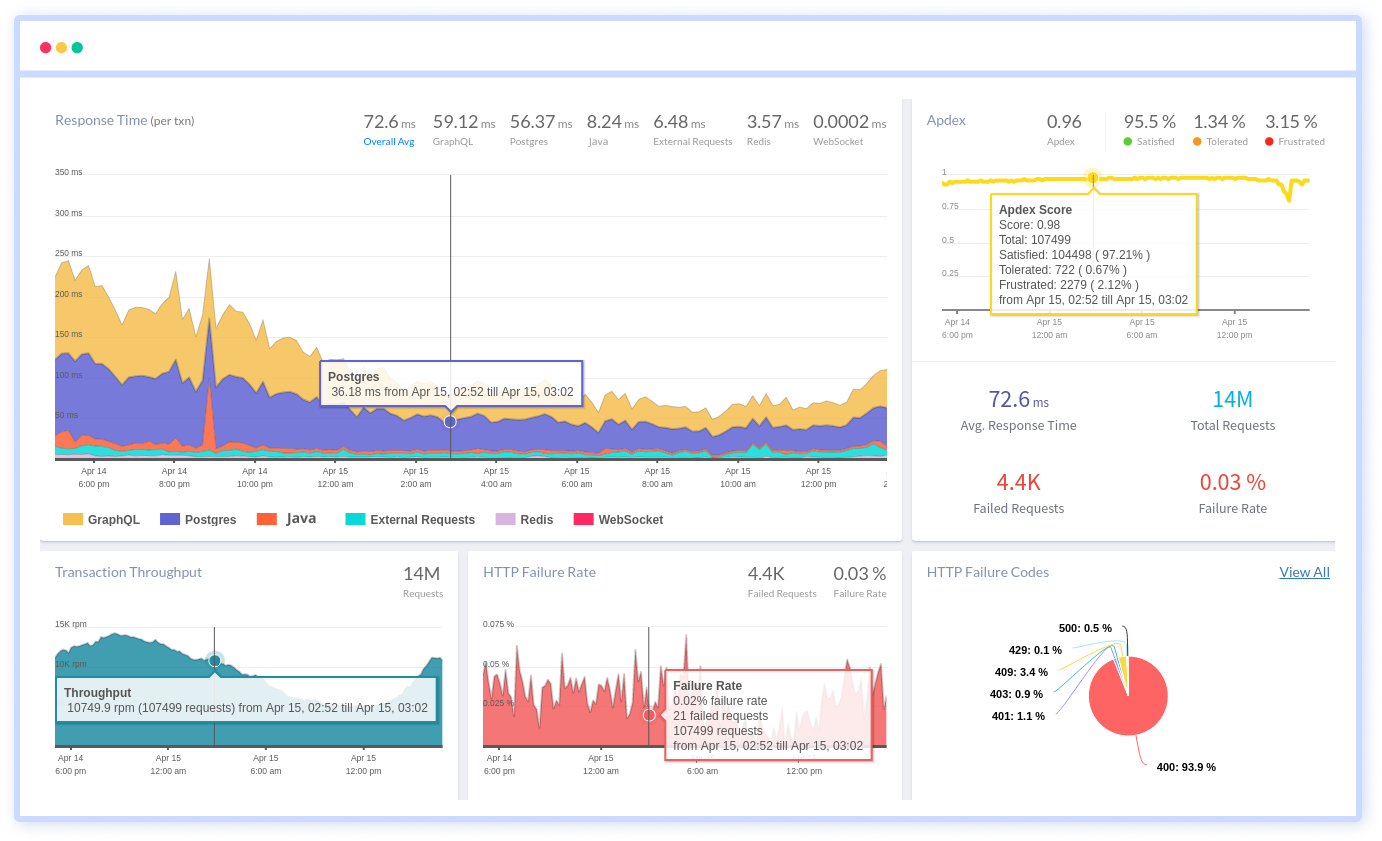
Reactivity System Execution
- Measure reactive update frequency at component level during real user interactions and correlate execution cost with actual DOM patch latency to understand rendering impact.
- Identify computed properties and watchers that trigger repeated updates without meaningful state changes, creating unnecessary processing overhead.
- Analyze update cycles during initial mount, state changes, and re-render phases to isolate the exact contributors to rendering delays.
- Detect reactive state propagation across deep component trees that causes redundant re-renders, layout shifts, and UI instability.
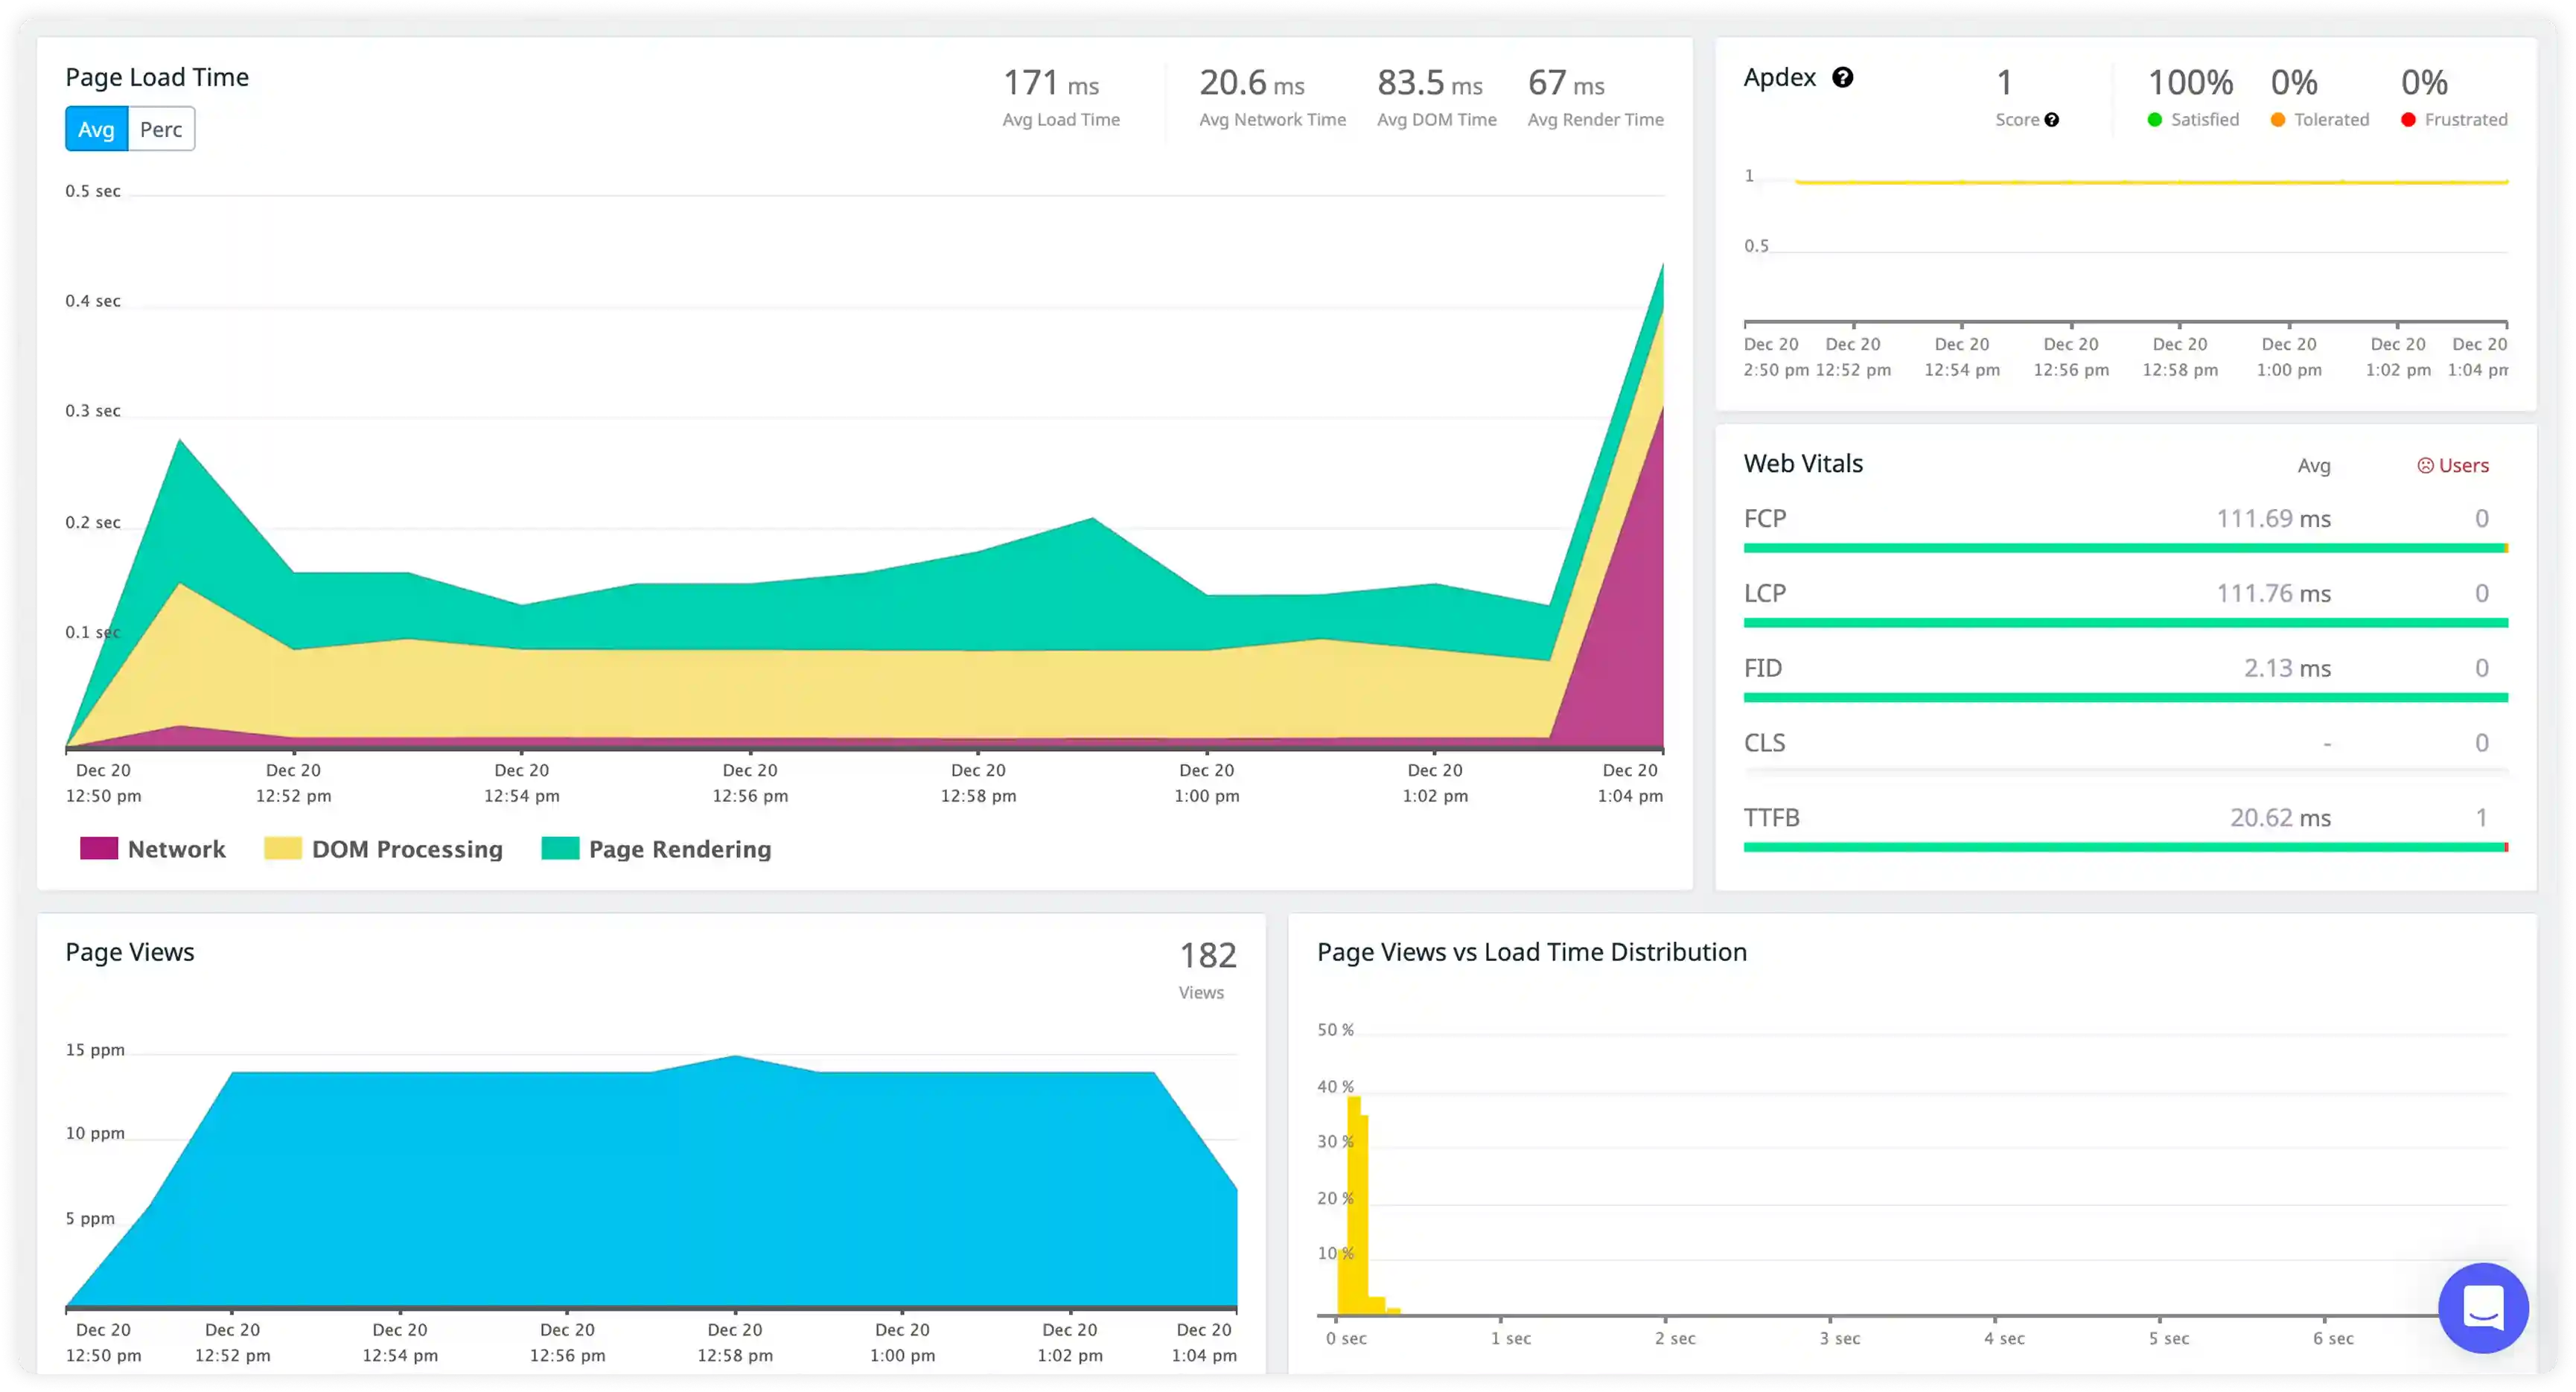
Virtual DOM Rendering and Lifecycle Execution
- Track virtual DOM diffing and patch timing during user-driven updates, route changes, and navigation flows to understand rendering efficiency.
- Measure the precise delay between reactive state mutations and DOM update completion to surface slow render paths.
- Analyze lifecycle hook execution timing during initialization, updates, and teardown to detect expensive operations.
- Identify blocking logic inside mounted, updated, or created hooks that delays paint and interaction readiness.
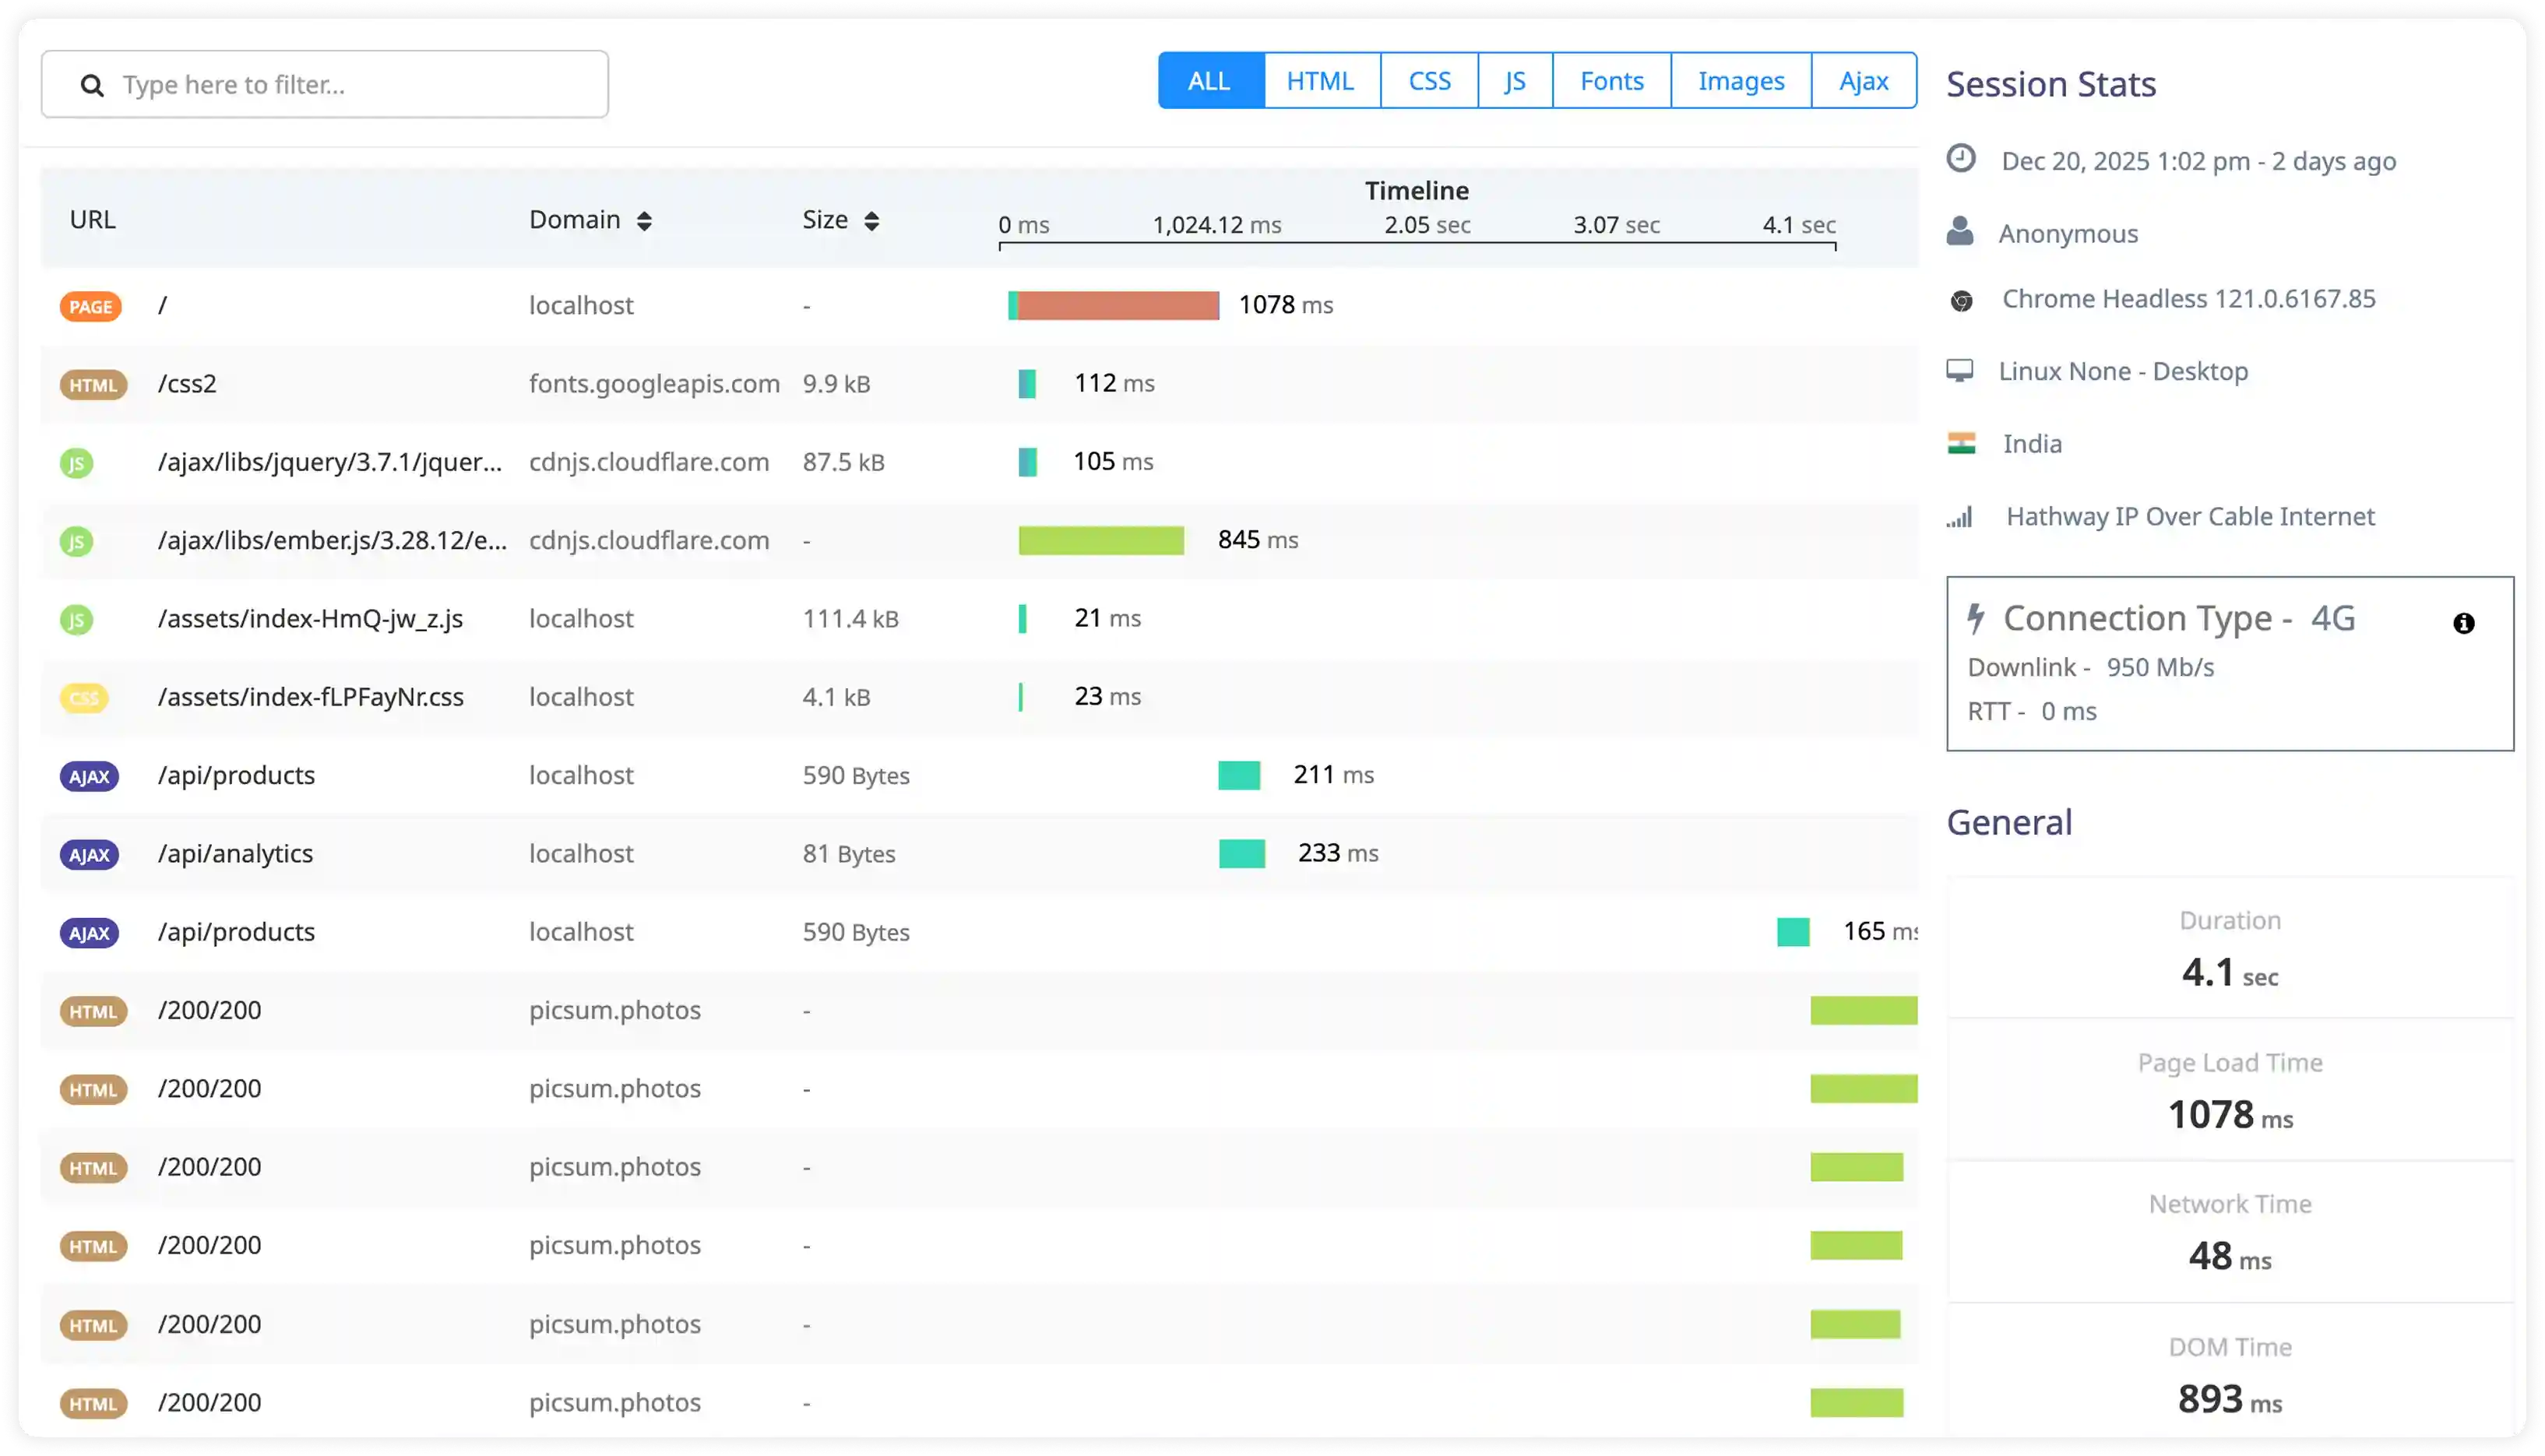
Asynchronous Execution and Event Handling
- Track async execution from API calls, background timers, promises, and event-driven workflows across the application.
- Measure delay between async task completion and UI updates triggered by reactive state changes to identify slow render paths.
- Identify concurrent async tasks that compete for main thread time and block rendering or user interactions.
- Correlate async execution timing with interaction readiness, visual stability, and perceived performance.
Router and State Management Execution
- Break down route transition timing across navigation guards, async components, data fetching, and final view rendering steps.
- Measure lazy-loaded component load and render latency across different devices, browsers, and network conditions.
- Analyze Vuex or state store mutation processing time and action execution latency during complex user workflows.
- Detect redundant global state updates that trigger repeated component re-renders and unnecessary DOM updates.
Why Choose Atatus for Vue RUM?
Master Vue reactivity performance, template compilation, and composition patterns without setup complexity
Built for Vue reactivity
Deep visibility into proxy-based reactivity, effect scopes, and dependency collection in production environments.
Vue-specific diagnostics
Template compilation traces, reactivity cycle analysis, and vnode diffing insights accelerate debugging.
Zero-config Vue integration
Automatic plugin detection works with Vite, Nuxt, Vue CLI—lightweight with comprehensive session coverage.
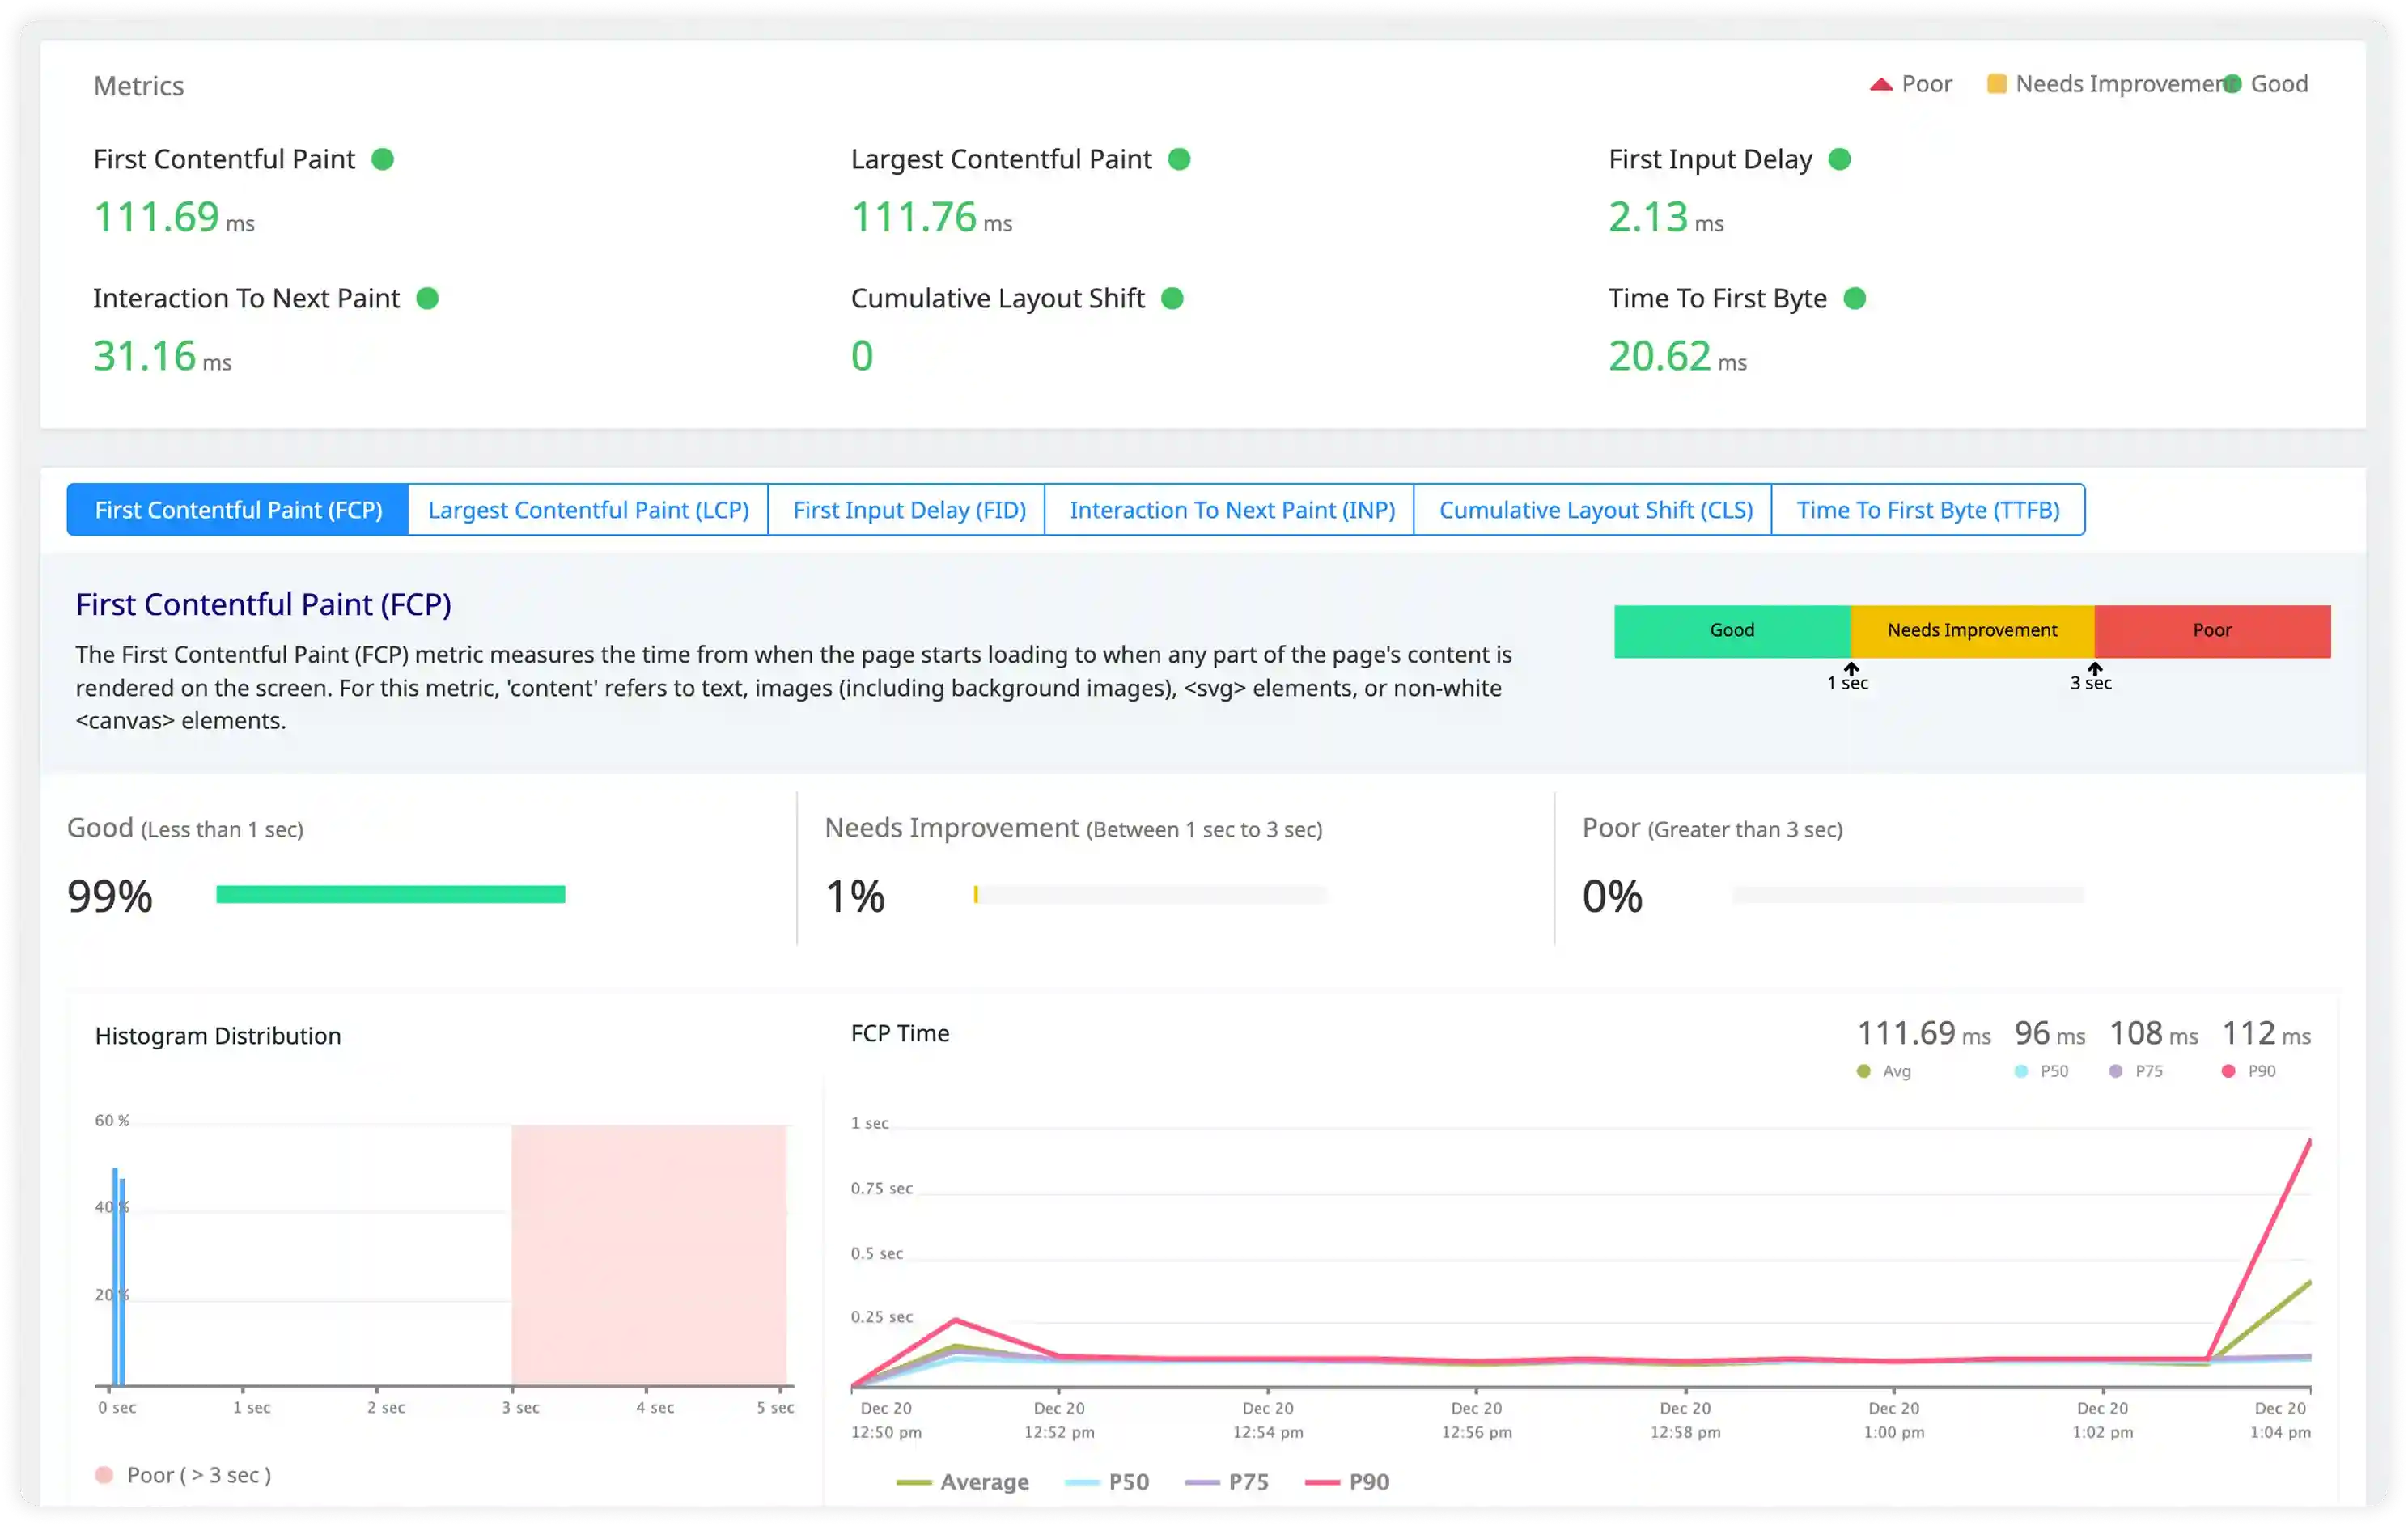
Actionable Core Web Vitals
Vue-attributed LCP, CLS, INP metrics with reactivity chain context and template render attribution.
Global Vue deployment scaling
Handles enterprise Vue SPAs, micro-frontends, and CDN deployments with consistent reliability.
Flexible growth pricing
Usage-based model scales seamlessly with Vue user traffic—no contracts or tiered limitations.
Unified Observability for Every Engineering Team
Atatus adapts to how engineering teams work across development, operations, and reliability.
Developers
Trace requests, debug errors, and identify performance issues at the code level with clear context.
DevOps
Track deployments, monitor infrastructure impact, and understand how releases affect application stability.
Release Engineer
Measure service health, latency, and error rates to maintain reliability and reduce production risk.