User Journey
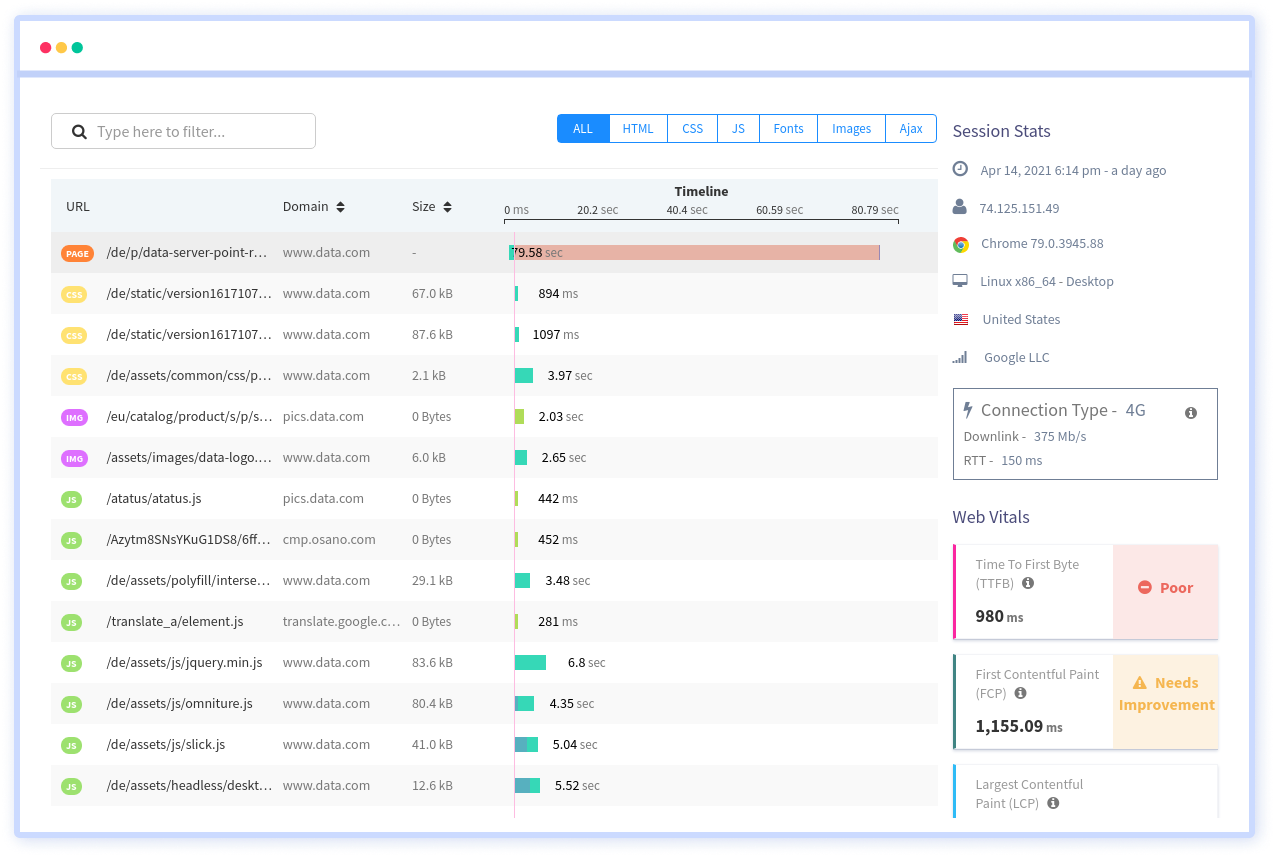
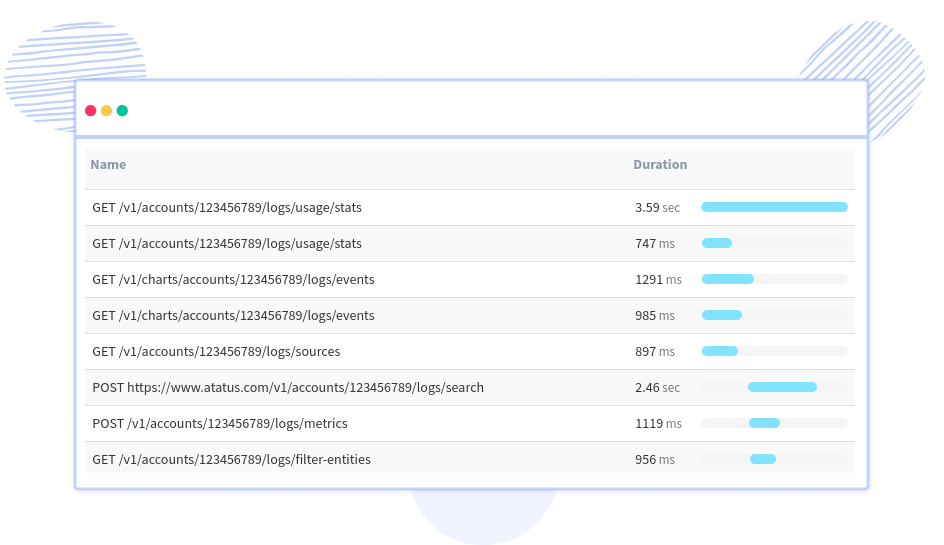
Automatically collect and correlate every user action including page loads, XHR requests, JS errors, route changes and more during a user’s session into a single journey to understand individual customers if they are affected by poor experiences.

Correlate all user actions to understand their experience
View an individual user session to understand which performance problems, JS errors, actions they encountered that determine individual user experience. See related slow traces that happen in this timeline for resolving issues.

Identify customers with userId, email and name
Set user attributes to group views together and understand how your internal users have been experiencing your application across devices. See in depth sessions and errors that affect on a per user level

Capture critical user actions and see failures encountered
Every user action such as login, signup, checkout, adding to cart and more can be measured individually. See how the custom performances are, how many have been successfully completed and how the failures impact the user sessions.


 +1-415-800-4104


