APM

Application Performance Monitoring

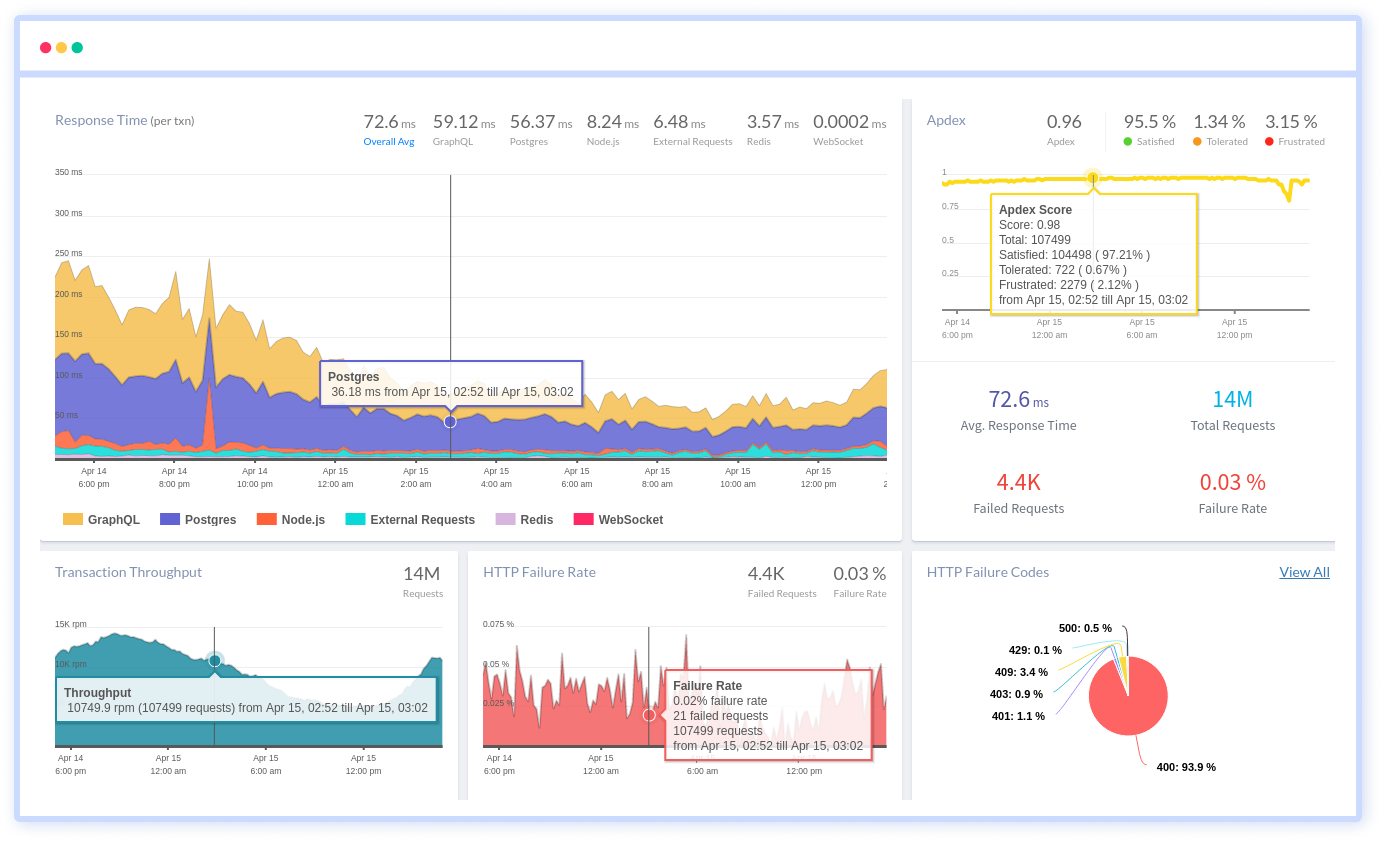
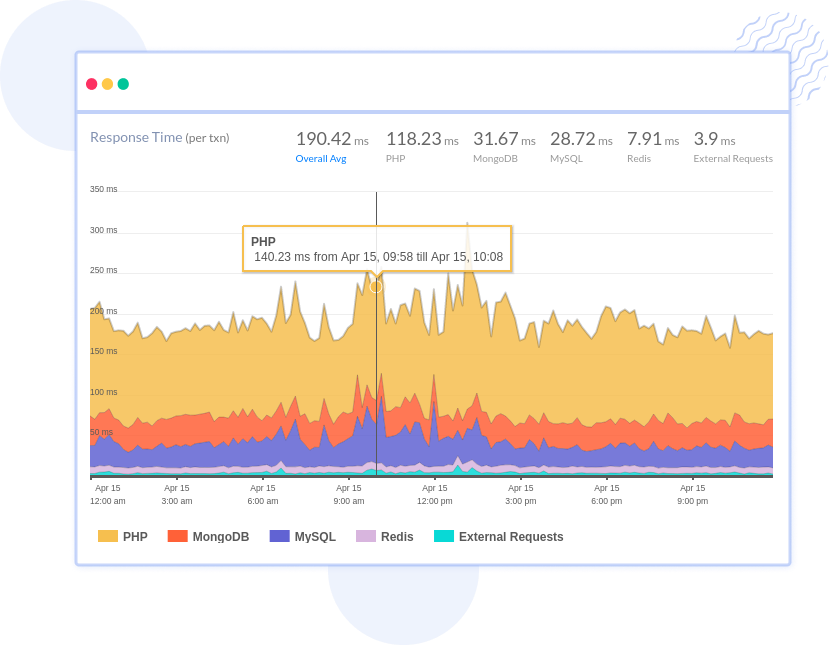
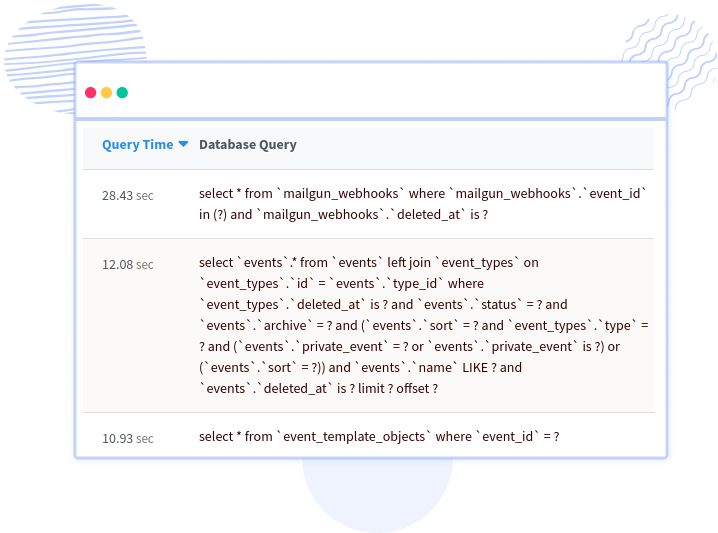
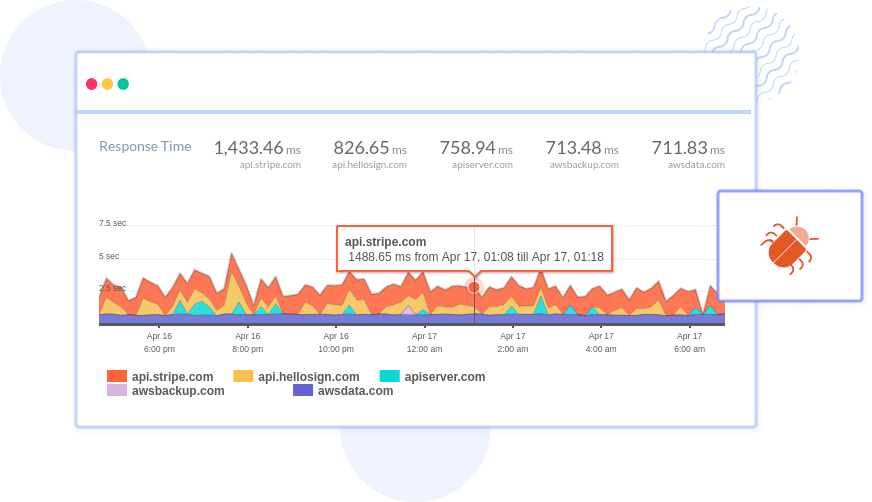
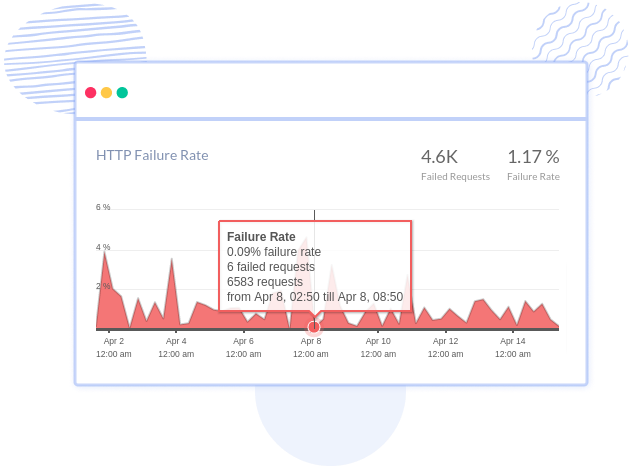
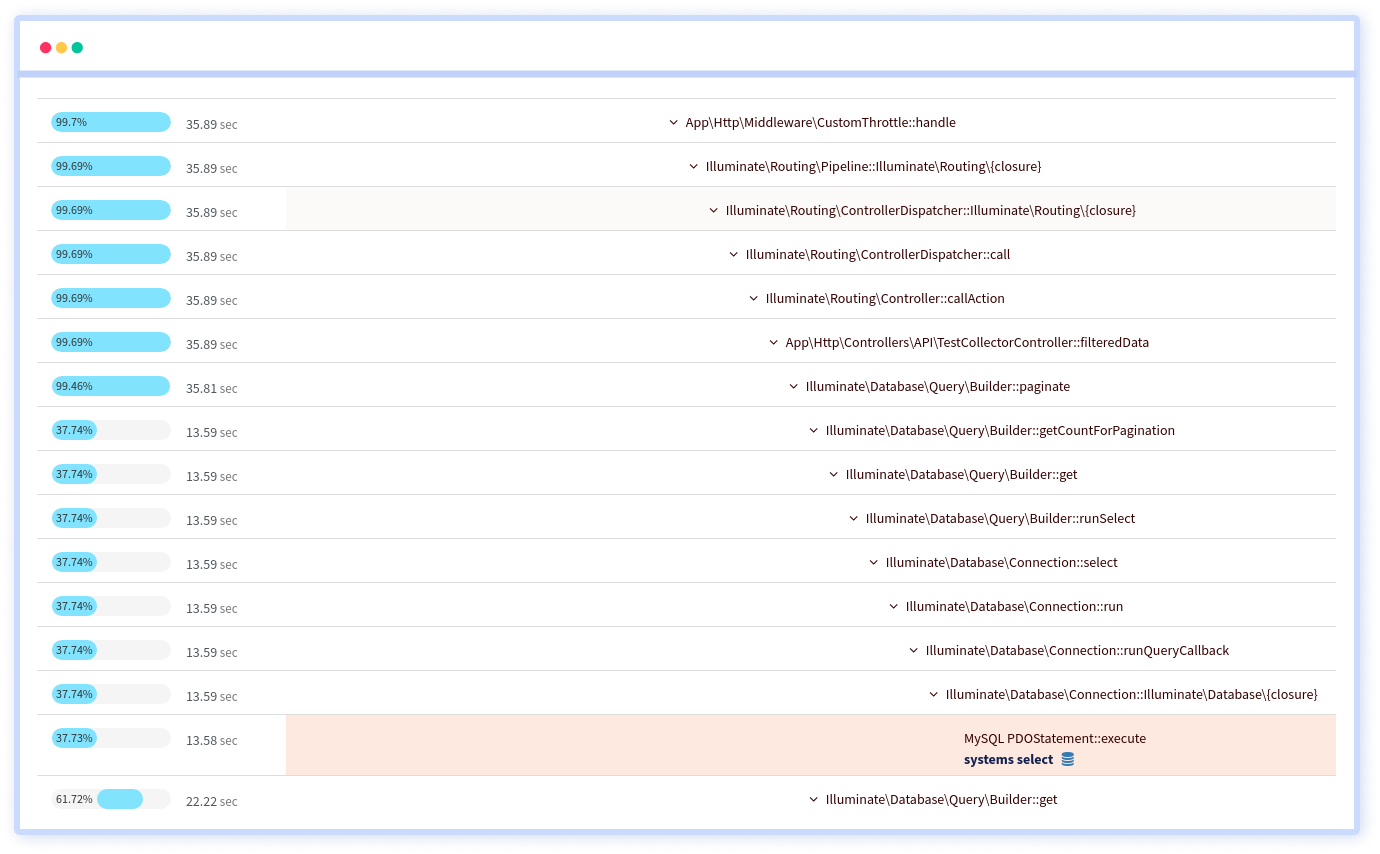
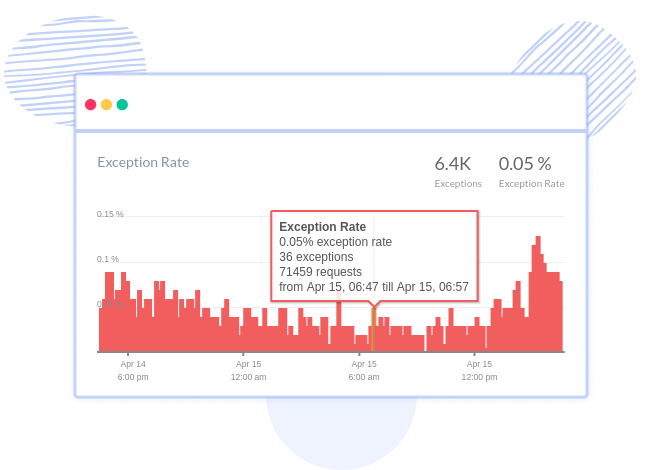
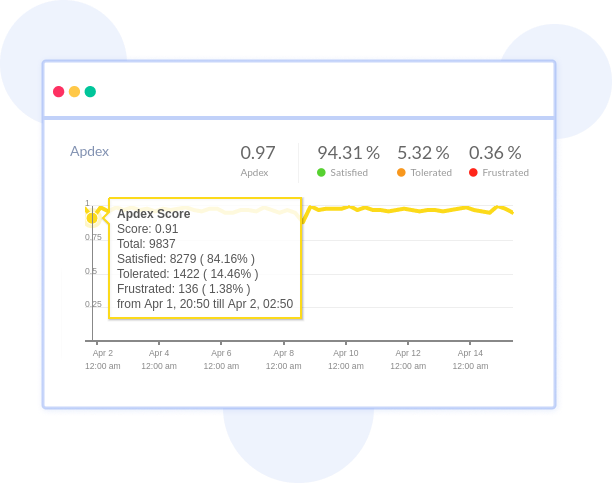
Get full visibility of your application performance in real-time along with in-depth transaction details, slow database queries, poor performing network calls, and more. Atatus helps you in finding root causes and fixing issues faster.

Try Atatus APM with 14-day free trial.
Application Performance Monitoring
Application performance monitoring for every language

Get a complete picture of your application performance

Atatus makes application monitoring easier with actionable insights, so you can isolate and resolve application performance issues holistically.

Distributed Tracing

Distributed Tracing

Trace requests across microservices and understand the journey of a transaction from start to finish. Identify bottlenecks with a clear view of how services interact.

Service Map

Service Map

Visualize all the services in your architecture and their dependencies. With application monitoring solutions, easily spot areas of latency and performance issues.

Slow Database Calls

Slow Database Calls

Detect and analyze slow database queries that impact application performance. Optimize query execution and database schema to improve the overall performance.

External API Performance

External API Performance

Monitor external API calls and their response times to identify any bottlenecks. Enhance APM observability by tracking how APIs affect your app's performance.

Error Tracking

Error Tracking

Automatically capture and track application errors and exceptions. Gain insights into recurring issues to improve application performance tools.

Smart Alerting

Smart Alerting

Configure intelligent alerts for high-priority incidents. Notify your team instantly on channels like Slack or email to resolve issues faster.

Log Monitoring

Log Contextualization

Correlate logs with the requests they belong to, providing actionable insights for faster debugging. Combine logs with runtime metrics.

Resource Usage Analytics

Resource Usage Analytics

Monitor CPU, memory, and disk usage for both applications and infrastructure. Identify resource-intensive operations impacting app's performance.

App Security

Application Security Insights

Identify potential security vulnerabilities such as exposed APIs or misconfigurations that may compromise your application's security.

SpeedSlow APIs

Track down poor performing routes

Get a complete picture of your requests to drill down in finding the slowest layers that are having an impact on your customers. With Transaction Monitoring, troubleshoot request performance issues using histogram and percentiles along with error rate. Find out the slow api responses and resolve them as quickly as possible.

Learn morearrow icon
Slow APIs
Query TimeSQL Query Performance

See worst performing SQL and stack traces

See detailed overview of your database performance, slow database queries and the ability to filter and view the original trace specific to that slow SQL query using Database Monitoring. View individual database breakdown and the throughput, to identify any degradation in the database response time.

Learn morearrow icon
SQL Query Performance
Network TimeExternal service instrumentation

Understand out-of-process services impact

Have visibility into performance of the calls to external services such as third party apps, microservices, and other network calls. See the most time consuming network calls performance and the requests that are most affected by it.

Learn morearrow icon
External service instrumentation
Failure countHTTP Failures

Identify and fix spike in end point failures

Quickly view highest HTTP failure and get each request information along with custom data to identify the root cause of the failures. See the breakdown of the API failures with HTTP Failure Monitoring based on HTTP Status Codes and the end-users having the highest impact.

Learn morearrow icon
API Failures
Slowest RequestSlowest Request Breakdown

See where your app is spending its time

Break down slow request traces by time spent in code blocks, database queries, external services, templates, message queues and much more. View logs, infrastructure metrics, VM metrics in context with the original request.

Learn morearrow icon
Slowest Request Breakdown
ExceptionsReal-time error monitoring

Stay on top of finding and resolving problems quickly

Spot out errors with Error Monitoring. See the full picture of any exception with in-depth diagnostics that let you know exactly what went wrong and how to fix it. Get all the data you need in one place including stack trace, request parameters, environment, affected users, host, and more.

Learn morearrow icon
Error Tracking
DeploymentTrack deploys

Quickly see impact of a deployment

Add deployment markers to measure how your customers are experiencing the recent code pushed into production. See how your software application was performing before and after deployment using deployment tracking with the list of slowed down requests, new errors and much more.

Release Tracking

Start fixing issues impacting your users right now

Start a 14-day free trial. No credit card, no code changes, no hassle.

Awesome Support

Crazy Easy Install, Fast Time to Value

"Installed it to track a Laravel + MySQL app. Installation was insanely fast and easy, way way easier than the others I tried. I've already found a bunch of queries that need to be tuned, so I'm getting a lot of value already. They track absolutely everything, which gives me great insight into my application."

— Aaron F, Product Manager, Resolute Property Tax Solutions

We've Got Your Stack Covered!

Boost Framework Performance

Boost Framework Performance

Gain insights into your performance, enhancing transaction flow and speeding up error resolution.

Trace Every Request Instantly

Trace Every Request Instantly

Visualize end-to-end traces across your stack, ensuring that you catch every error, performance issue, or bottleneck before it affects users.

Identify Slow Queries Instantly

Identify Slow Queries Instantly

Pinpoint and resolve slow database queries and eliminate performance bottlenecks impacting your application's responsiveness, leading to faster response times

Stay Alert to Vulnerabilities

Stay Alert to Vulnerabilities

Get alerted to potential library vulnerabilities, preventing security risks before they affect your customers or compliance.

Simplify Logs, Troubleshoot Faster

Simplify Logs, Troubleshoot Faster

Centralize all your logs in one place, and quickly identify the root cause of issues using advanced filtering, pattern detection, and log pipelines.

Custom Metrics That Matter

Custom Metrics That Matter

Set up and track custom metrics that align with your app's KPIs to ensure you're monitoring exactly what matters most for your success.

Quick Request Analysis Anytime

Quick Request Analysis Anytime

Explore request-level analysis, including stdout APM logs, to understand execution times, bottlenecks, and areas that need optimization.

Align APM with Server Metrics

Align APM with Server Metrics

Correlate your app’s APM metrics with server health to get a complete picture of your application’s performance and infrastructure dependencies.

Actionable Alerts

Actionable Alerts

Receive real-time alerts for app performance degradations and critical issues. Take immediate action to prevent downtime and optimize user experiences.

FAQs about Application Performance Monitoring

What is APM?

APM, short for Application Performance Monitoring, is a critical process and technology used to ensure that software applications perform reliably and efficiently. APM tools provide insights into key performance metrics such as response times, transaction speeds, error rates, and resource usage. These insights allow teams to diagnose and fix issues before they impact users.

APM solutions are essential for modern businesses that depend on reliable, high-performing applications to succeed in competitive markets.

What metrics should be monitored in APM?

Key performance metrics to monitor with Atatus APM include:

  1. Response time: The time taken to process a request and deliver a response.
  2. Error rate: The percentage of failed requests or application errors.
  3. Resource usage: CPU, memory, and other system resources consumed by the application.
  4. Throughput: The volume of transactions or requests handled over a specific period.
  5. Latency: The duration for data to travel between client and server.
  6. User experience: Feedback and satisfaction levels from end users.
  7. Business metrics: The application's impact on metrics like revenue, transactions, or conversion rates.

These metrics provide actionable insights to address performance challenges and improve the application's efficiency.

How does Atatus compare with SolarWinds APM, New Relic APM, and Datadog APM?

Atatus competes directly with popular solutions like SolarWinds APM, New Relic APM, and Datadog APM by offering:

  1. Ease of use: A simplified UI and quick setup process.
  2. Real-time observability: Full-stack monitoring with actionable insights.
  3. Cost efficiency: Transparent pricing compared to premium alternatives.

While each APM tool has its strengths, Atatus excels at being an affordable, feature-rich application performance monitoring tool for both startups and enterprises.

How can performance be improved in production environments?

To improve application performance:

  1. Optimize database queries and caching strategies.
  2. Use load balancers to distribute traffic evenly.
  3. Monitor resource usage and scale infrastructure when needed.
  4. Identify and fix code-level inefficiencies through profiling.
Why are APM tools crucial for cloud-based businesses?

Cloud-based businesses face unique challenges like resource scaling, high traffic, and distributed architecture. APM tools address these challenges by:

  1. Providing actionable insights into app performance monitoring.
  2. Detecting and fixing bottlenecks with cloud application monitoring tools.
  3. Ensuring seamless integration with DevOps workflows for optimized application performance.

APM tools are indispensable for monitoring cloud-based distributed systems. With features such as:

  1. Distributed tracing: Track how requests flow across microservices.
  2. Dependency analysis: Monitor app interactions with external APIs and databases.
  3. Error diagnostics: Use application performance tools to identify and resolve code or infrastructure issues.
What are the main benefits of using APM tools?

There are several benefits to using APM software:

  1. Improved user experience: Ensure seamless application performance with app monitoring software.
  2. Proactive issue detection: Identify and fix performance bottlenecks early.
  3. Reduced downtime: Proactive alerts minimize outages.
  4. Resource optimization: Cloud application monitoring tools identify under- or over-utilized resources.

You're in good company.

You don't have to trust our word. Hear what our customers say!

Atatus is a great product with great support. Super easy to integrate, it automatically hooks into everything. The support team and dev team were also very helpful in fixing a bug and updating the docs.
Tobias
Tobias L
Full Stack Engineer, ClearVoyage
Atatus is powerful, flexible, scalable, and has assisted countless times to identify issues in record time. With user identification, insight into XHR requests to name a few it is the monitoring tool we choose for our SPAs.
Jan Paul
Jan-Paul B
Chief Executive Officer, iSavta
Atatus continues to deliver useful features based on customer feedback. Atatus support team has been responsive and gave visibility into their timeline of requested features.
Daniel
Daniel G
Software Engineer, MYND Management

Trusted Protection through Global Compliance

Feel assured as we maintain rigorous security protocols, ensuring the safety of your data with every interaction

SOC 2 Type 2 Compliant
ISO 27001 Certified
ISO 27001 Certified
GDPR & CCPA Compliant

Ready to see actionable data?

Avail Atatus features for 14 days free-trial. No credit card required. Instant set-up.