Database Monitoring
Database monitoring provides an in-depth overview of your database performance by surfacing slow database queries occurring within your requests along with transaction traces to provide actionable insights.

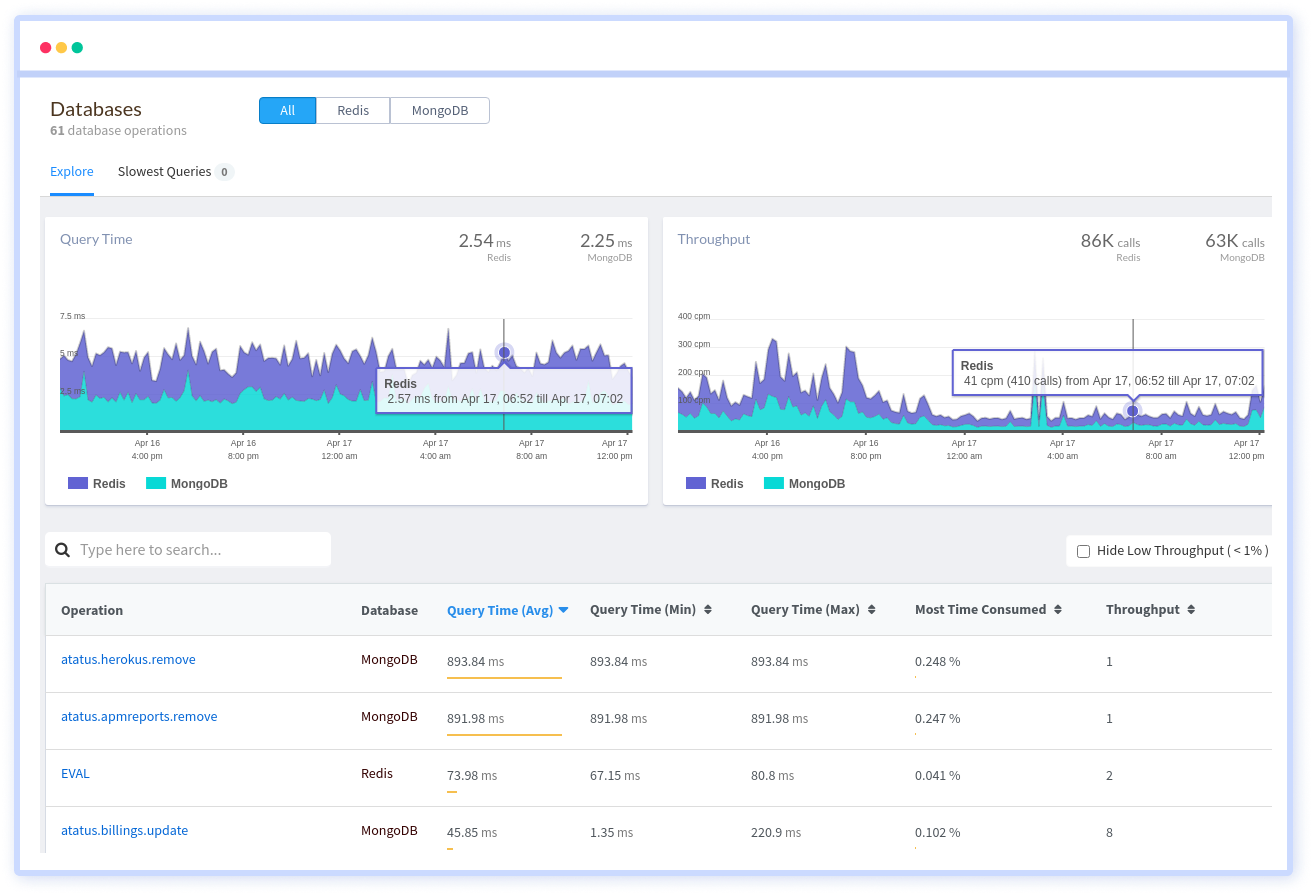
See how much time your app spends in database calls
Get a comprehensive overview of each database operation and how it impacts your transaction performance. Within each database table and operation, get aggregated metrics for response times, throughput and slow SQL queries with the original traces.

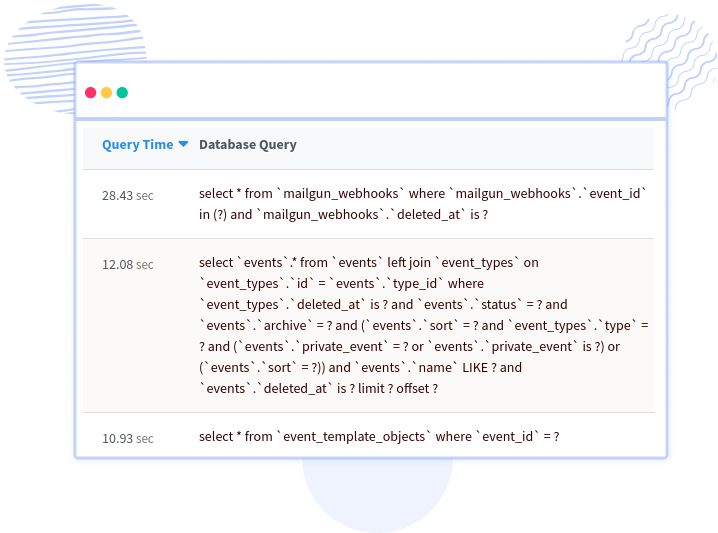
Pinpoint SQL queries that are slowing down your application
View the list of all slow SQL calls with normalized queries to understand which tables and operations have the most impact, know exactly which function called, when it was called and measure in a long term if your changes improve performance.

See which DB calls affect a particular transaction
Drill down into an individual database operation to understand which end points call a particular table and operation, along with specific details of the total time consumed, response time, throughput, slowest SQL queries of that operation.


 +1-760-465-2330


