Service Map
Visualize your application's architecture and service dependencies. Understand relationships and interactions between various services, identify potential bottlenecks, and optimize performance.
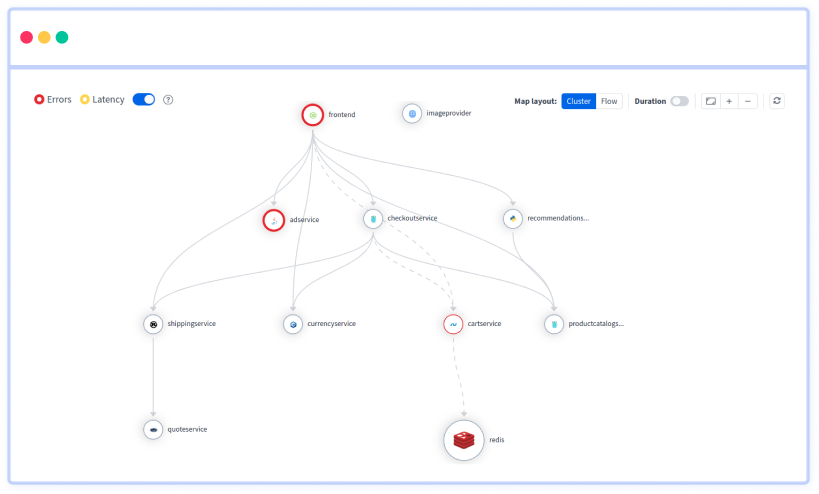
Interactive Overview of Service Dependencies
- The service map displays a comprehensive layout of all the services in your application and their interactions, giving you a clear picture of the architecture.
- Identify incoming and outgoing dependencies for each service easily, helping you understand how data flows through your application.
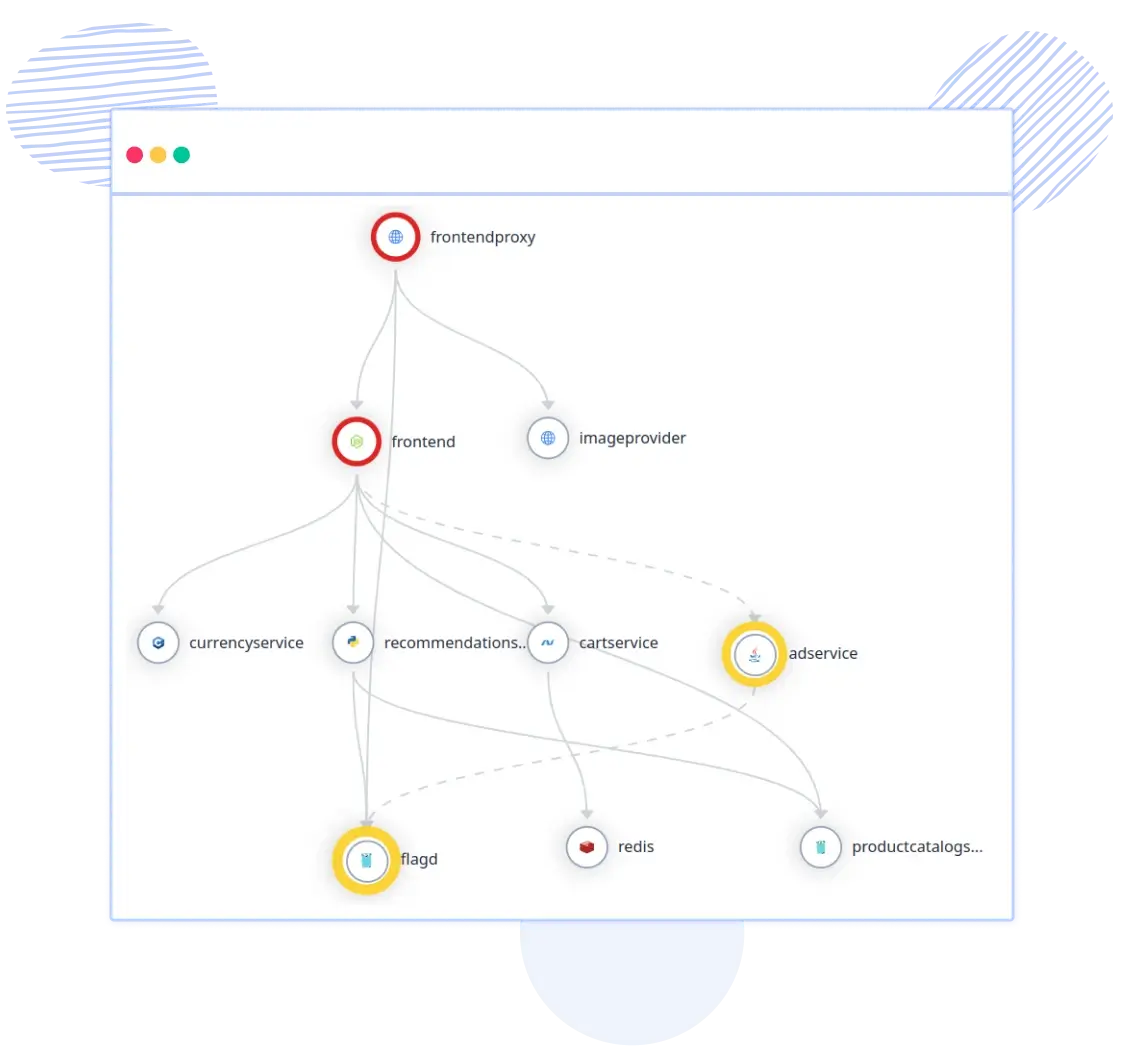
- Spot services with high error rates quickly, marked in red, enabling you to prioritize troubleshooting efforts.
- Identify services with high latency, marked in yellow, allowing you to focus on performance improvements.
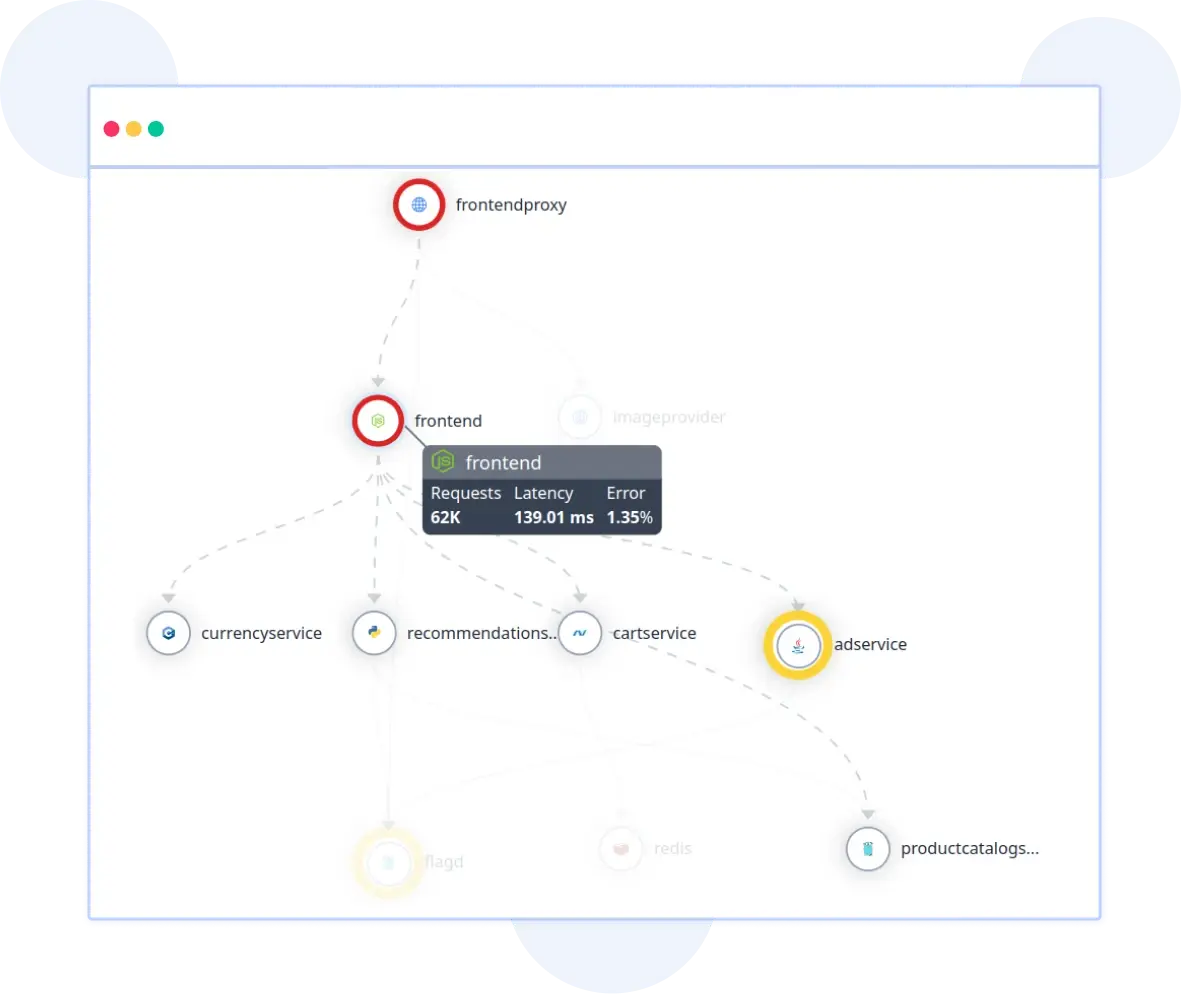
In-Depth Service Metrics
- Mouse over any service to see the number of requests it handles, providing insights into the load and performance of each service.
- Understand the response times for each service, helping you pinpoint areas where performance can be optimized.
- View the error rates for each service, enabling you to quickly identify and address issues affecting your application's reliability.
- Track these metrics over time to identify trends and potential long-term issues that need addressing.
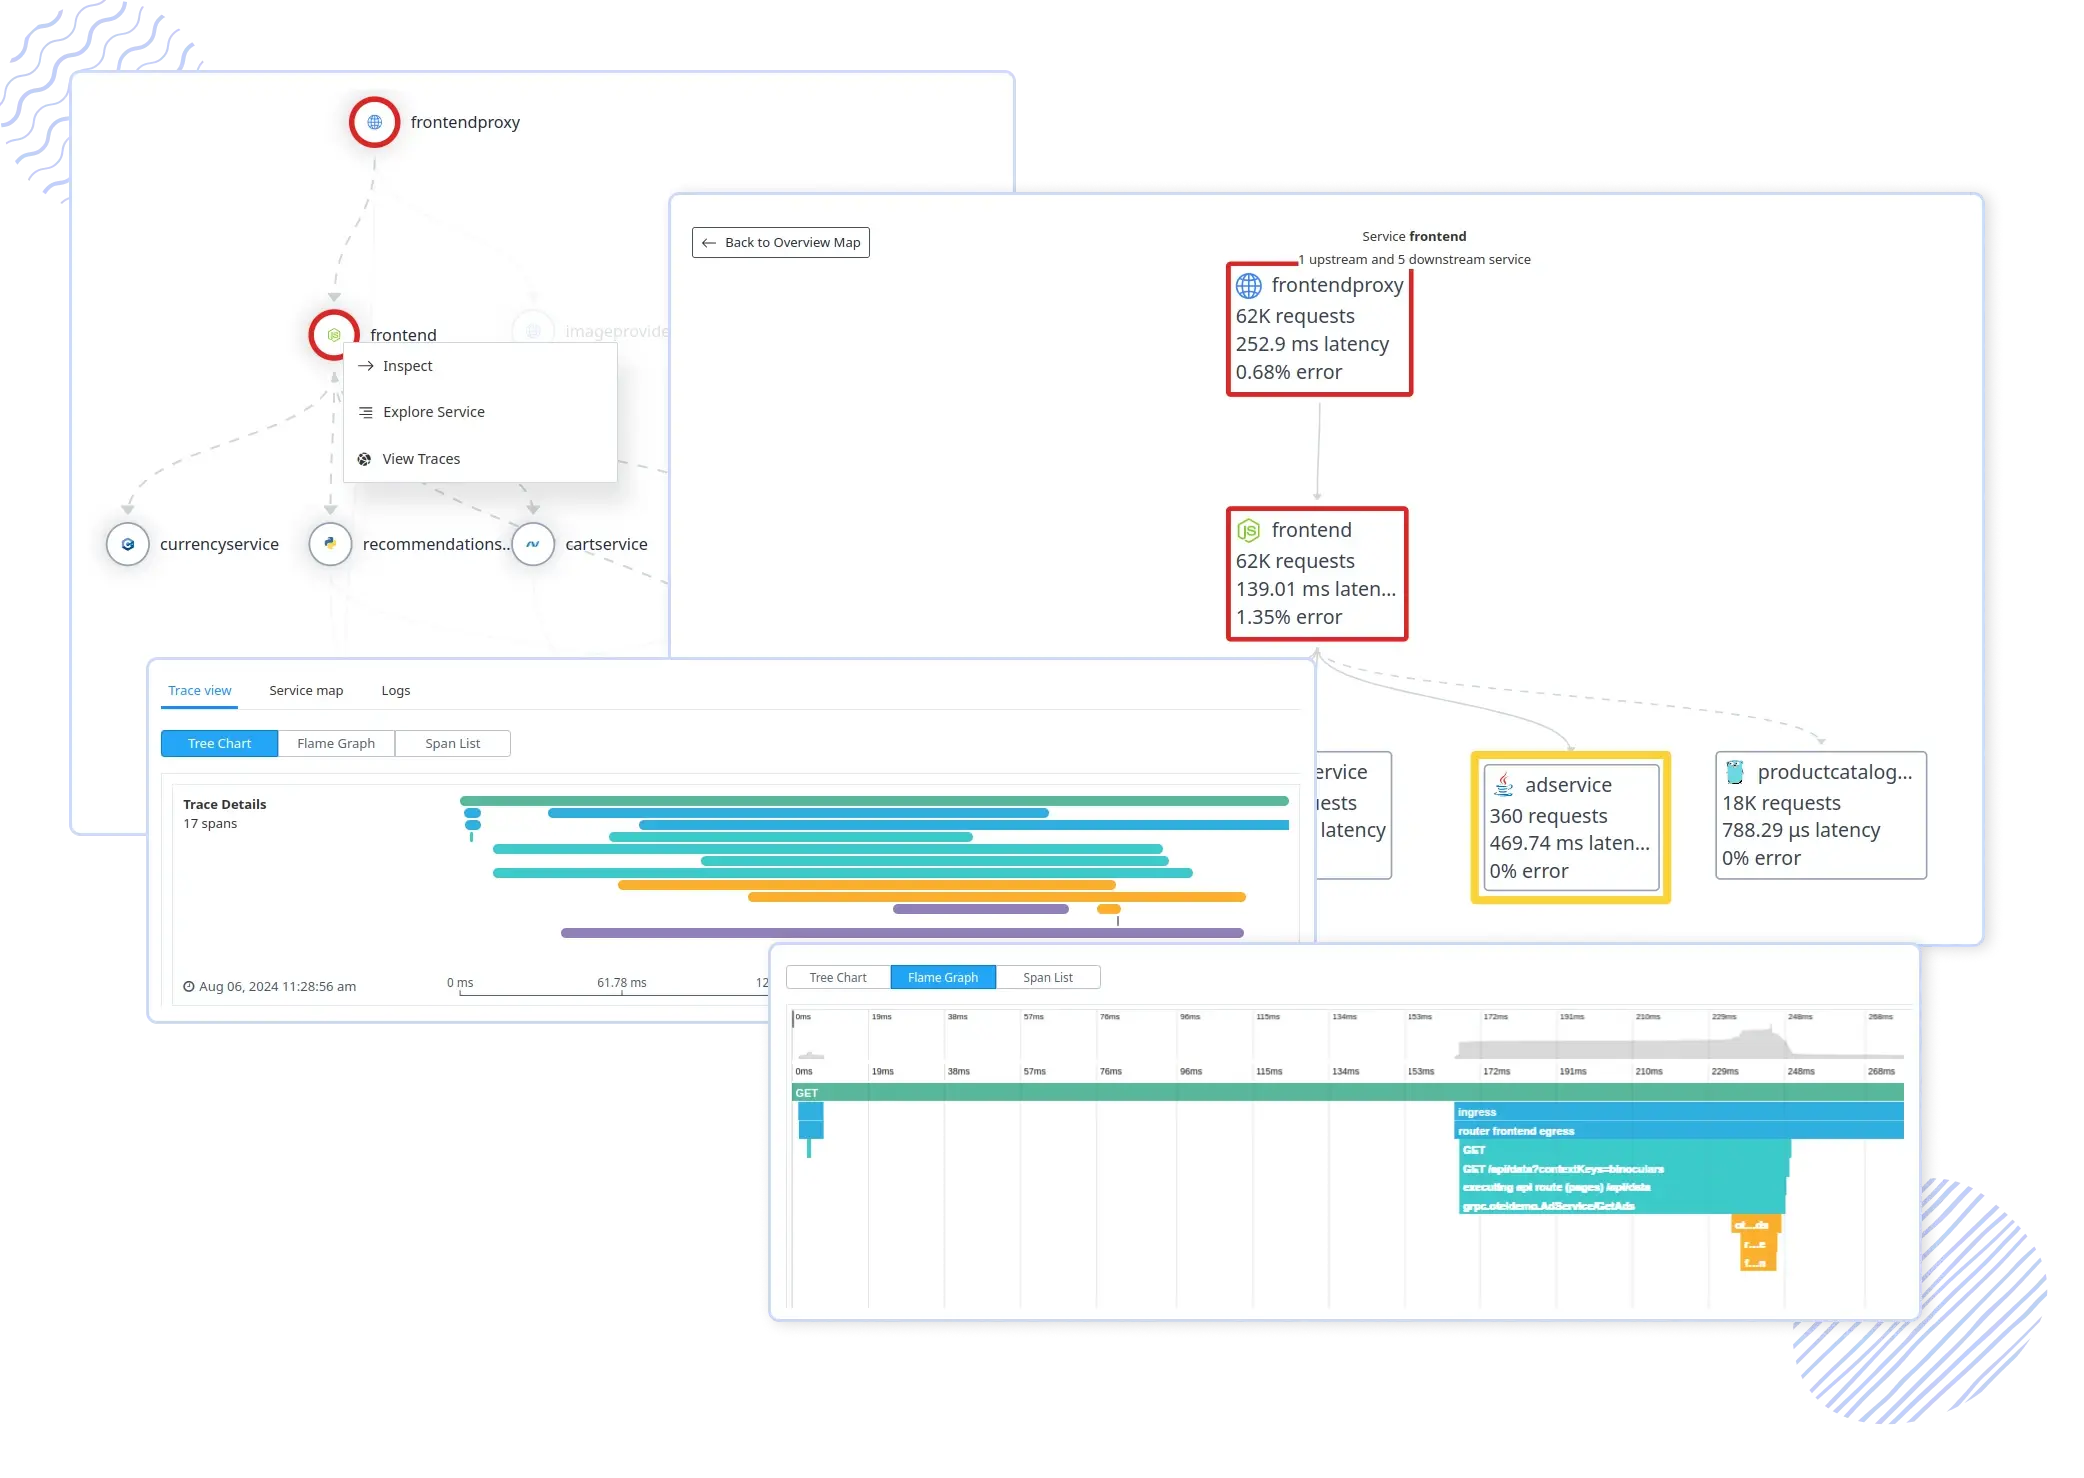
Detailed Service Inspection
- Click on any service to access detailed inspection features, including specific metrics and performance data.
- Dive deeper into the service details, examining logs, traces, and other relevant data to understand performance issues and their root causes.
- Analyze traces to get a complete view of the request path through your services, identifying where delays or errors occur.
- Use time charts to see performance over time and flame graphs to visualize resource usage and identify hotspots.


 +1-760-465-2330


