Microservices Monitoring

Achieve detailed visibility into your microservices architecture with Atatus. Monitor dependencies, analyze performance metrics, and streamline troubleshooting with real-time tracing and service-level diagnostics.
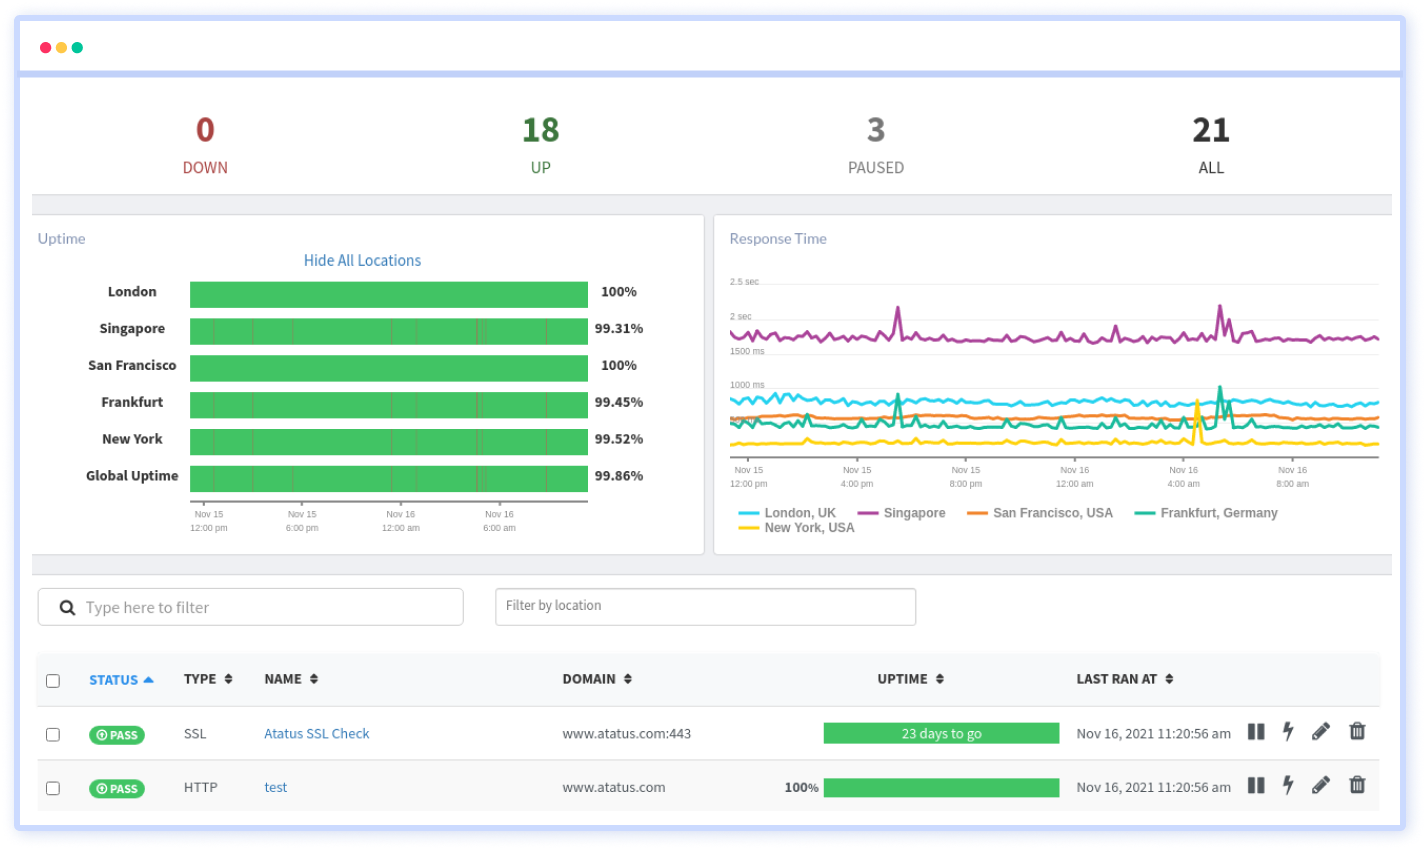
Microservices Monitoring

Unravel the Complexity of Microservices Architecture

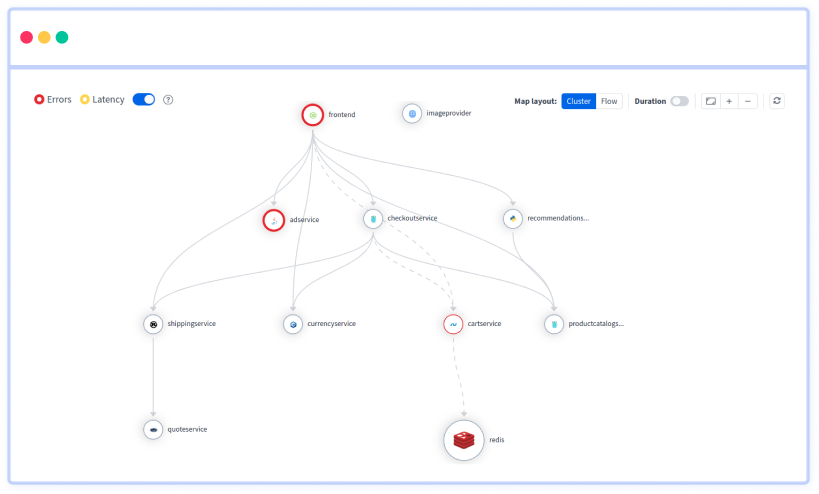
  • Map microservices dependencies, communication flows, and bottlenecks for enhanced visibility.
  • Track every transaction and request flowing through your microservices for precise debugging.
  • Gain automated updates of your service relationships as your architecture evolves.
  • Monitor microservices performance from development to deployment without interruptions.
Unravel the Complexity of Microservices Architecture

Proactive Issue Detection for Microservices Health

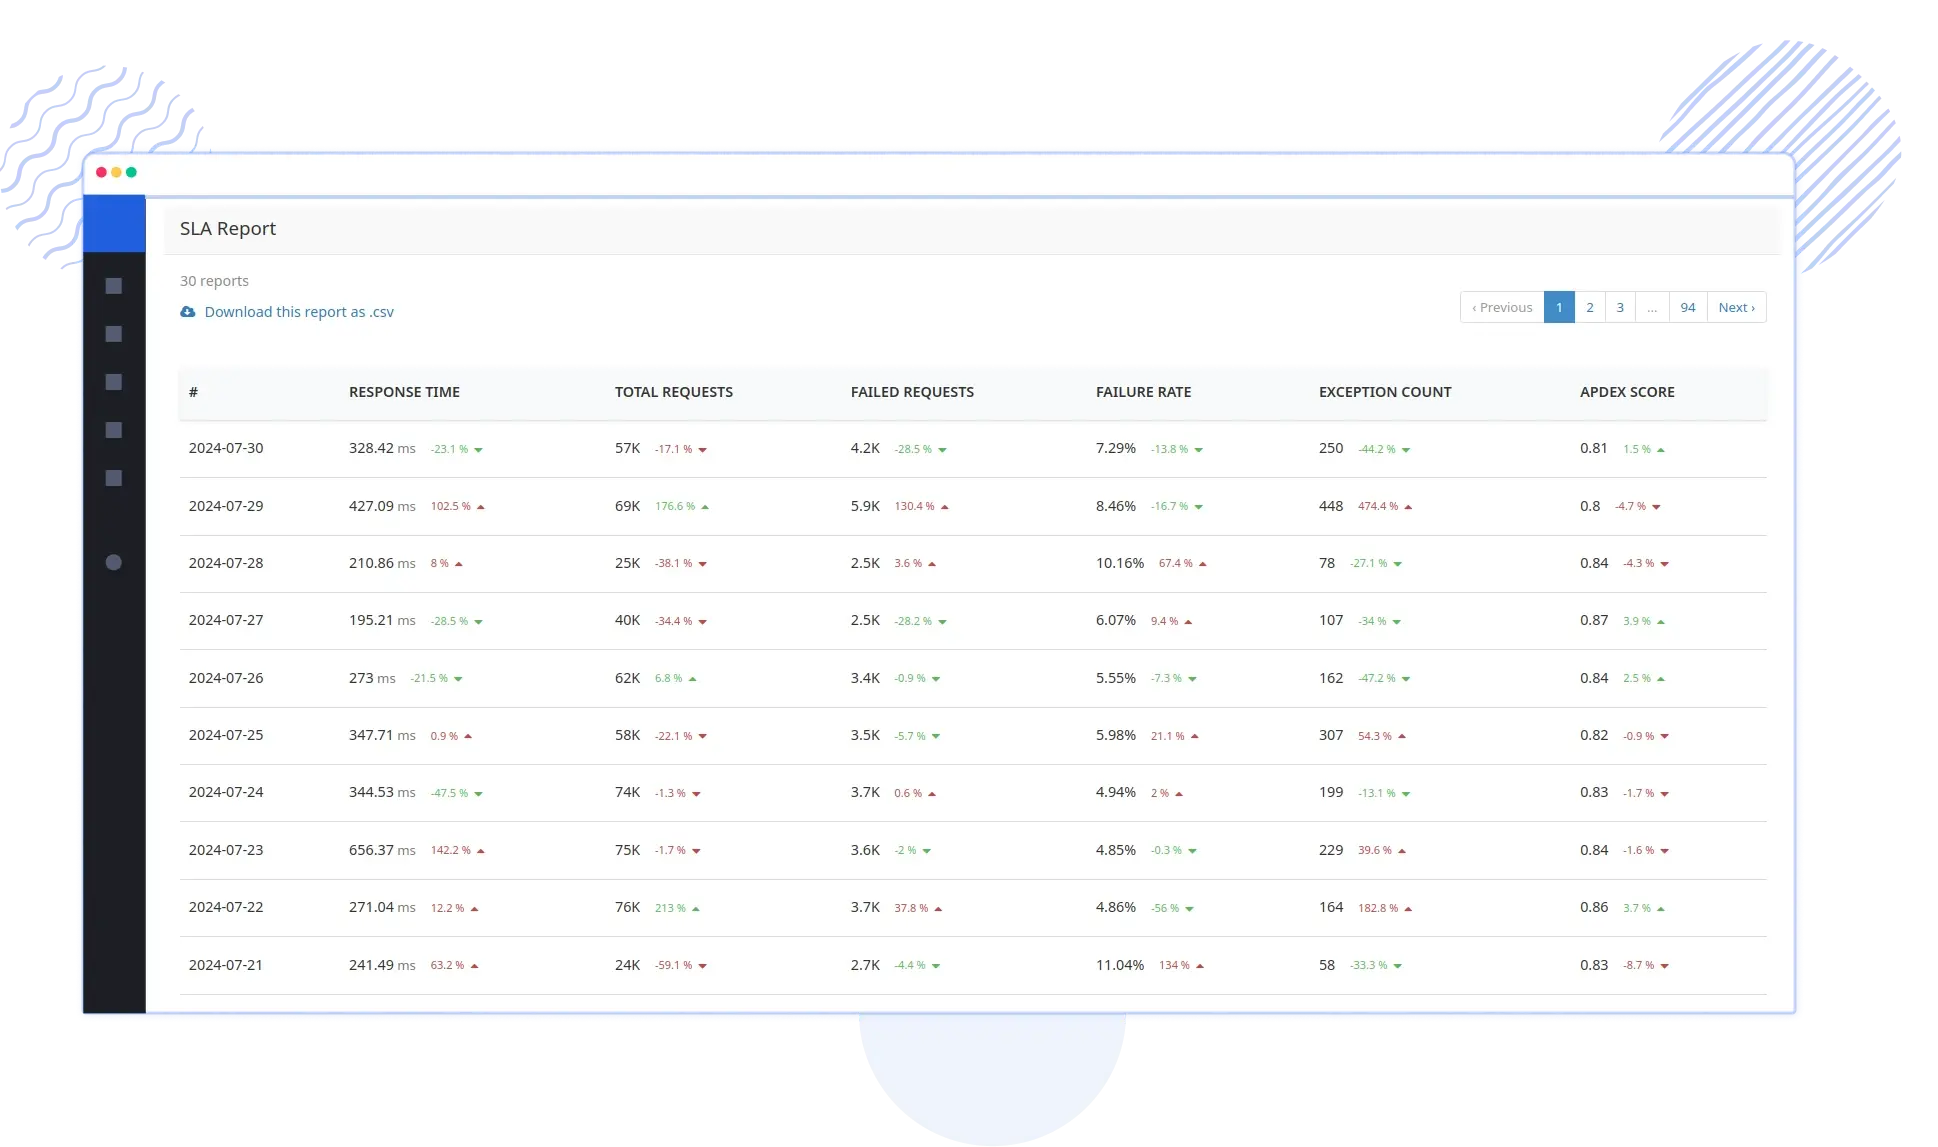
  • Monitor CPU, memory, throughput, and response times for each microservice.
  • Receive instant notifications for SLA breaches or performance degradation.
  • Identify the origin of issues quickly with detailed tracing and dependency analysis.
  • Monitor exceptions, timeouts, and crashes in your microservices ecosystem.
Proactive Issue Detection for Microservices Health

Optimize Microservices Scalability and Efficiency

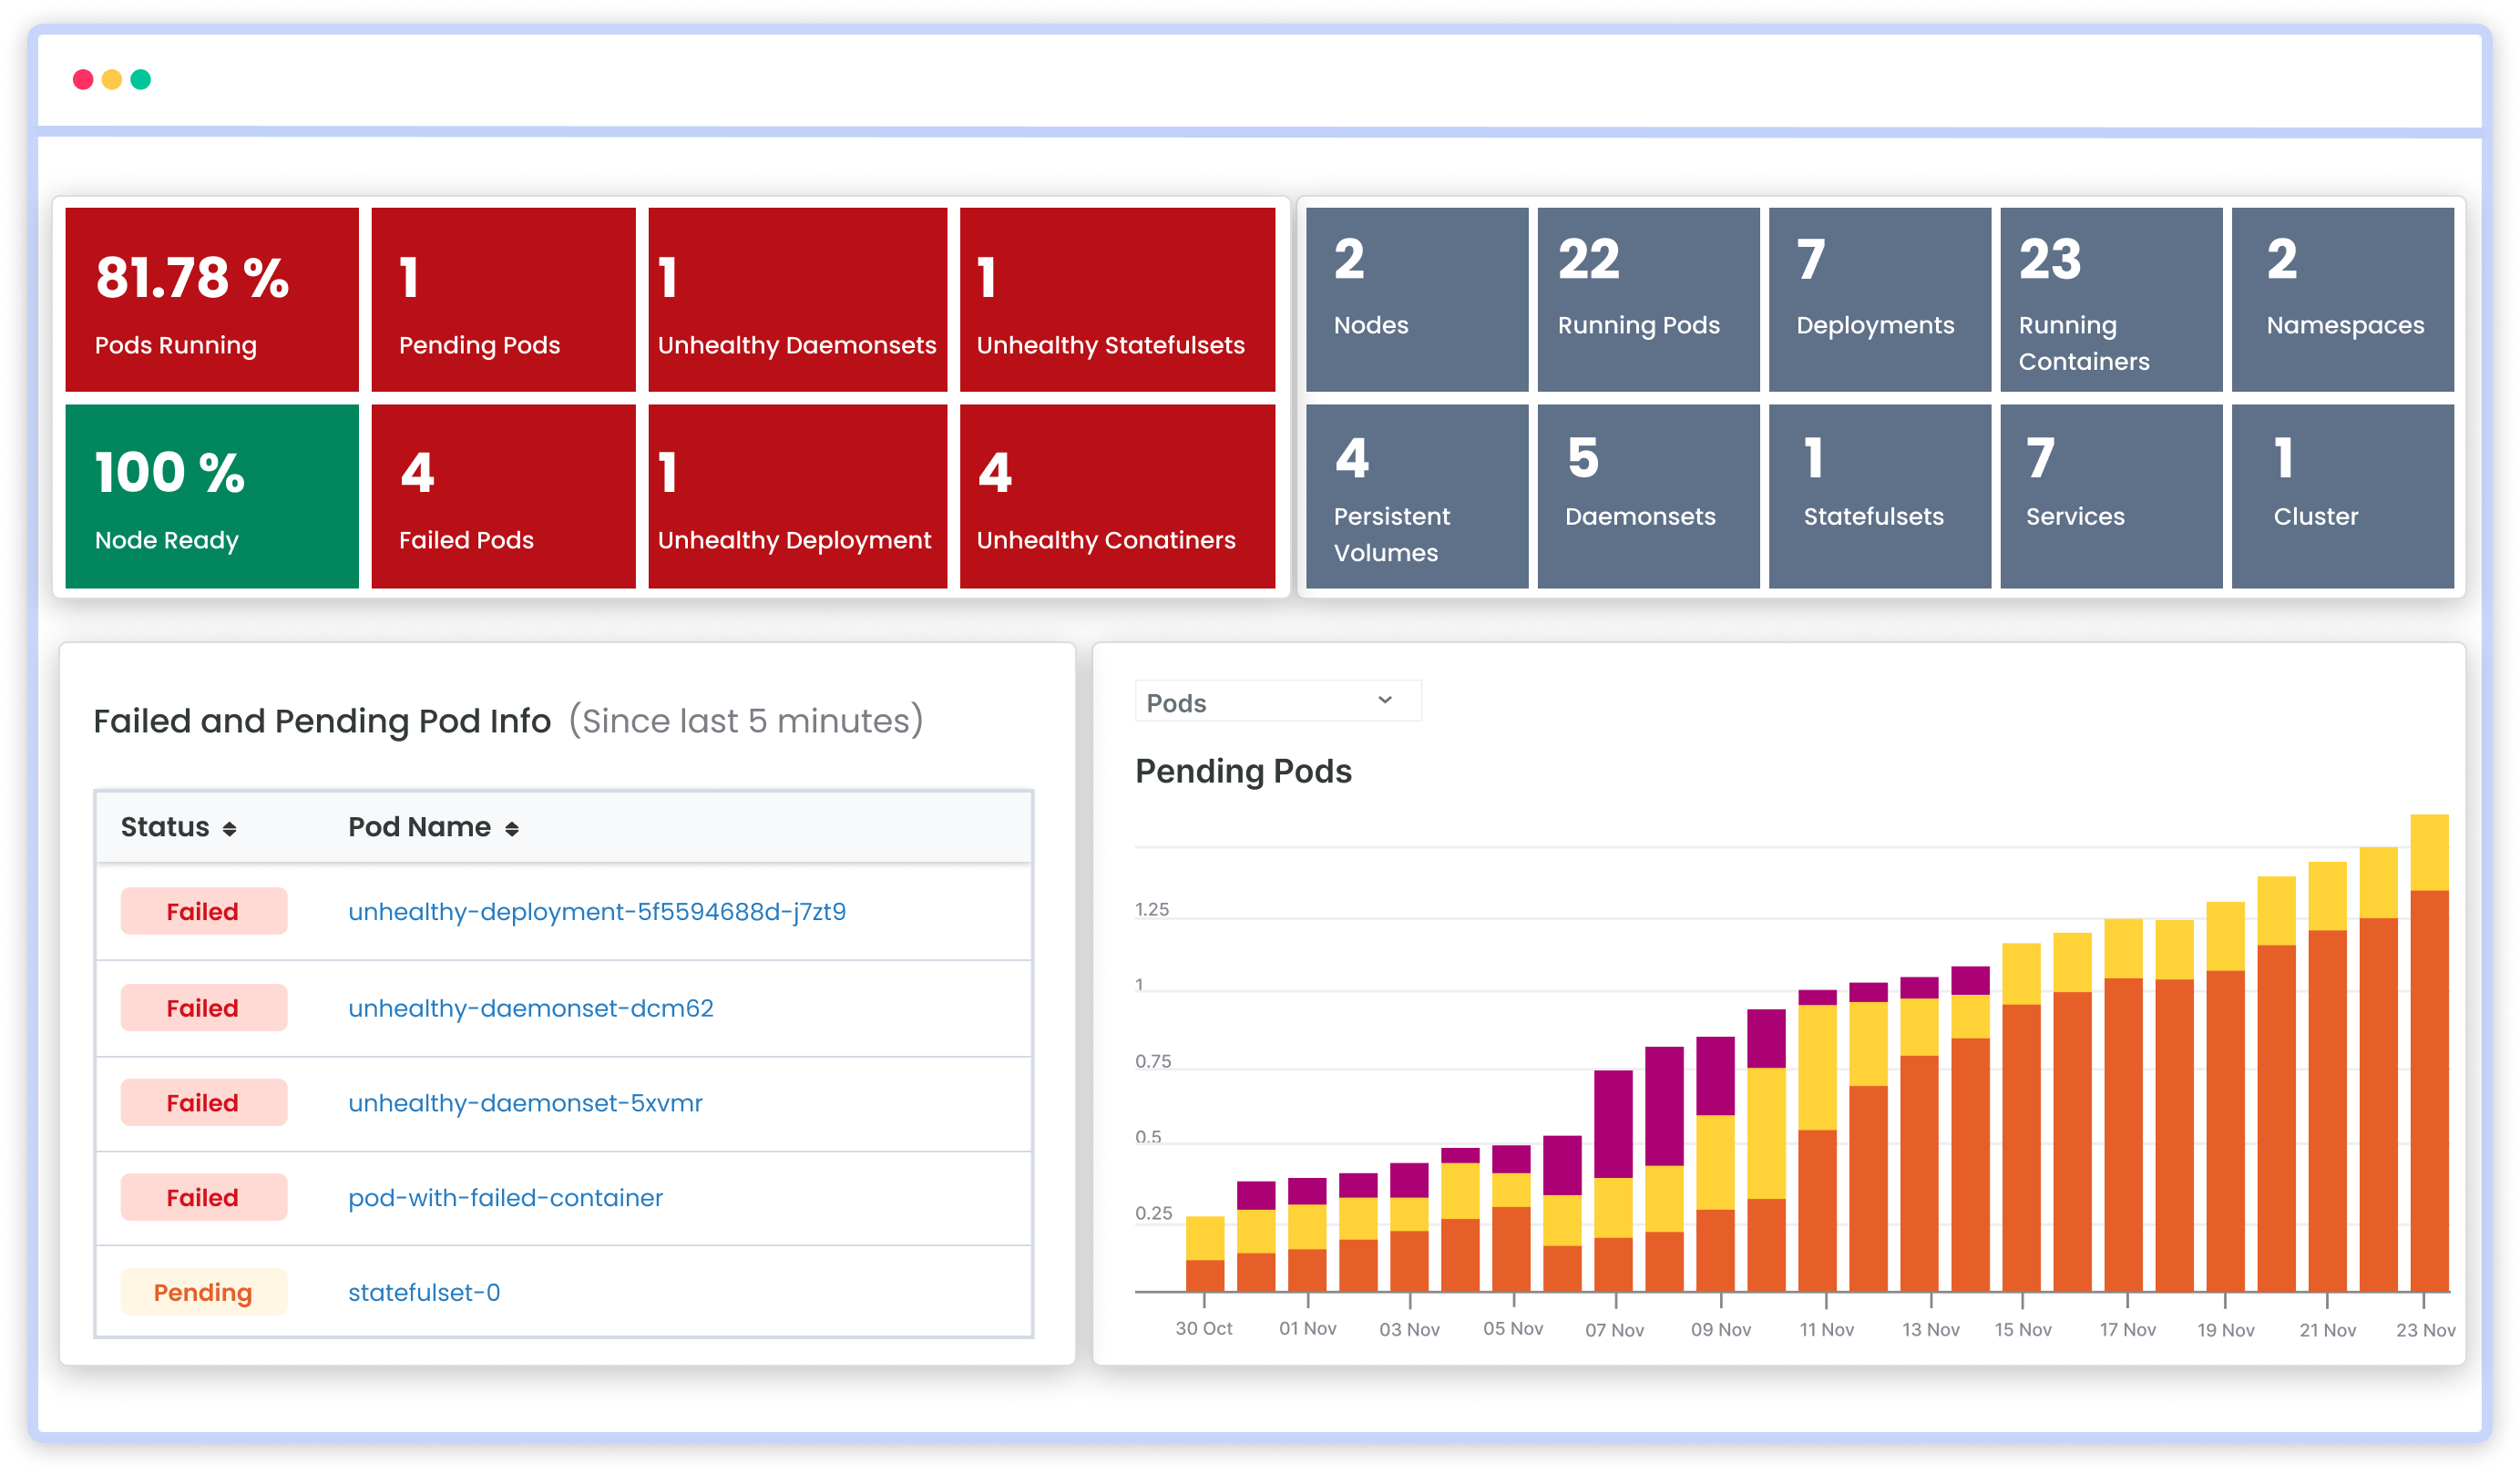
  • Monitor resource utilization to enable optimal scaling strategies for Kubernetes and containers.
  • Detect anomalies and balance traffic effectively to maintain high performance.
  • Simulate real-world scenarios to validate microservice performance at scale.
  • Monitor microservices across Docker, Kubernetes, and cloud-native platforms.
Optimize Microservices Scalability and Efficiency

FAQs for Microservices Monitoring

Can Atatus track performance metrics for individual microservices?

Yes, Atatus collects granular performance metrics, such as response times, throughput, and error rates, for each microservice. These metrics help you analyze service performance and make informed decisions to optimize scalability and efficiency.

How does distributed tracing help in microservice monitoring?

Distributed tracing in Atatus allows you to follow the lifecycle of a request across multiple microservices. This helps in pinpointing the root cause of performance issues, debugging failed transactions, and optimizing service workflows.

Is Atatus compatible with containerized microservices?

Yes, Atatus seamlessly integrates with containerized environments like Docker and Kubernetes, enabling you to monitor microservices across cloud-native architectures and container orchestration platforms.

Can Atatus send alerts for microservice performance issues?

Absolutely! Atatus offers configurable alerts based on predefined thresholds like response time, error rates, or resource utilization, ensuring you stay proactive about service-level health.

How scalable is Atatus for monitoring large microservices architectures?

Atatus is designed to handle large-scale distributed systems. It dynamically adapts to architectural changes, ensuring reliable monitoring and performance insights, even as your microservices ecosystem grows.

You're in good company.

You don't have to trust our word. Hear what our customers say!

Atatus is a great product with great support. Super easy to integrate, it automatically hooks into everything. The support team and dev team were also very helpful in fixing a bug and updating the docs.
Tobias
Tobias L
Full Stack Engineer, ClearVoyage
Atatus is powerful, flexible, scalable, and has assisted countless times to identify issues in record time. With user identification, insight into XHR requests to name a few it is the monitoring tool we choose for our SPAs.
Jan Paul
Jan-Paul B
Chief Executive Officer, iSavta
Atatus continues to deliver useful features based on customer feedback. Atatus support team has been responsive and gave visibility into their timeline of requested features.
Daniel
Daniel G
Software Engineer, MYND Management

Ready to see actionable data?

Avail Atatus features for 14 days free-trial. No credit card required. Instant set-up.