Kafka Logs & Metrics Monitoring

Monitor the key metrics from your Kafka brokers, producers, consumers, and ZooKeeper Ensemble actively to maintain optimal performance and ensure smooth operation of your Kafka cluster.

Kafka Logs & Metrics Monitoring
Kafka Broker MetricsKafka Broker

Unified Kafka Broker Metric Dashboard

Effortlessly monitor critical performance indicators across all brokers in real time through a unified dashboard. Track metrics such as throughput, latency, and storage utilization seamlessly in one place. Simplify your monitoring workflow with a consolidated dashboard that offers a holistic view of the performance of your Kafka infrastructure.

Kafka Broker Metrics
Kafka Consumer Lag and LatencyConsumer Lag

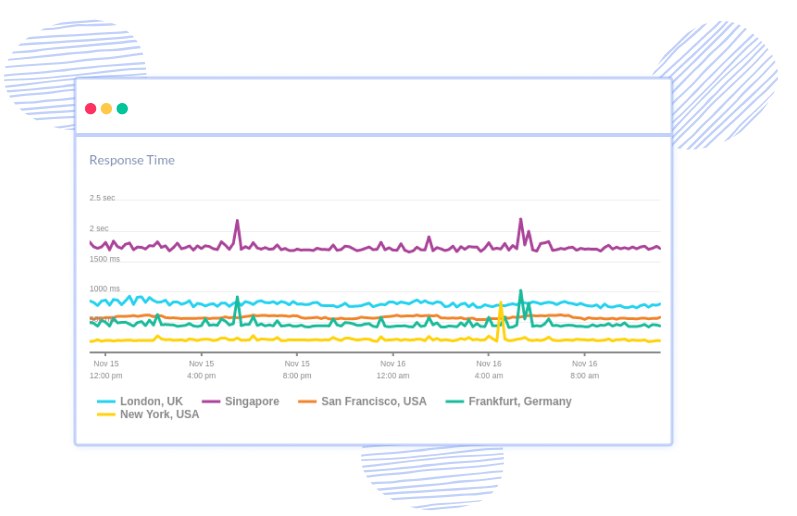
Monitor Kafka Consumer Lag and Latency

Ensure seamless data flow and maintain optimal performance levels with precise insights into message processing delays and system responsiveness. Stay ahead of challenges, optimize resource utilization, and uphold the reliability of your Kafka clusters.

Kafka Consumer Lag and Latency
InstallationKafka Logs

Real-time Kafka Log Events

With instant visibility into log data, you can quickly identify anomalies, troubleshoot errors, and ensure the smooth operation of your data pipelines, ultimately enhancing efficiency and reliability across your entire system and enabling timely intervention to prevent downtime.

Kafka Log Events
Kafka DowntimeKafka Downtime

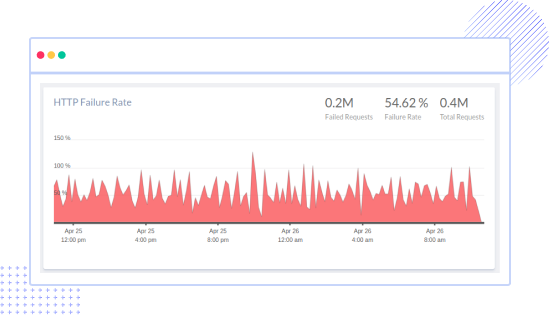
Anticipate Malfunctions and Prevent Downtime

Gain real-time insights into Kafka's operational health to detect misconfigurations, logical errors, or scalability issues proactively. Identify overly restrictive timeout parameters or mishandled request rate quotas, ensuring uninterrupted operations and minimizing the risk of service disruptions.

Kafka Downtime

Logs Aggregate and Analysis made easy!

Live performance data

Real-time alerting

Immediate notification of high-priority incidents through advanced configurations based on error logs or custom queries.

Resolve issues quickly

Filter Context

Enhance debugging by adding/deleting related streams like host, service, source, severity for focused analysis.

Compare releases

Seek by Time

Pinpoint events in distributed logs for detailed issue resolution—critical for understanding specific occurrences across systems.

Smart notifications

Saved Views

Save, re-run searches, and manage views easily within the event viewer—modify filters swiftly for efficient log event analysis.

Built for developers

Built for developers

Designed to help developers and managers determine when and where their attention is required and enable teams to make fast.

Full text search

Email digests

Don't miss out on your events and error stats. Atatus can send you weekly and monthly summaries directly to your inbox.

FAQs on Kafka Logs & Metrics Monitoring

What are Kafka logs, and why are they important?

Kafka logs are the recorded events of data transactions within a Kafka cluster. They serve as a crucial record of all activity, enabling users to track data flow, troubleshoot errors, and ensure data integrity.

What metrics should I monitor in Kafka?

Key metrics to monitor in Kafka include message throughput, latency, consumer lag, broker health, disk utilization, and network throughput. Monitoring these metrics helps ensure optimal performance and timely data processing.

How does Atatus monitor Kafka logs and metrics?

Atatus provides comprehensive monitoring for Kafka through its agent-based approach. The Atatus Kafka integration collects metrics from Kafka brokers, producers, consumers, and ZooKeeper ensemble, offering real-time insights into the performance and health of your Kafka clusters.

What is Kafka lag, and how does it impact performance?

Kafka lag refers to the delay between the production and consumption of messages within Kafka. High consumer lag can indicate processing bottlenecks or slow consumer performance, leading to data backlog and degraded system performance.

How can I optimize Kafka performance based on metrics?

By closely monitoring Kafka metrics such as throughput, latency, and consumer lag, you can identify areas for optimization. Adjusting configurations, scaling resources, and optimizing consumer groups based on metric insights can help improve overall Kafka performance.

What role does ZooKeeper play in Kafka monitoring?

ZooKeeper serves as a centralized repository for maintaining Kafka cluster metadata and configuration settings. Monitoring ZooKeeper metrics, such as connection counts and request latency, is essential for ensuring the stability and reliability of Kafka clusters.

How often should I review Kafka logs and metrics?

Regular monitoring of Kafka logs and metrics is recommended, with frequency varying based on the size and complexity of the Kafka deployment. Daily reviews are typically sufficient for most environments, with additional checks during peak usage periods or after system updates.

Can I set up alerts for Kafka metrics in Atatus?

Yes, Atatus allows for flexible alerting configurations based on Kafka metrics thresholds. Users can define custom alert policies to trigger notifications via email, Slack, or other channels when specific Kafka metrics exceed predefined thresholds, enabling proactive issue resolution and performance optimization.

Is it possible to monitor Kafka logs securely with Atatus?

Atatus employs robust security measures to protect Kafka log data within its platform, including data encryption in transit and at rest, role-based access controls (RBAC), and compliance with industry security standards such as SOC 2 and GDPR. Additionally, Atatus provides audit logs and monitoring features to track and monitor access to Kafka log data, ensuring data integrity and confidentiality.

What happens if my log ingestion rate exceeds the limits of my Atatus subscription?

If you exceed your log ingestion limits, we would contact you to discuss on stopping further processing new log data or upgrade your subscription.

What log storage options does Atatus offer?

You can choose to store logs in Atatus for a limited time (e.g., 7 days) or export them to external storage solutions like Amazon S3 for long-term retention.

What happens if I need to search for historical log data that exceeds the retention period?

To access historical log data beyond the retention period, you can rely on log data exports from Amazon S3, where you can push the logs into Atatus for further analysis.

Can I customize log retention settings in Atatus?

Yes, Atatus provides users with the flexibility to customize log retention settings. Users can adjust retention periods based on their specific needs, aligning with compliance standards or internal data management policies.

You're in good company.

You don't have to trust our word. Hear what our customers say!

Atatus is a great product with great support. Super easy to integrate, it automatically hooks into everything. The support team and dev team were also very helpful in fixing a bug and updating the docs.
Tobias
Tobias L
Full Stack Engineer, ClearVoyage
Atatus is powerful, flexible, scalable, and has assisted countless times to identify issues in record time. With user identification, insight into XHR requests to name a few it is the monitoring tool we choose for our SPAs.
Jan Paul
Jan-Paul B
Chief Executive Officer, iSavta
Atatus continues to deliver useful features based on customer feedback. Atatus support team has been responsive and gave visibility into their timeline of requested features.
Daniel
Daniel G
Software Engineer, MYND Management

Ready to see actionable data?

Avail Atatus features for 14 days free-trial. No credit card required. Instant set-up.