Java OpenTelemetry Integration

Unlock observability for your Java applications with Atatus OpenTelemetry integration. Gain deep insights, optimize performance, and troubleshoot faster with seamless instrumentation tailored for the Java ecosystem.
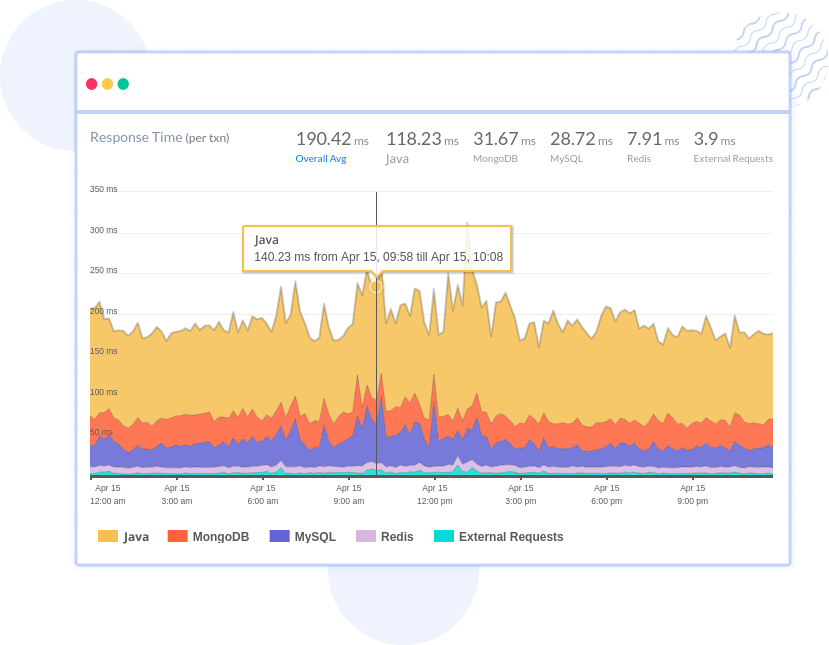
Start your 14-day free trial. No credit card required.
Java OpenTelemetry Integration

Comprehensive Observability with OpenTelemetry for Java

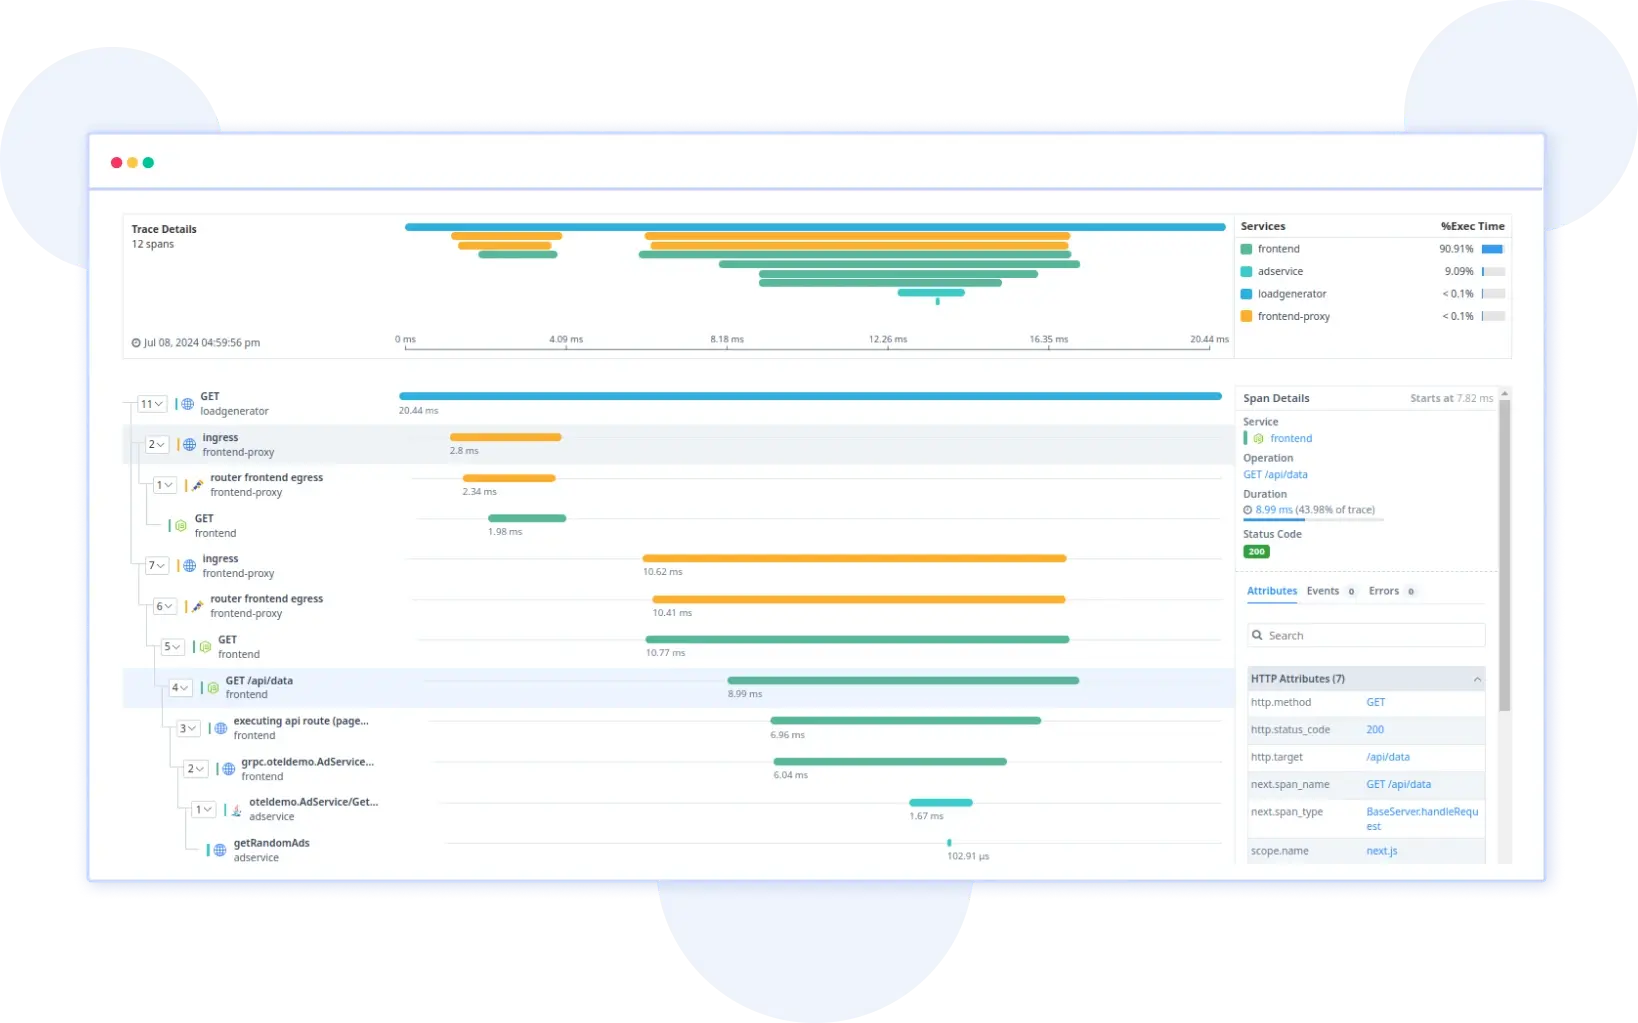
  • Track requests across distributed systems and identify latency issues in service interactions.
  • Use OTLP and W3C Trace Context for seamless interoperability and standards compliance.
  • Collect JVM-specific metrics such as garbage collection, thread utilization, and heap memory usage.
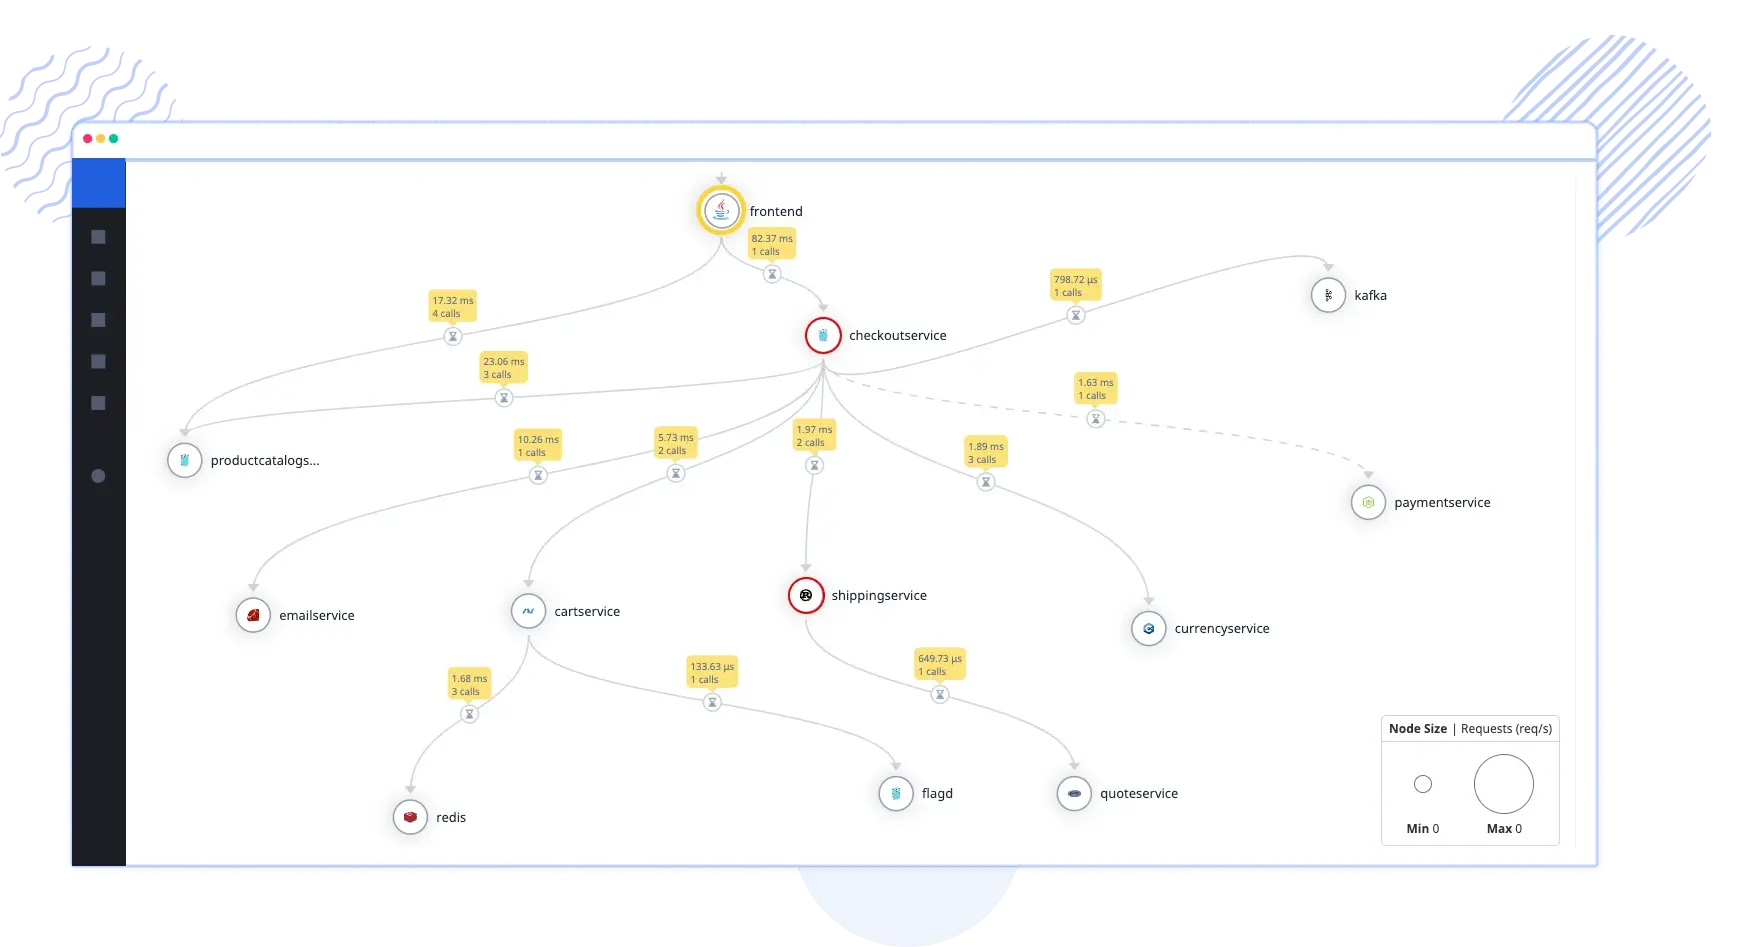
  • Visualize relationships between Java-based services, APIs, and third-party dependencies.
Comprehensive Observability with OpenTelemetry for Java

Streamlined Java Application Performance Monitoring

  • Pinpoint thread contention, deadlocks, and bottlenecks in multithreaded Java applications.
  • Trace SQL queries for databases accessed via Hibernate, JPA, or JDBC.
  • Monitor memory pools, CPU usage, and other key JVM resources.
  • Trace asynchronous operations such as CompletableFutures and parallel streams.
Streamlined Java Application Performance Monitoring

Simplified Troubleshooting and Root Cause Analysis

  • Capture Java stack traces, error codes, and detailed exception messages.
  • Dive into individual spans to measure execution times of critical Java methods.
  • Extend observability by adding custom spans to monitor domain-specific logic.
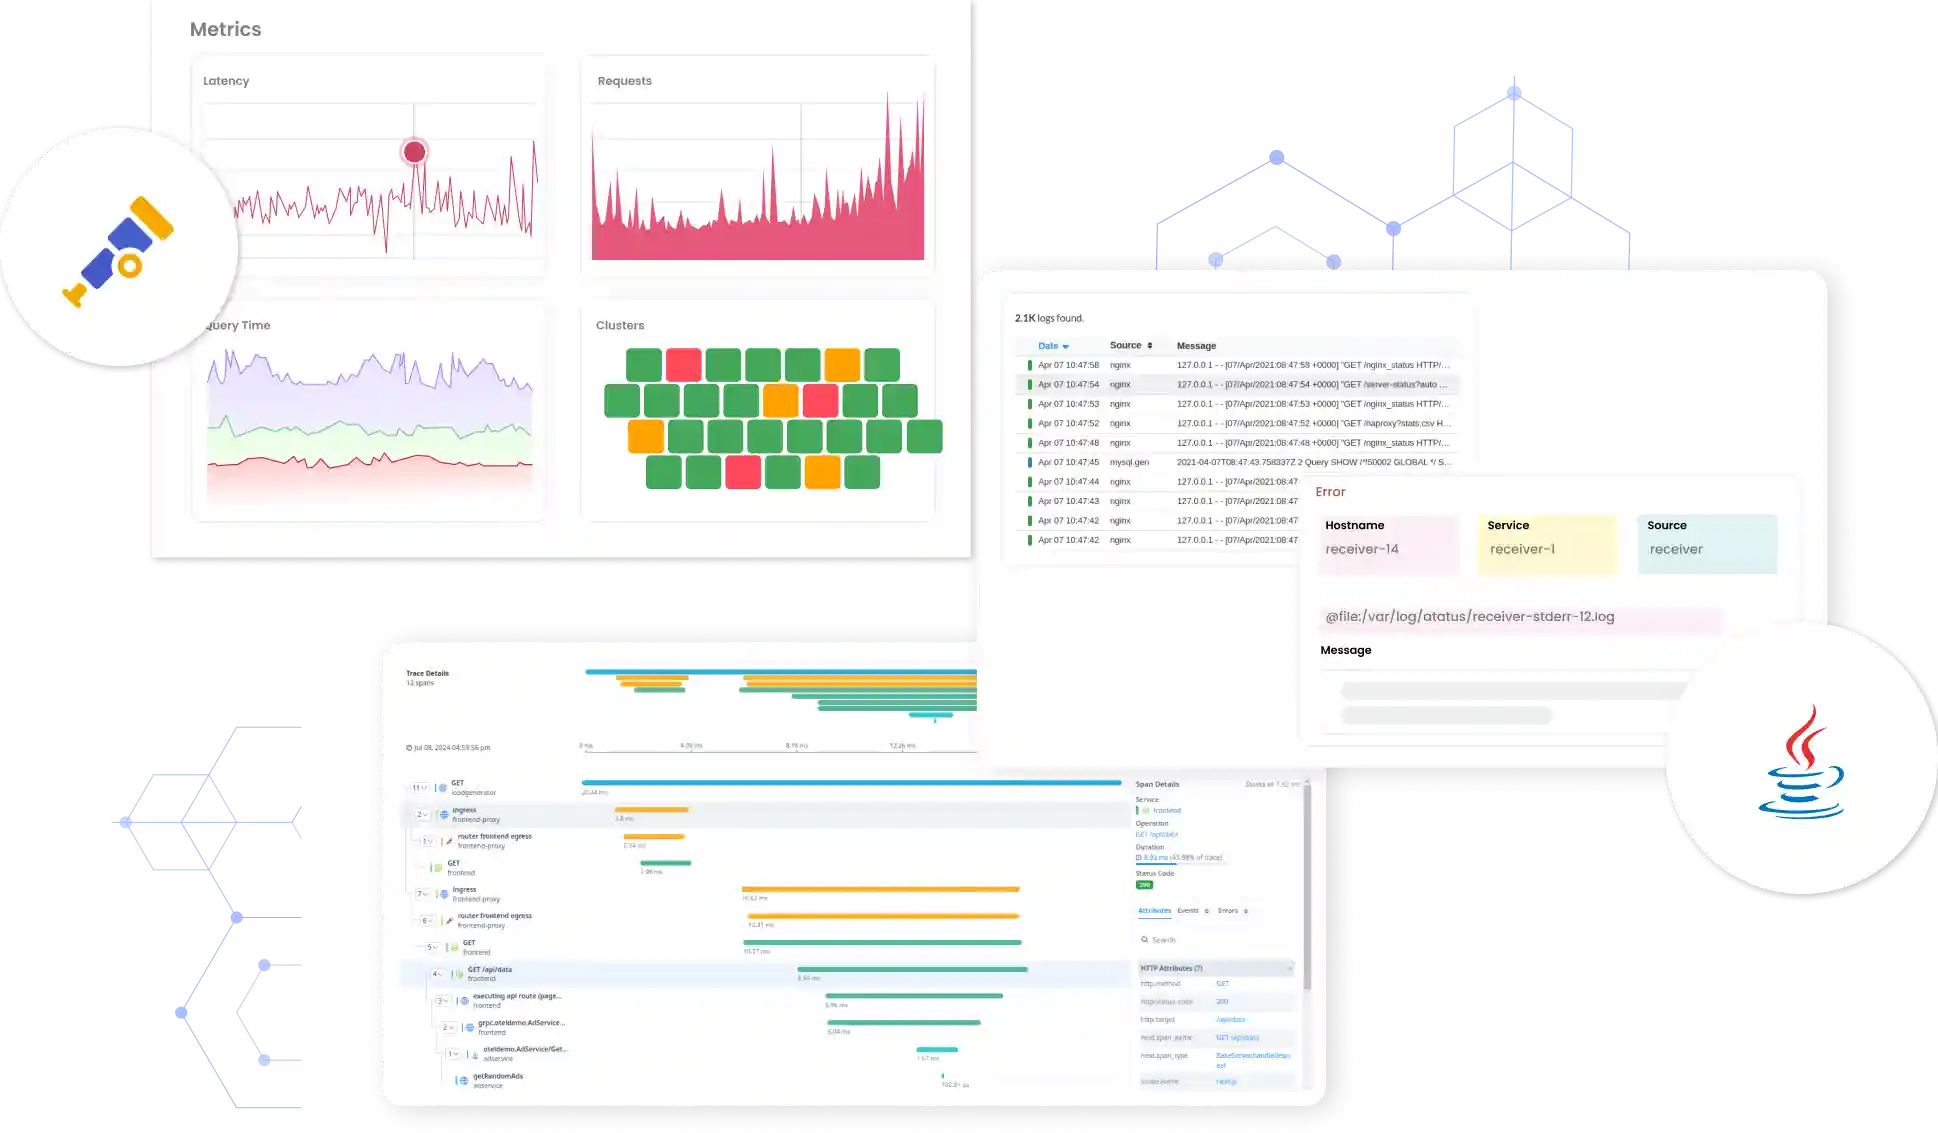
  • Aggregate application metrics and logs for proactive issue detection.
Simplified Troubleshooting and Root Cause Analysis

Seamless Integration with the Java Ecosystem

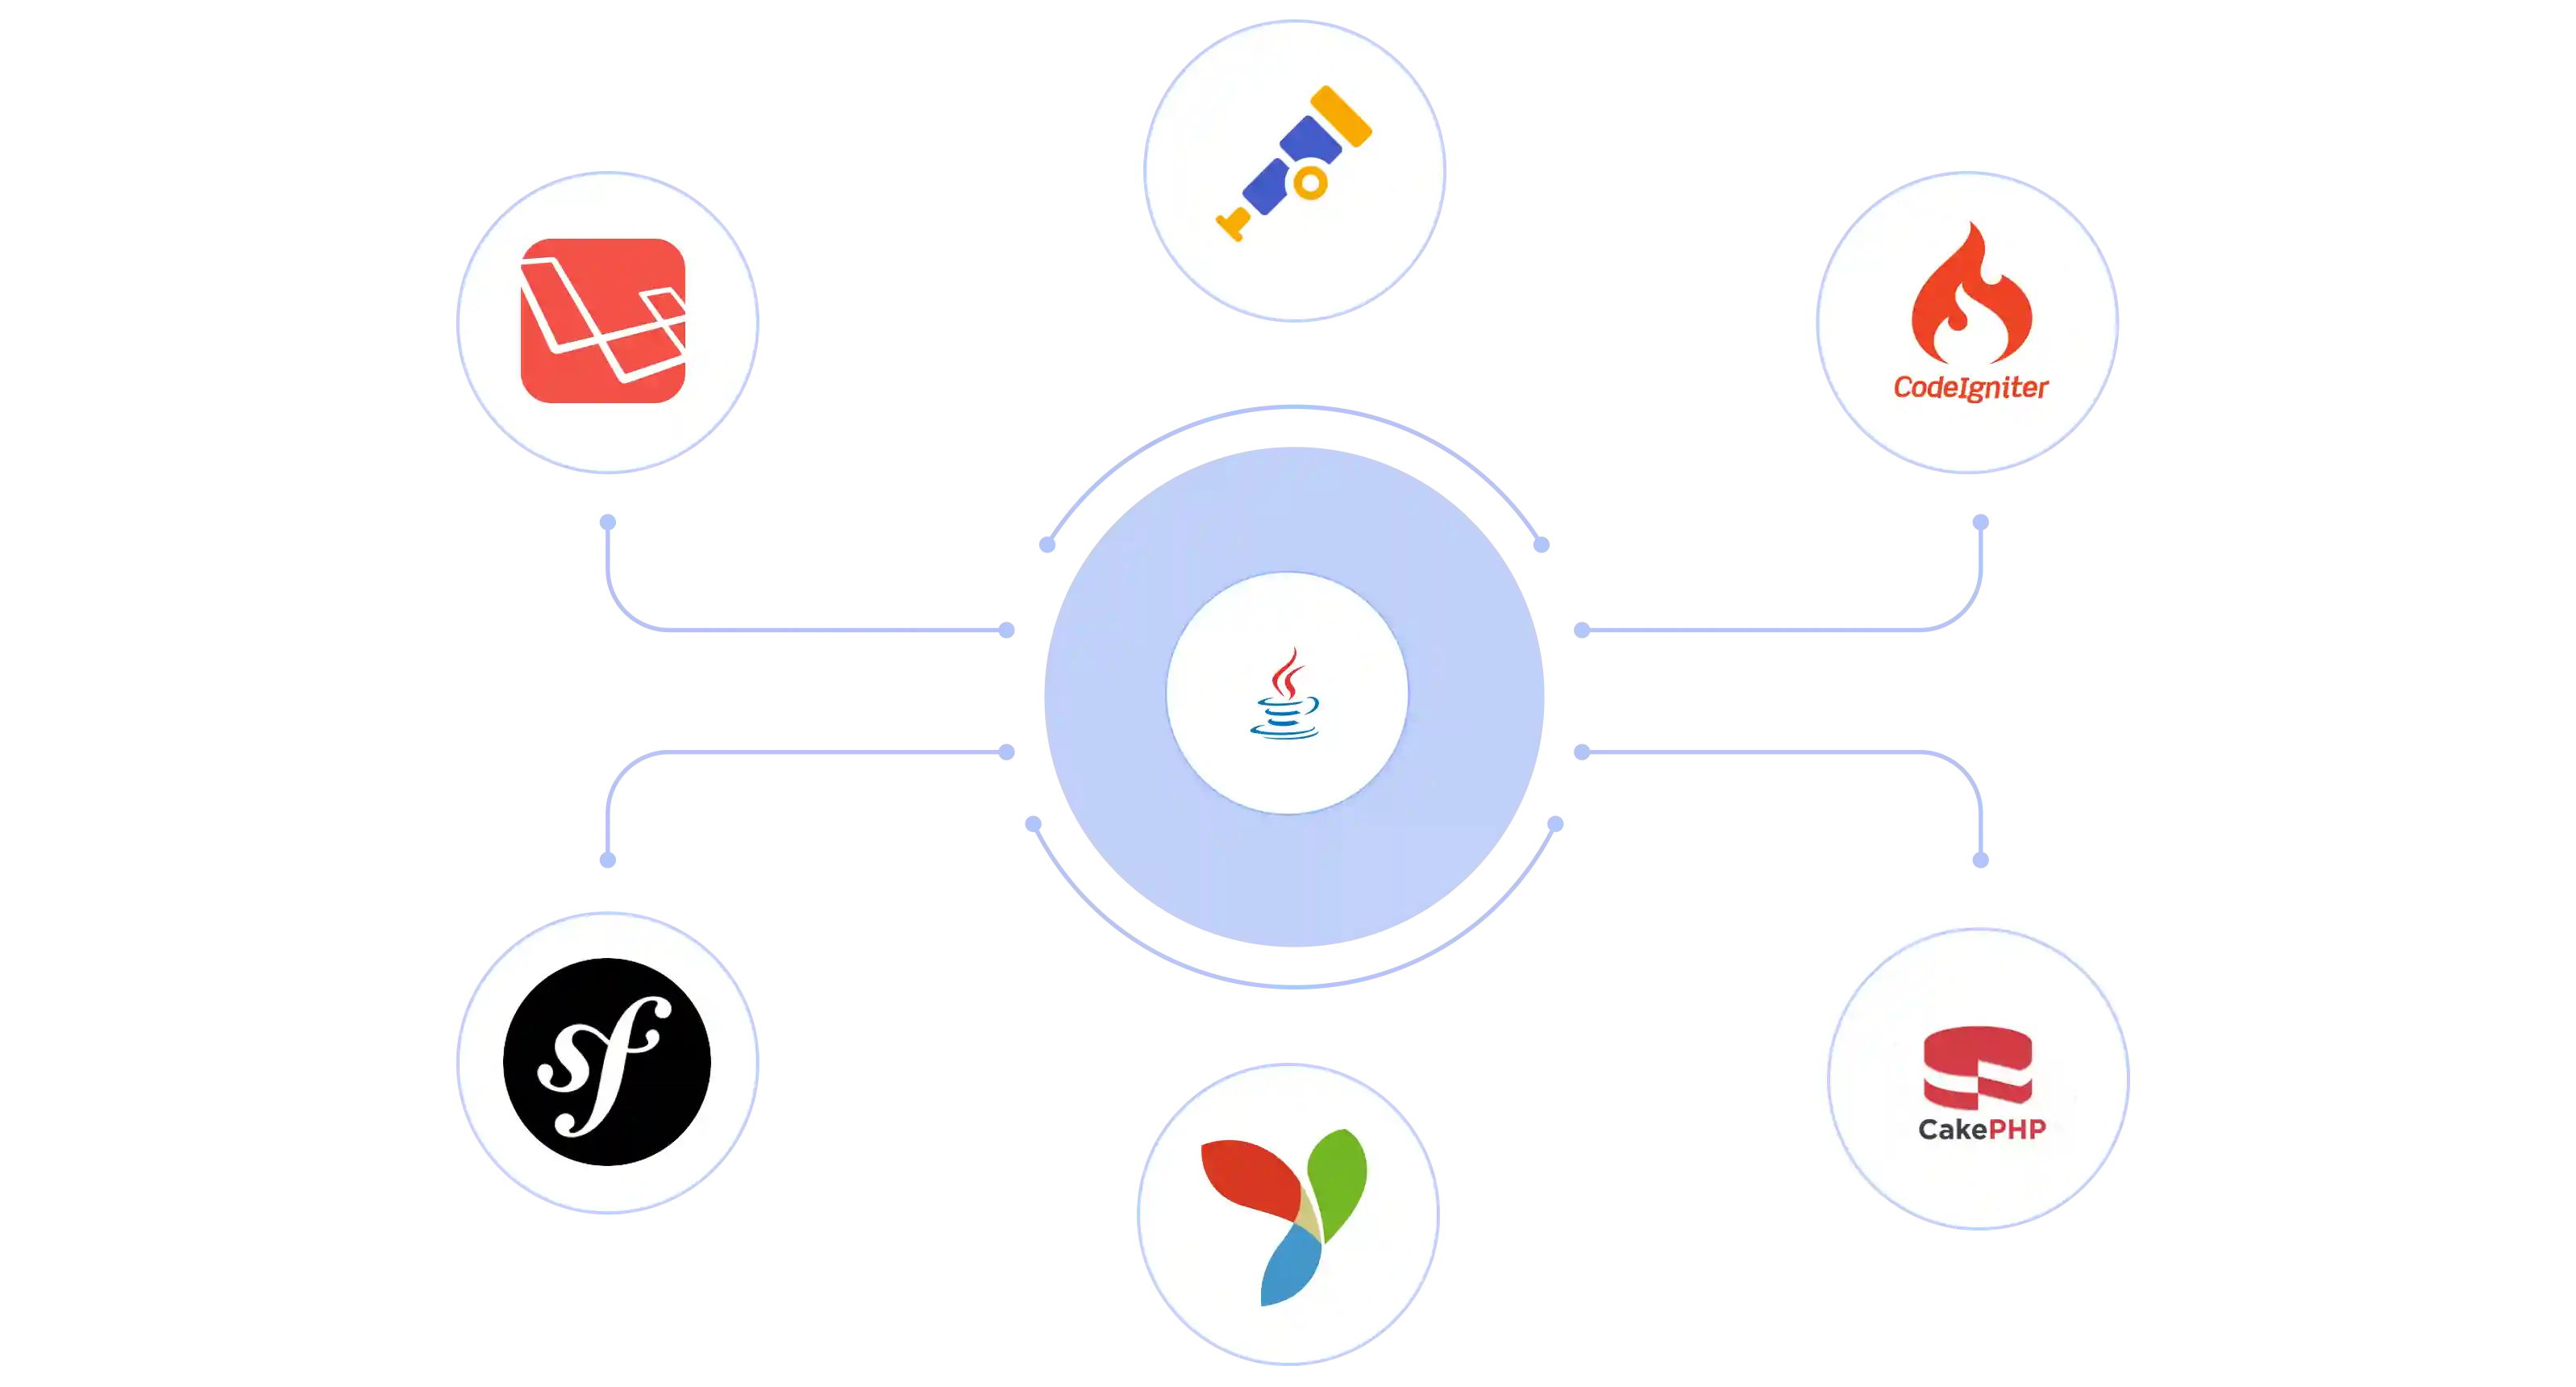
  • Comprehensive support for popular Java frameworks and servers, including Spring, Tomcat, JBoss, Wildfly, Grails, and WebSphere.
  • Trace operations with JDBC drivers, Hibernate, Redis, and MongoDB.
  • Monitor Java services in Docker and Kubernetes environments.
  • Compatibility with Gradle and Maven for easy setup and deployment.
Seamless Integration with Your Java Ecosystem

Start fixing issues impacting your users right now

Start a 14-day free trial. No credit card, no code changes, no hassle.

Awesome Support

Crazy Easy Install, Fast Time to Value

"Installed it to track a Laravel + MySQL app. Installation was insanely fast and easy, way way easier than the others I tried. I've already found a bunch of queries that need to be tuned, so I'm getting a lot of value already. They track absolutely everything, which gives me great insight into my application."

— Aaron F, Product Manager, Resolute Property Tax Solutions

FAQs for Atatus Java OpenTelemetry Integration

How do I set up the OpenTelemetry Collector binary to send Java telemetry data to Atatus?

The OpenTelemetry Collector binary collects and processes telemetry data, such as traces, metrics, and logs, from your Java applications. Install the Collector on your server using the official installation guide. Then, configure the Collector to send the telemetry data to Atatus by setting the Atatus OTLP endpoint and API key in the Collector’s configuration file.

Can I directly send telemetry data from my Java application to Atatus without using the OTel Collector?

Yes, you can use the OpenTelemetry Java SDK to send telemetry data directly to Atatus via the OTLP protocol. However, using the OTel Collector is recommended for better data aggregation, flexibility, and streamlined management of telemetry signals.

How does the OpenTelemetry Collector improve observability for Java applications with Atatus?

The OTel Collector enhances observability by aggregating telemetry signals from multiple sources (such as traces, logs, and metrics). It adds contextual data, including infrastructure and resource attributes, making it easier to correlate signals and gain deeper insights in the Atatus dashboard.

What frameworks and libraries are supported for Java OpenTelemetry integration?

Atatus supports popular Java frameworks like Spring, Tomcat, JBoss, Wildfly, Grails, and WebSphere. It also integrates with libraries like Hibernate, JDBC, and Redis, ensuring comprehensive monitoring of your Java-based applications and services.

You're in good company.

You don't have to trust our word. Hear what our customers say!

Atatus is a great product with great support. Super easy to integrate, it automatically hooks into everything. The support team and dev team were also very helpful in fixing a bug and updating the docs.
Tobias
Tobias L
Full Stack Engineer, ClearVoyage
Atatus is powerful, flexible, scalable, and has assisted countless times to identify issues in record time. With user identification, insight into XHR requests to name a few it is the monitoring tool we choose for our SPAs.
Jan Paul
Jan-Paul B
Chief Executive Officer, iSavta
Atatus continues to deliver useful features based on customer feedback. Atatus support team has been responsive and gave visibility into their timeline of requested features.
Daniel
Daniel G
Software Engineer, MYND Management

Trusted Protection through Global Compliance

Feel assured as we maintain rigorous security protocols, ensuring the safety of your data with every interaction
SOC 2 Type 2 Compliant
ISO 27001 Certified
ISO 27001 Certified
GDPR & CCPA Compliant

Ready to see actionable data?

Avail Atatus features for 14 days free-trial. No credit card required. Instant set-up.