.NET OpenTelemetry Integration

Unlock observability for your .NET applications with Atatus OpenTelemetry integration. Gain deep insights, optimize performance, and troubleshoot faster with seamless instrumentation tailored for the .NET ecosystem.
Start your 14-day free trial. No credit card required.
.NET OpenTelemetry Integration

Comprehensive Observability with OpenTelemetry

  • Leverage OpenTelemetry to collect telemetry data across your entire .NET application stack.
  • Integrate with .NET libraries like ASP.NET Core, Entity Framework, and more for end-to-end observability.
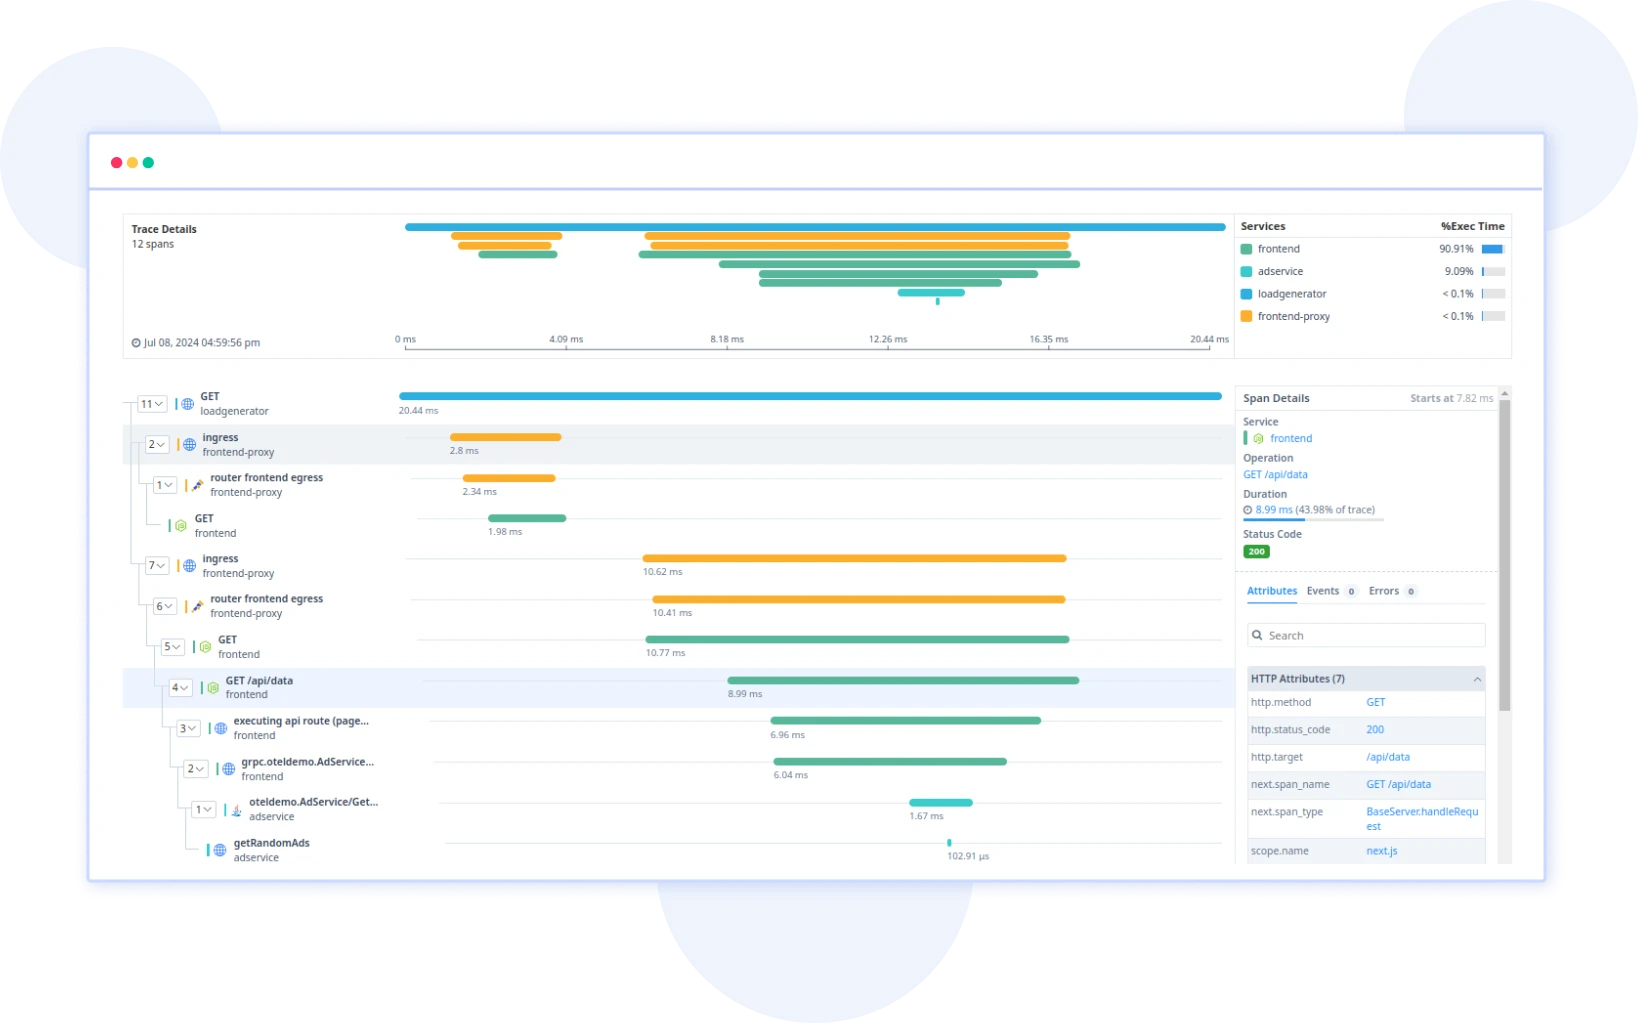
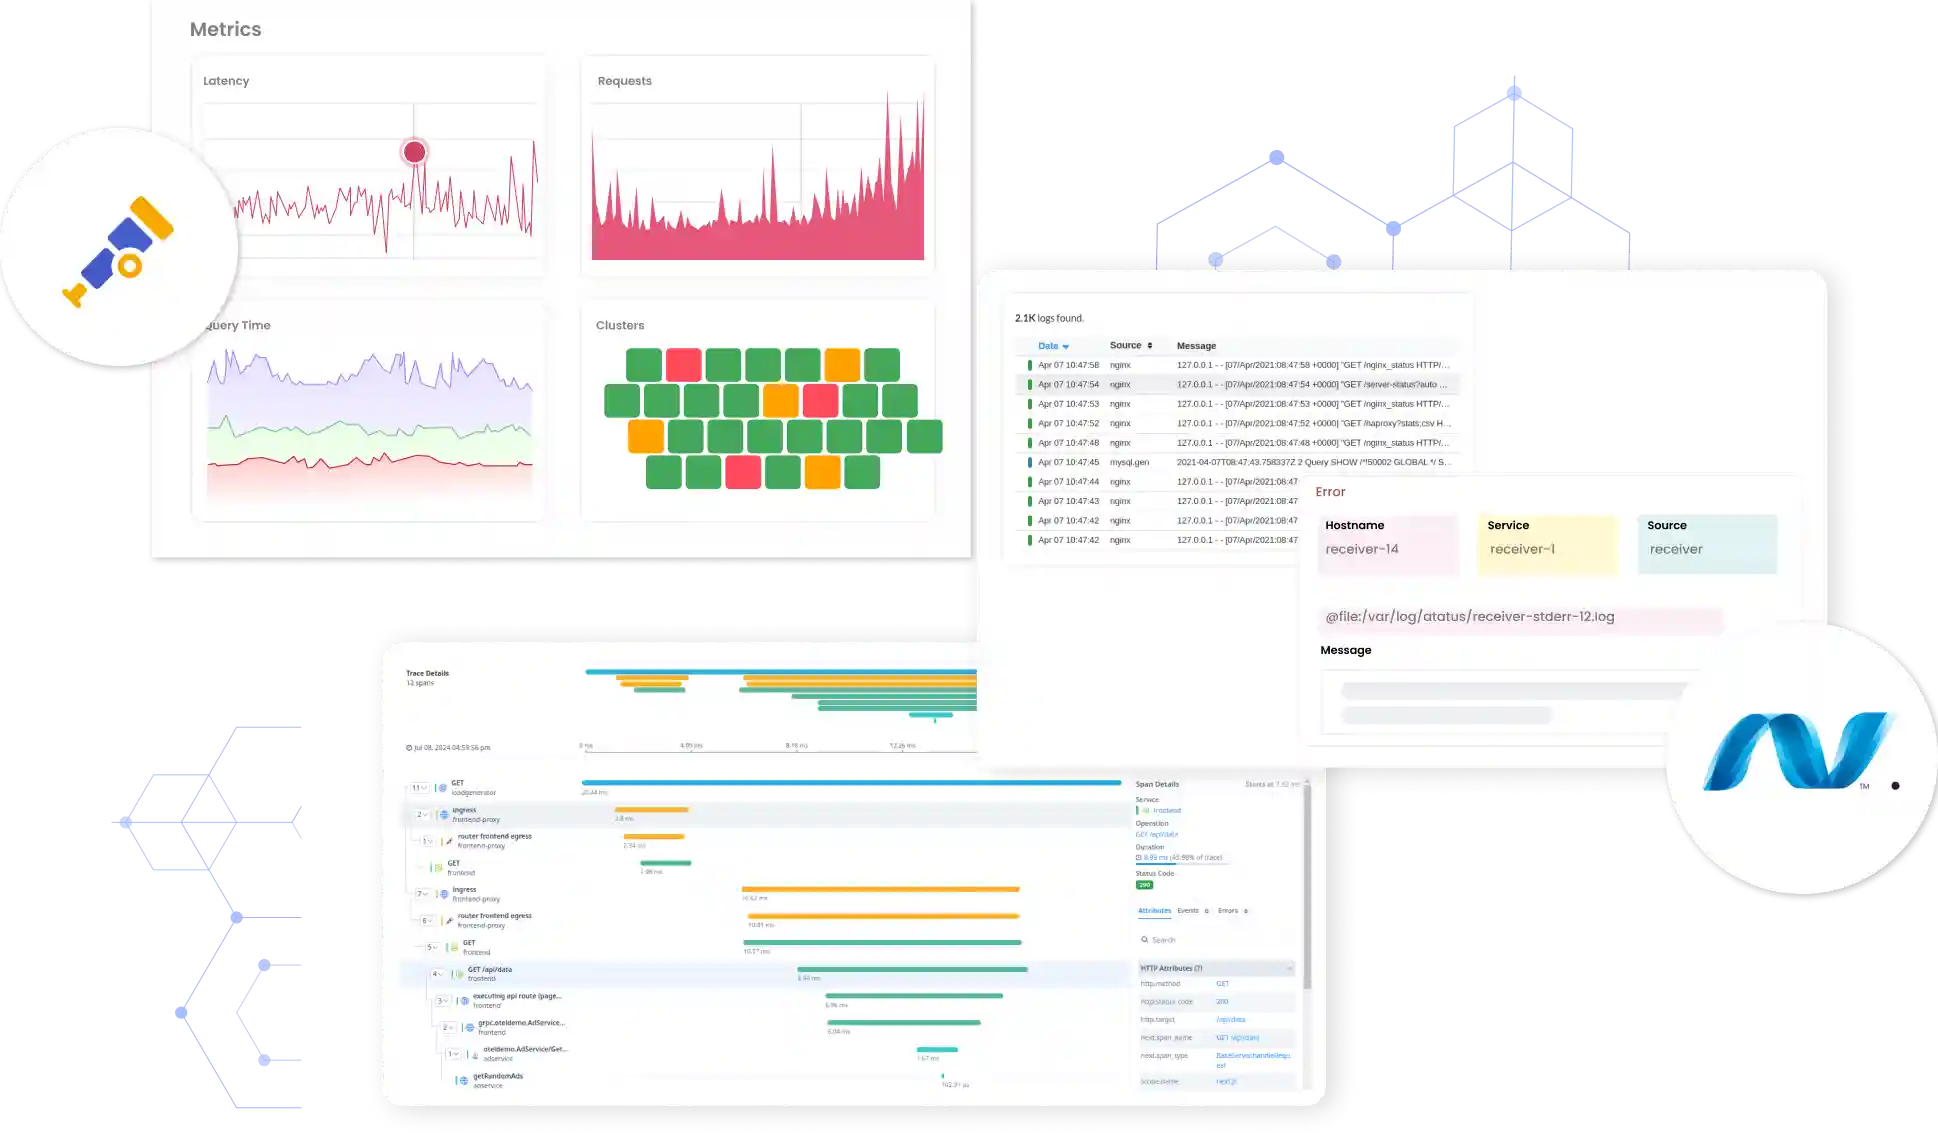
  • Visualize traces, logs, and metrics in a unified Atatus dashboard for a holistic view.
  • Correlate different telemetry signals to gain deep insights into application performance.
Comprehensive Observability with OpenTelemetry

Streamlined Performance Monitoring

  • Track the performance of your .NET applications with real-time telemetry data.
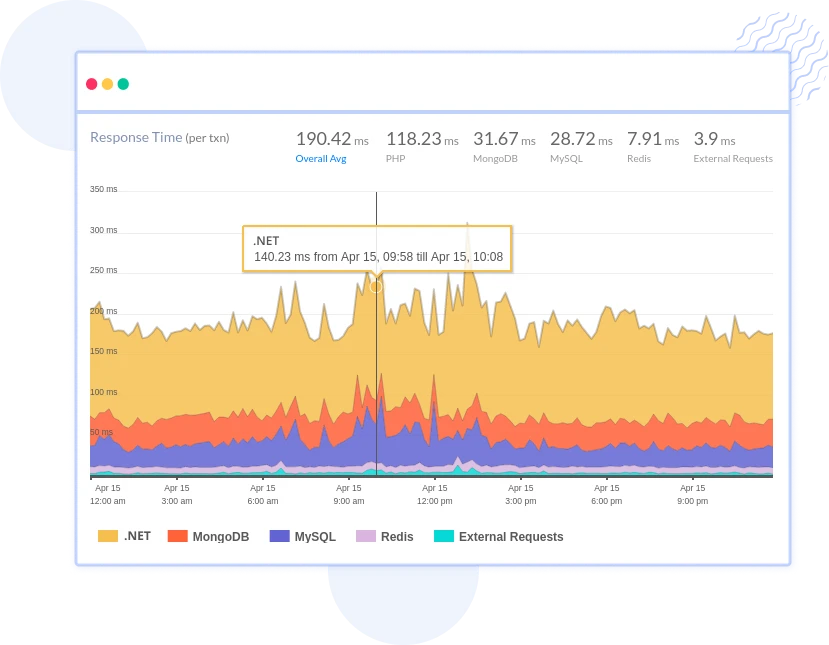
  • Monitor key performance indicators (KPIs) such as response times, latency, and throughput.
  • Automatically detect performance bottlenecks, slow database queries, and other issues.
  • Integrate with Atatus’ APM tools for actionable insights and efficient monitoring.
Streamlined Performance Monitoring

Simplified Troubleshooting and Root Cause Analysis

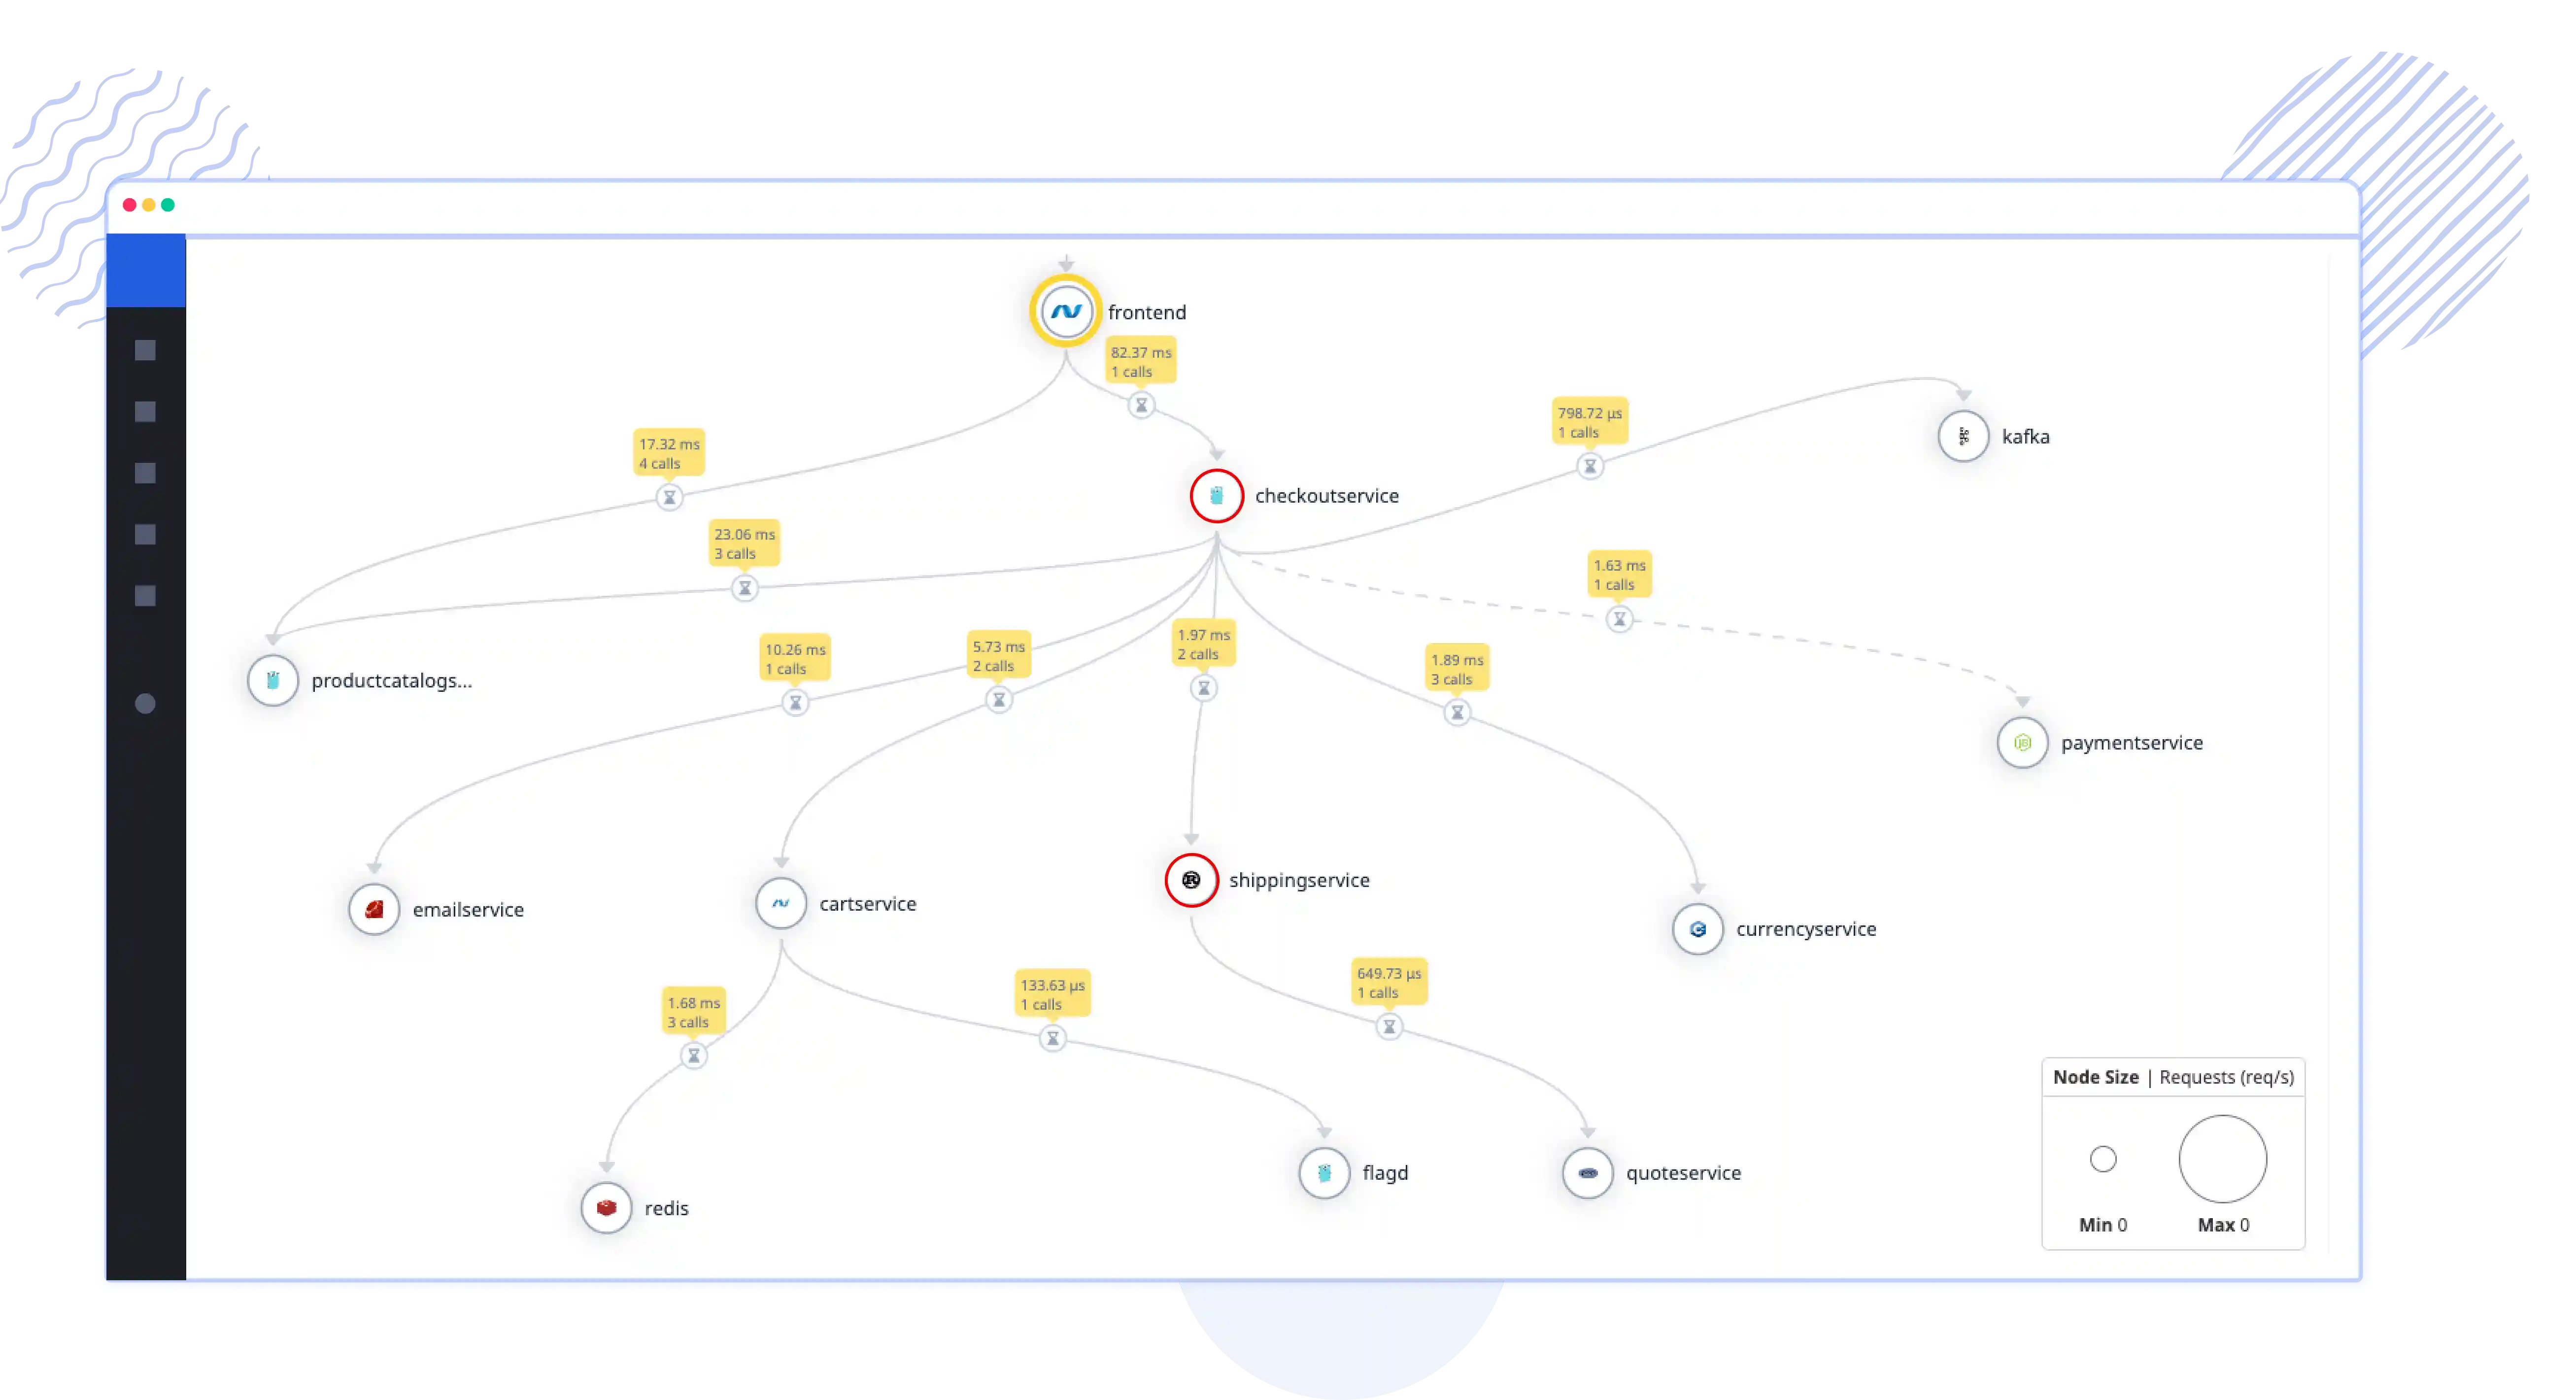
  • Use OpenTelemetry to easily trace requests across multiple .NET services.
  • Gain access to full trace data to troubleshoot errors, exceptions, and performance issues.
  • Identify the root causes of problems faster with clear, contextual error and log correlation.
  • Take advantage of Atatus’ distributed tracing to follow requests in complex, multi-layered .NET applications.
Simplified Troubleshooting and Root Cause Analysis

Deep Dive into .NET-Specific Instrumentation

  • Automatically instrument .NET libraries like ASP.NET Core for tracing and metrics collection.
  • Enhance instrumentation with custom spans and metrics for deeper insights into your specific application flow.
  • Use Atatus’ monitoring capabilities to track third-party integrations like SQL Server, Redis, and more.
  • Benefit from integration with .NET's native telemetry system for easy setup and minimal overhead.
Deep Dive into .NET-Specific Instrumentation

Start fixing issues impacting your users right now

Start a 14-day free trial. No credit card, no code changes, no hassle.

Awesome Support

Crazy Easy Install, Fast Time to Value

"Installed it to track a Laravel + MySQL app. Installation was insanely fast and easy, way way easier than the others I tried. I've already found a bunch of queries that need to be tuned, so I'm getting a lot of value already. They track absolutely everything, which gives me great insight into my application."

— Aaron F, Product Manager, Resolute Property Tax Solutions

FAQs for Atatus .NET OpenTelemetry Integration

How do I set up the OpenTelemetry Collector binary to send .NET telemetry data to Atatus?

The OpenTelemetry Collector binary acts as an intermediary to gather telemetry signals, including traces, metrics, and logs. Install the Collector on your server or VM using the official installation guide. Configure the Collector to export data to Atatus by specifying the Atatus OTLP endpoint and API key in the Collector's configuration file.

Can I directly send telemetry data from my .NET application to Atatus without the OpenTelemetry Collector?

Yes, the OpenTelemetry .NET SDK allows direct exporting of telemetry data to Atatus using the OTLP protocol. However, using the OpenTelemetry Collector is recommended for added flexibility, centralized management of telemetry pipelines, and enriched contextual data.

How does the OpenTelemetry Collector enhance the observability of .NET applications with Atatus?

The OpenTelemetry Collector aggregates telemetry signals from various sources, such as traces, metrics, and logs, while appending valuable resource and infrastructure attributes. This enhances the context and correlation of collected signals, enabling deeper insights and more effective monitoring within the Atatus dashboard.

What types of telemetry data can I collect from my .NET applications using Atatus??

Atatus supports the collection of traces, metrics, and logs from your .NET applications. This includes key performance metrics like request latency, error rates, and database query performance, along with detailed logs for debugging and contextual traces for root cause analysis.

You're in good company.

You don't have to trust our word. Hear what our customers say!

Atatus is a great product with great support. Super easy to integrate, it automatically hooks into everything. The support team and dev team were also very helpful in fixing a bug and updating the docs.
Tobias
Tobias L
Full Stack Engineer, ClearVoyage
Atatus is powerful, flexible, scalable, and has assisted countless times to identify issues in record time. With user identification, insight into XHR requests to name a few it is the monitoring tool we choose for our SPAs.
Jan Paul
Jan-Paul B
Chief Executive Officer, iSavta
Atatus continues to deliver useful features based on customer feedback. Atatus support team has been responsive and gave visibility into their timeline of requested features.
Daniel
Daniel G
Software Engineer, MYND Management

Trusted Protection through Global Compliance

Feel assured as we maintain rigorous security protocols, ensuring the safety of your data with every interaction
SOC 2 Type 2 Compliant
ISO 27001 Certified
ISO 27001 Certified
GDPR & CCPA Compliant

Ready to see actionable data?

Avail Atatus features for 14 days free-trial. No credit card required. Instant set-up.