Rails

Transform insights into action with the Atatus Ruby agent and keep your Rails application running smoothly. Quickly identify and resolve Rails performance issues to enhance user experience and optimize your application’s efficiency.

Sign Up for Free
Rails APM Monitoring

Key Performance Metrics for Rails APM Monitoring

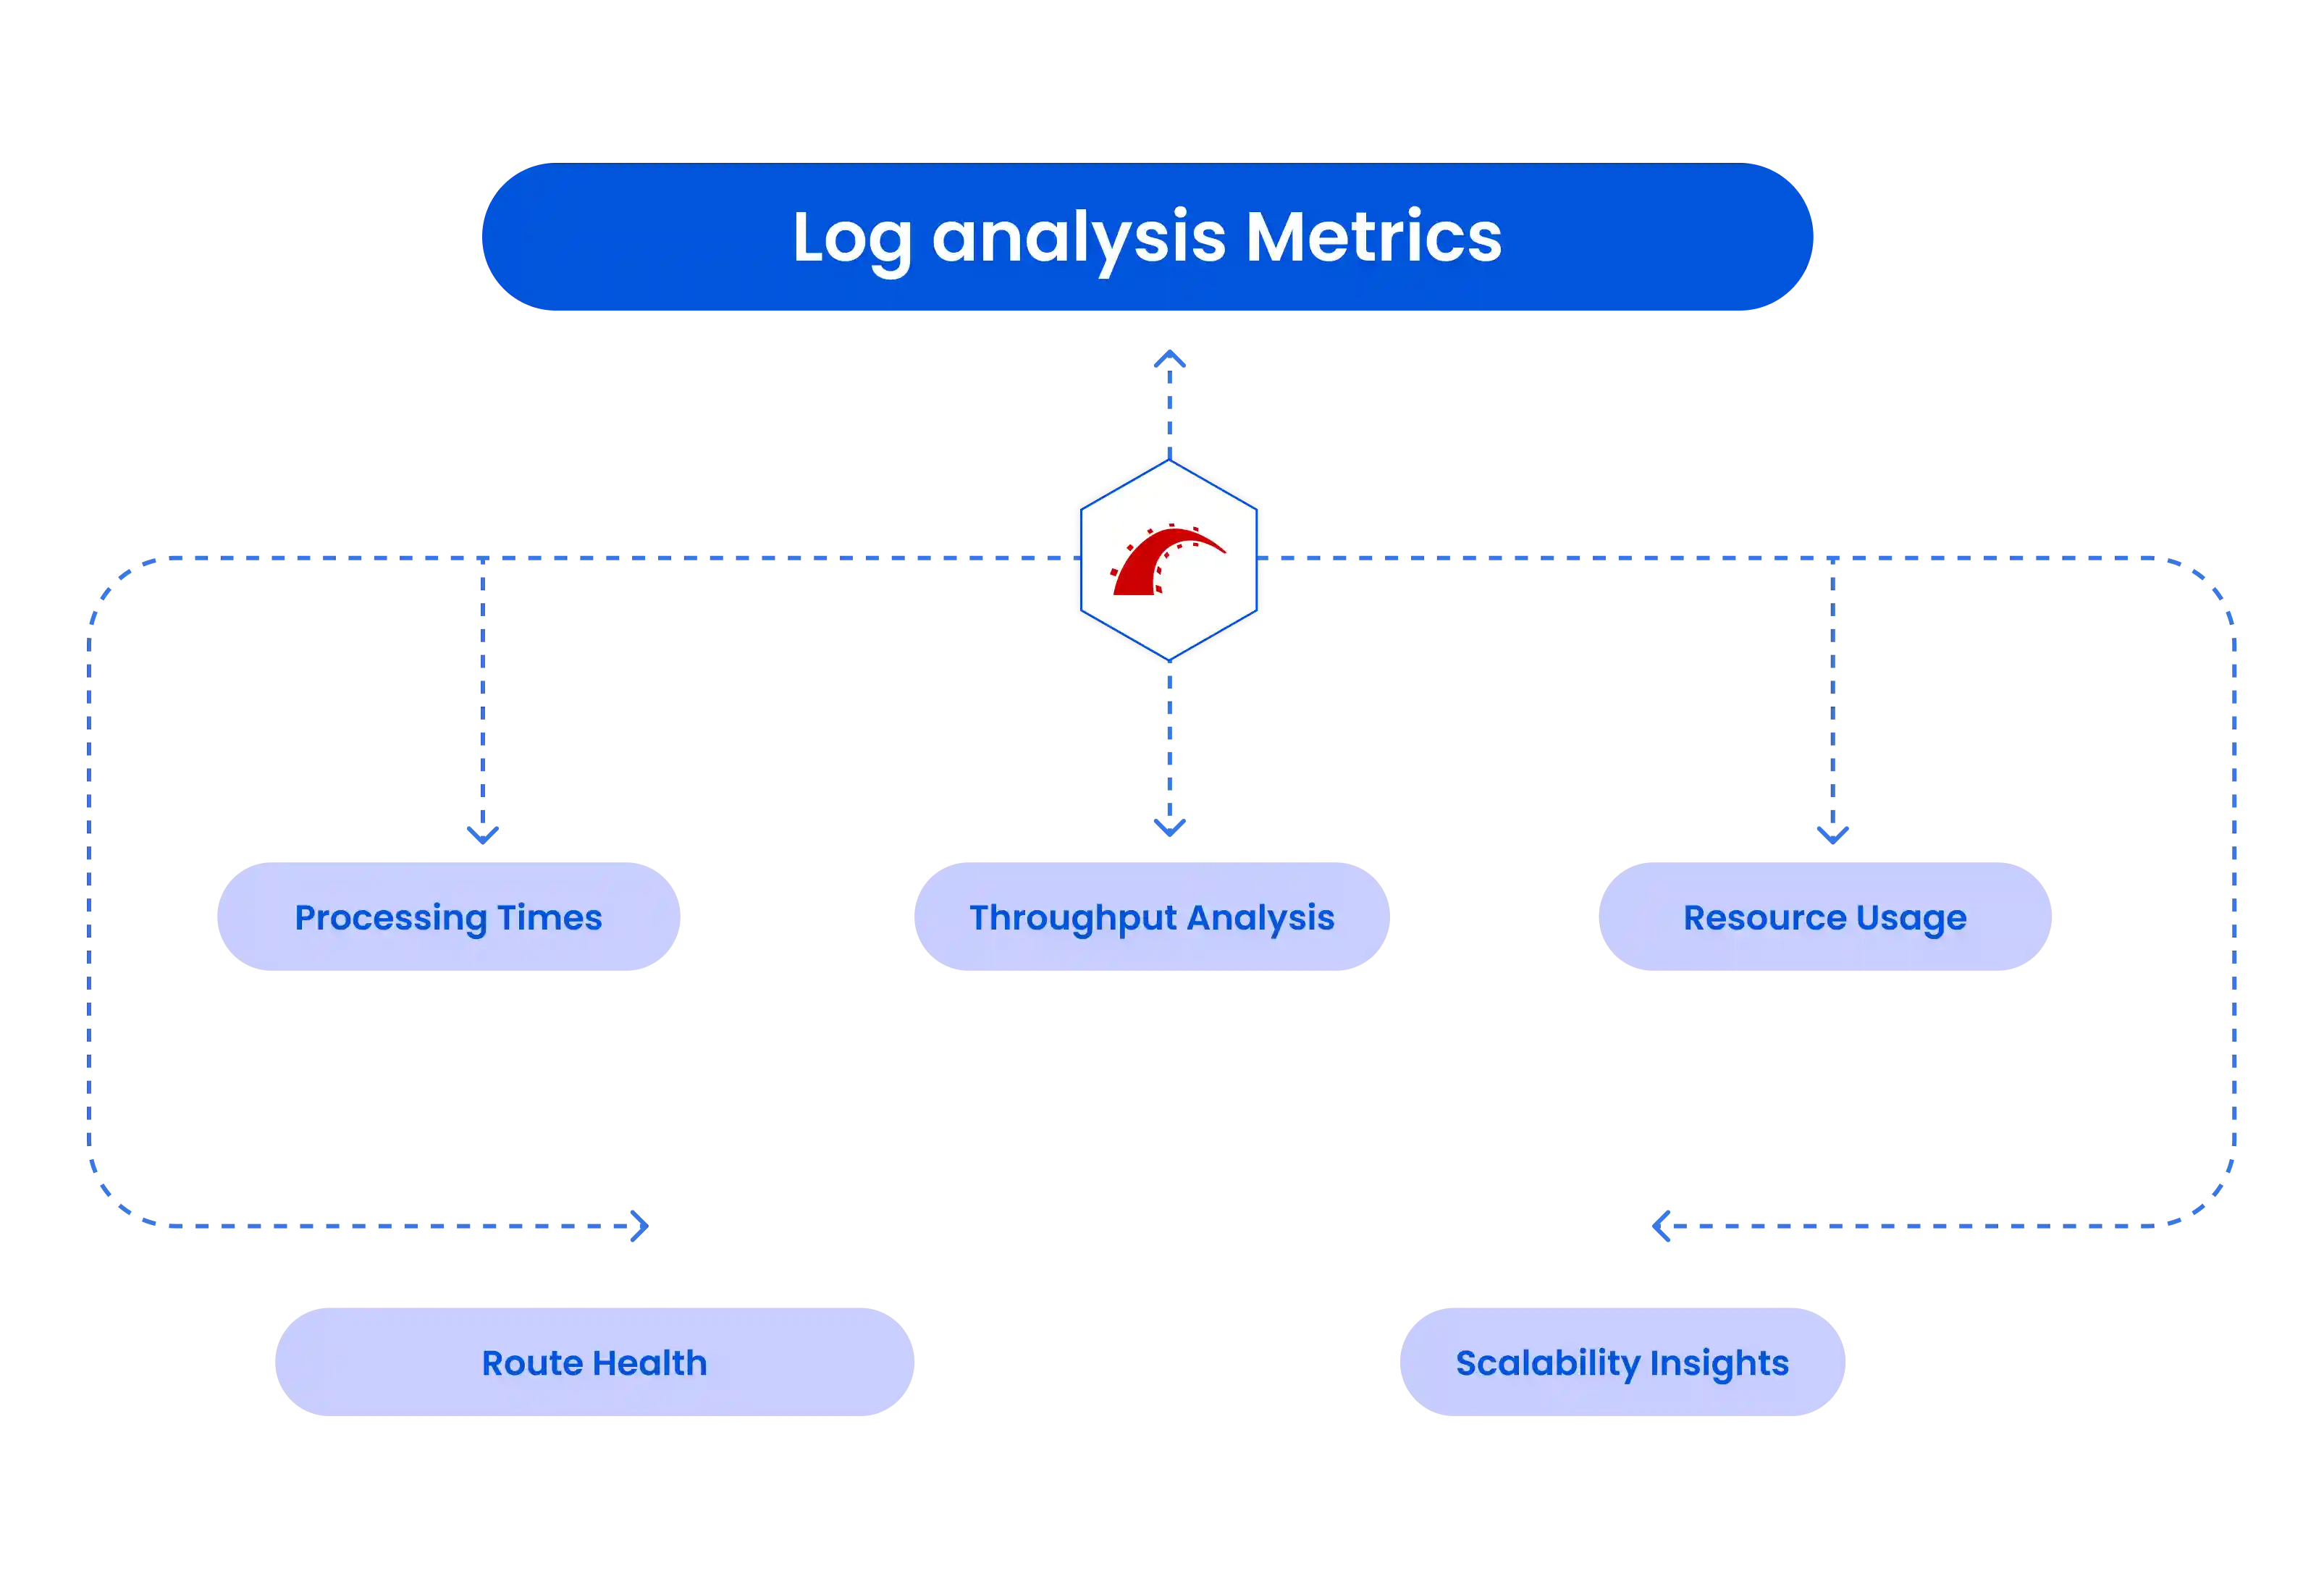
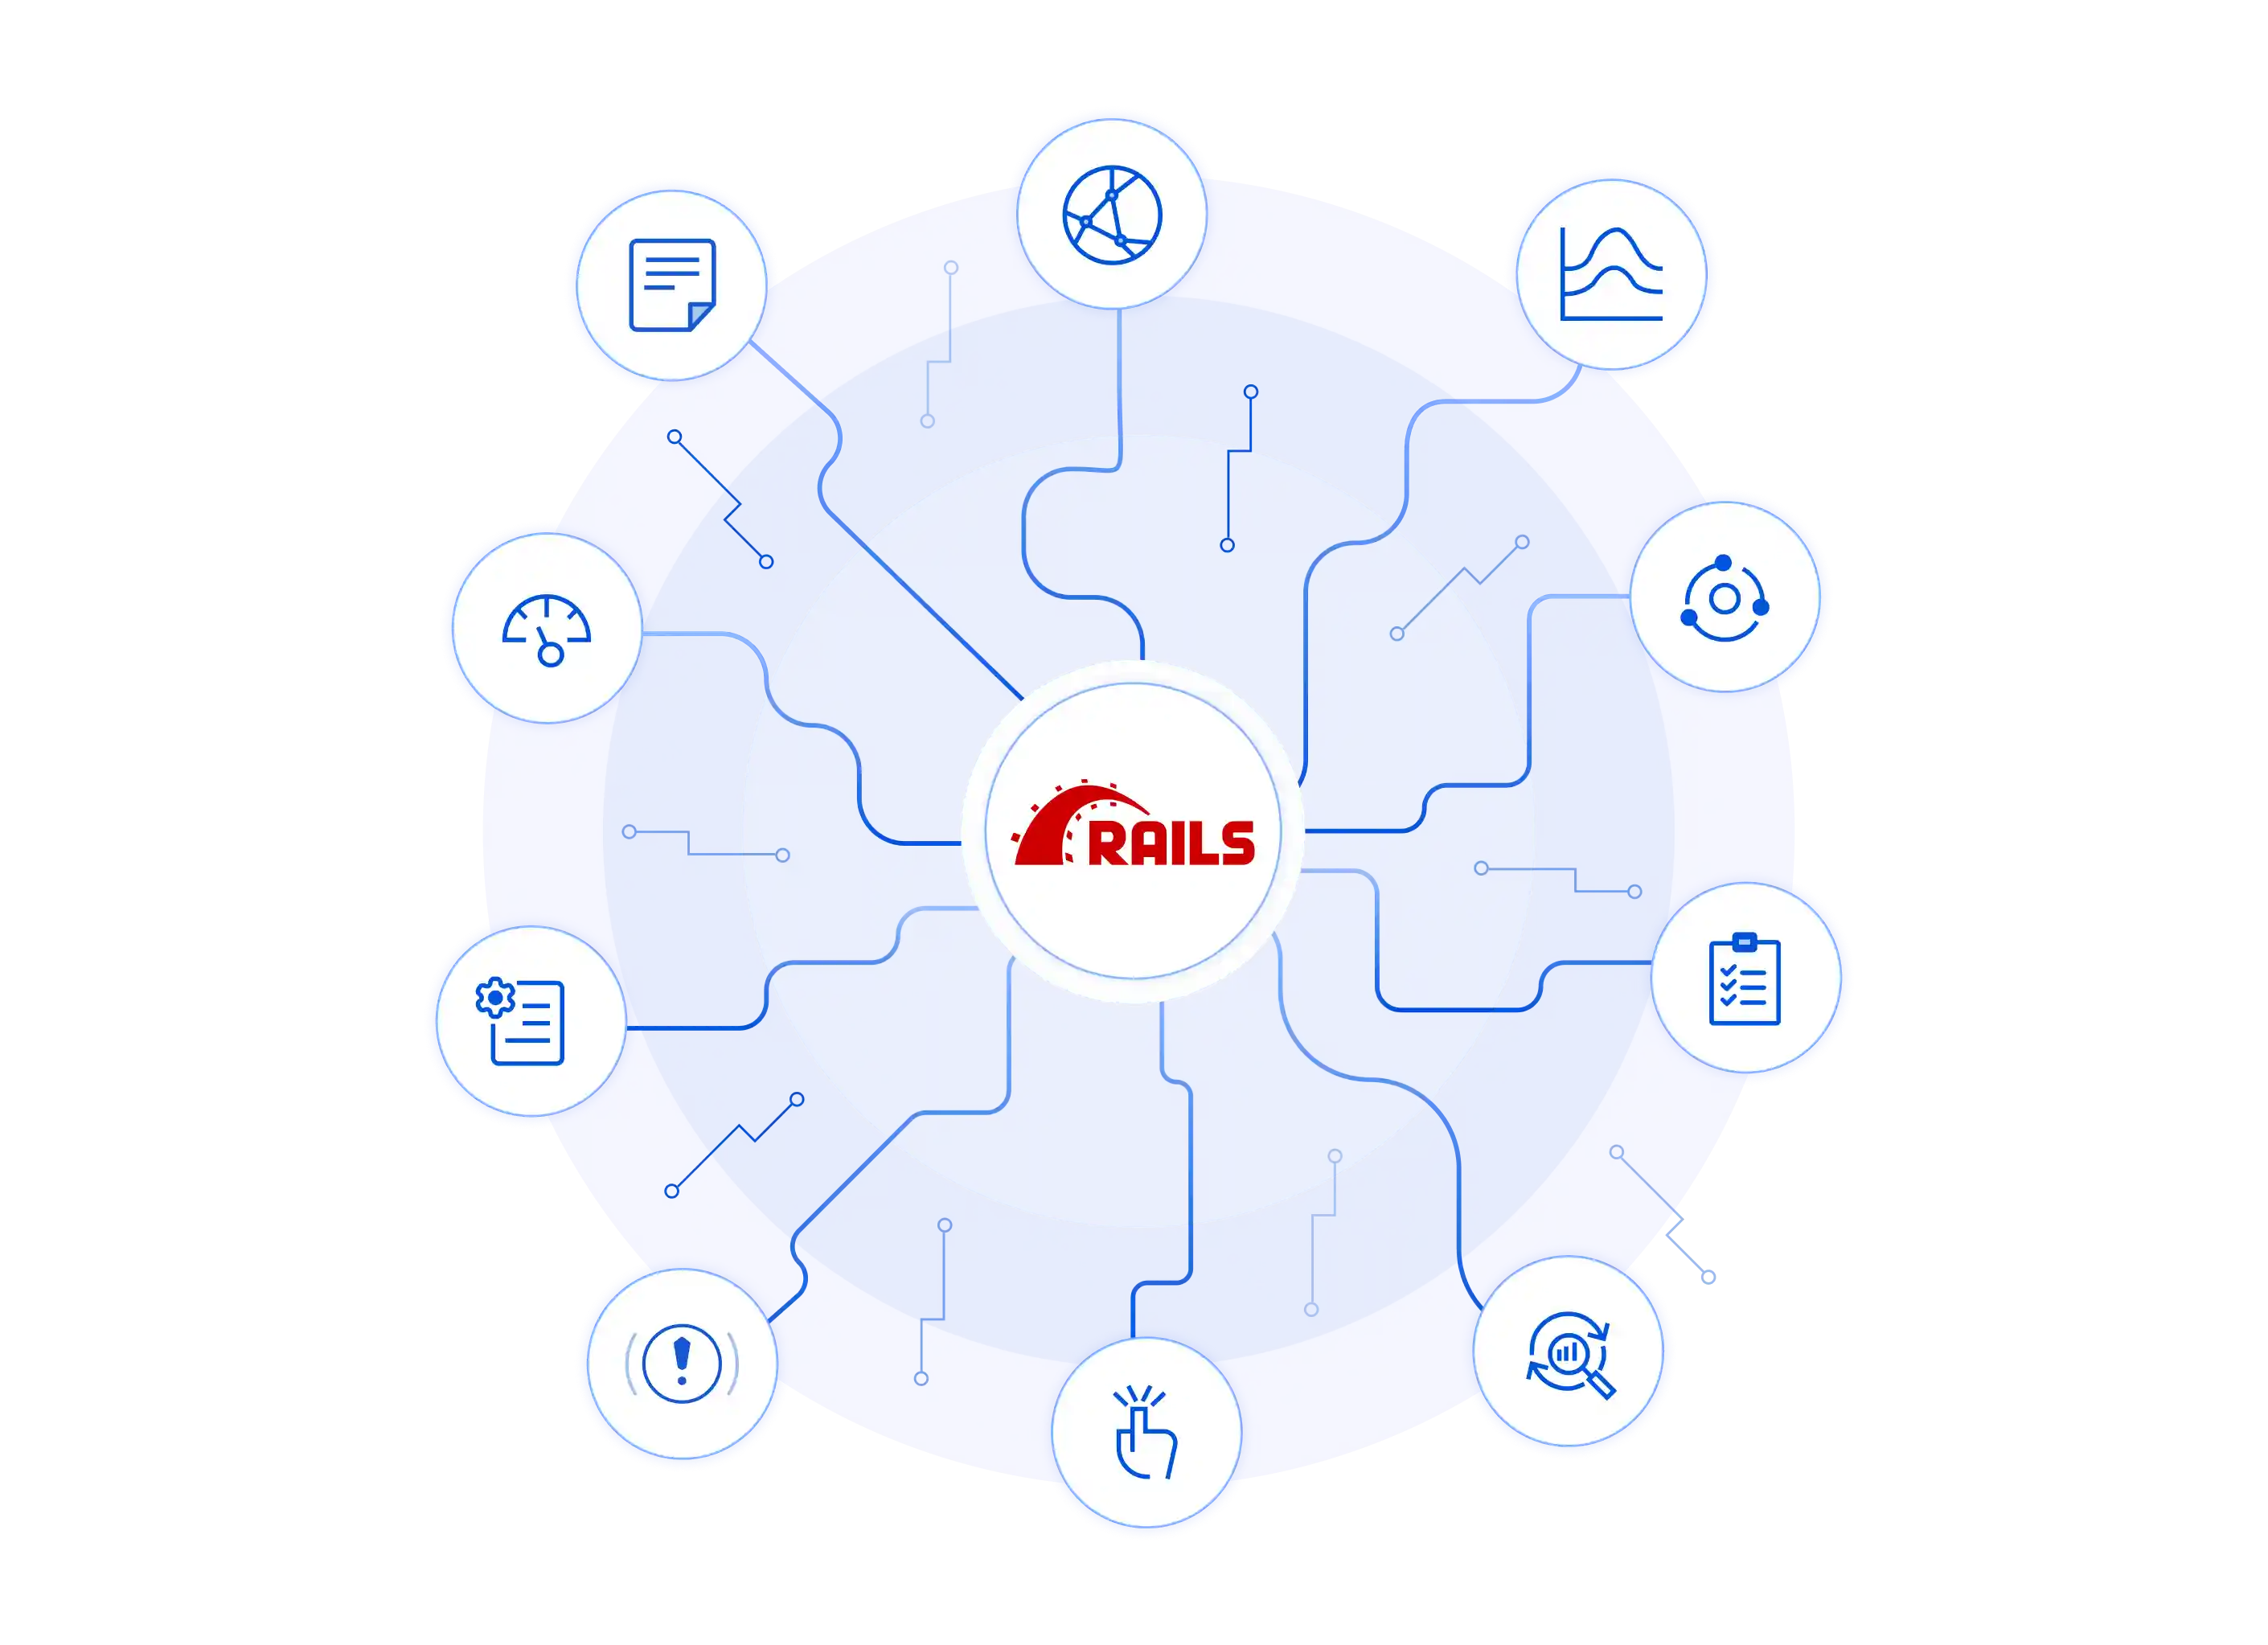
Monitor these key metrics to ensure your Rails application performs efficiently and securely, allowing you to detect potential issues before they affect application performance and user experience.

Request Throughput

Request Throughput

Measure the number of HTTP requests handled by the application per second. This metric helps identify traffic patterns and potential bottlenecks.

Active Record Query Performance

Active Record Query Performance

Monitor the execution time of Active Record queries, including average query duration and the number of queries executed per request. This helps optimize database interactions.

Controller Action Performance

Controller Action Performance

Track the time taken by each controller action to respond to requests. This metric allows you to identify slow actions and improve overall application responsiveness.

Background Job Processing Time

Background Job Processing Time

Measure the duration of background job processing. This metric is crucial for ensuring that background tasks are completed efficiently and do not accumulate.

Error Rate by Action

Error Rate by Action

Monitor the rate of errors (such as 500 Internal Server Errors) for each controller action. This metric helps identify problematic areas in the application that may need debugging.

View Rendering Time

View Rendering Time

Track the time taken to render views in your Rails application. This metric is important for optimizing front-end performance and ensuring a smooth user experience.

Why Rails Monitoring Matters?

Rails monitoring is essential for pinpointing slow Active Record queries, tracking controller performance, and detecting background job delays. Focusing on these critical areas helps prevent performance degradation, ensures faster response times, and improves the reliability of your Rails application, leading to a seamless user experience.

Optimize Performance with Real-Time Insights

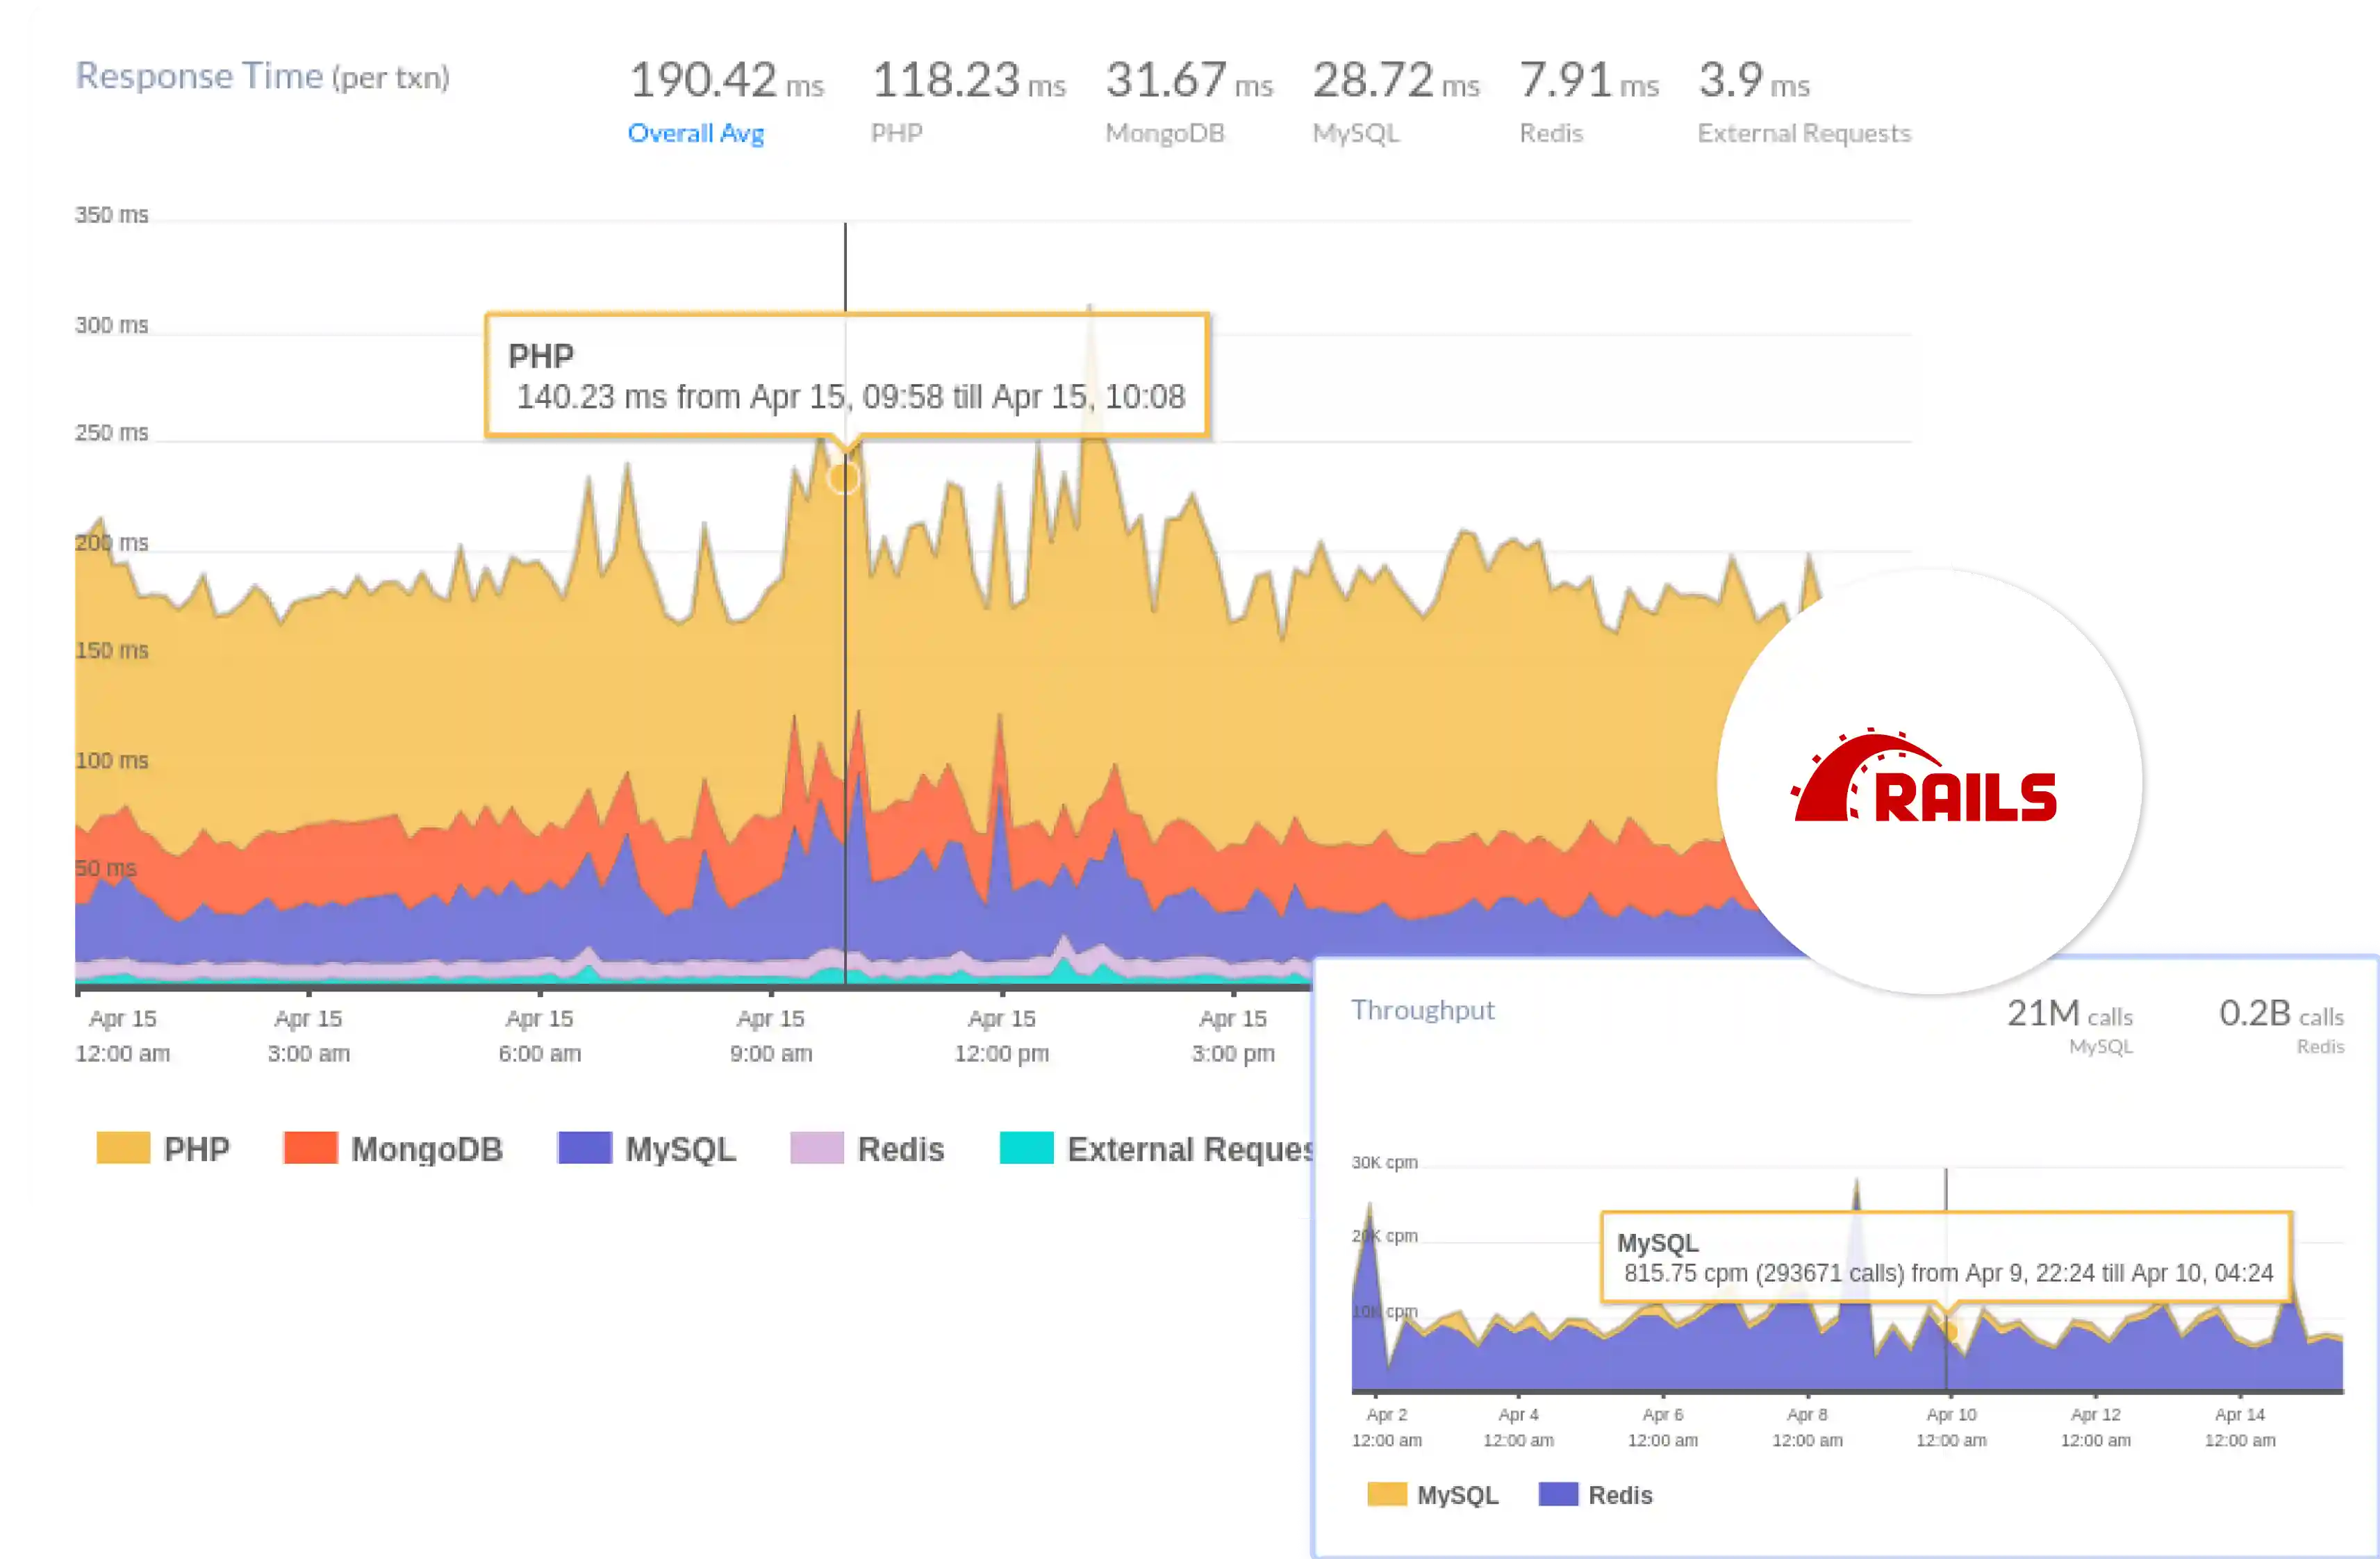
Monitoring Rails applications provides real-time visibility into performance metrics, such as response times and throughput. With Atatus, you can pinpoint slow requests, optimize bottlenecks, and enhance overall user experience. This proactive approach allows teams to address issues before they escalate, ensuring a smoother application flow.

Rails Scalability

Streamline Database Interactions

Active Record is a powerful feature of Rails, but it can also lead to performance issues if not monitored effectively. With Atatus, you can analyze query performance and identify inefficient database calls. This insight allows you to optimize database interactions, leading to faster application responses and more efficient resource usage.

Streamline Database Interactions

Enhance Application Reliability

Rails monitoring helps identify and resolve errors quickly, reducing downtime and maintaining user trust. By tracking error rates and understanding their root causes, your team can implement fixes promptly. Atatus empowers your organization to deliver a more reliable service, minimizing disruptions and keeping users engaged.

Enhance Application Reliability

Empower Data-Driven Decisions

In-depth Rails monitoring equips your organization with the data needed to make informed decisions. By analyzing user interactions, performance metrics, and system health, you can identify trends and areas for improvement. This data-driven approach enables your team to prioritize development efforts and align them with user needs, driving continuous improvement.

Rails Data-Driven Decisions

FAQs for Rails APM Monitoring

What is Rails?

Rails, or Ruby on Rails, is an open-source web application framework written in Ruby. It follows the Model-View-Controller (MVC) architecture and emphasizes convention over configuration, making it easier for developers to create robust and scalable web applications quickly.

How does the Atatus Ruby agent help with Rails monitoring?

The Atatus Ruby agent provides real-time insights into your Rails application’s performance. It tracks key metrics, captures errors, and offers detailed reporting, enabling you to identify and resolve issues quickly and effectively.

Can I monitor background jobs with Atatus?

Yes, Atatus allows you to monitor background job processing times, helping you identify delays and optimize job execution. This ensures that background tasks do not hinder your application's overall performance.

How does Atatus handle alerts for Rails applications?

Atatus provides robust alerting capabilities that notify your team of performance degradation, high error rates, or other anomalies in real time. You can customize alert conditions based on key metrics, ensuring that you receive timely notifications tailored to your application’s unique needs.

How can Rails monitoring improve my application's performance?

By providing real-time insights into key performance metrics, Rails monitoring enables you to identify slow queries, inefficient routes, and high error rates. This information empowers you to make informed decisions that optimize application performance and enhance user satisfaction.

Ready to see actionable data?

Avail Atatus features for 14 days free-trial. No credit card required. Instant set-up.