Unlock full-stack visibility with Atatus’s MERN Stack Monitoring. Track React frontend performance, Node.js backend efficiency, and MongoDB query times, all in one platform. Stay ahead of issues and optimize every layer of your application for peak performance.
Sign Up for FreeMonitor these key metrics to ensure your MERN stack monitoring performs efficiently and securely, enabling you to detect potential issues before they affect your applications and server performance.
Tracks the time taken for MongoDB queries to execute, helping identify slow queries that might be blocking requests.
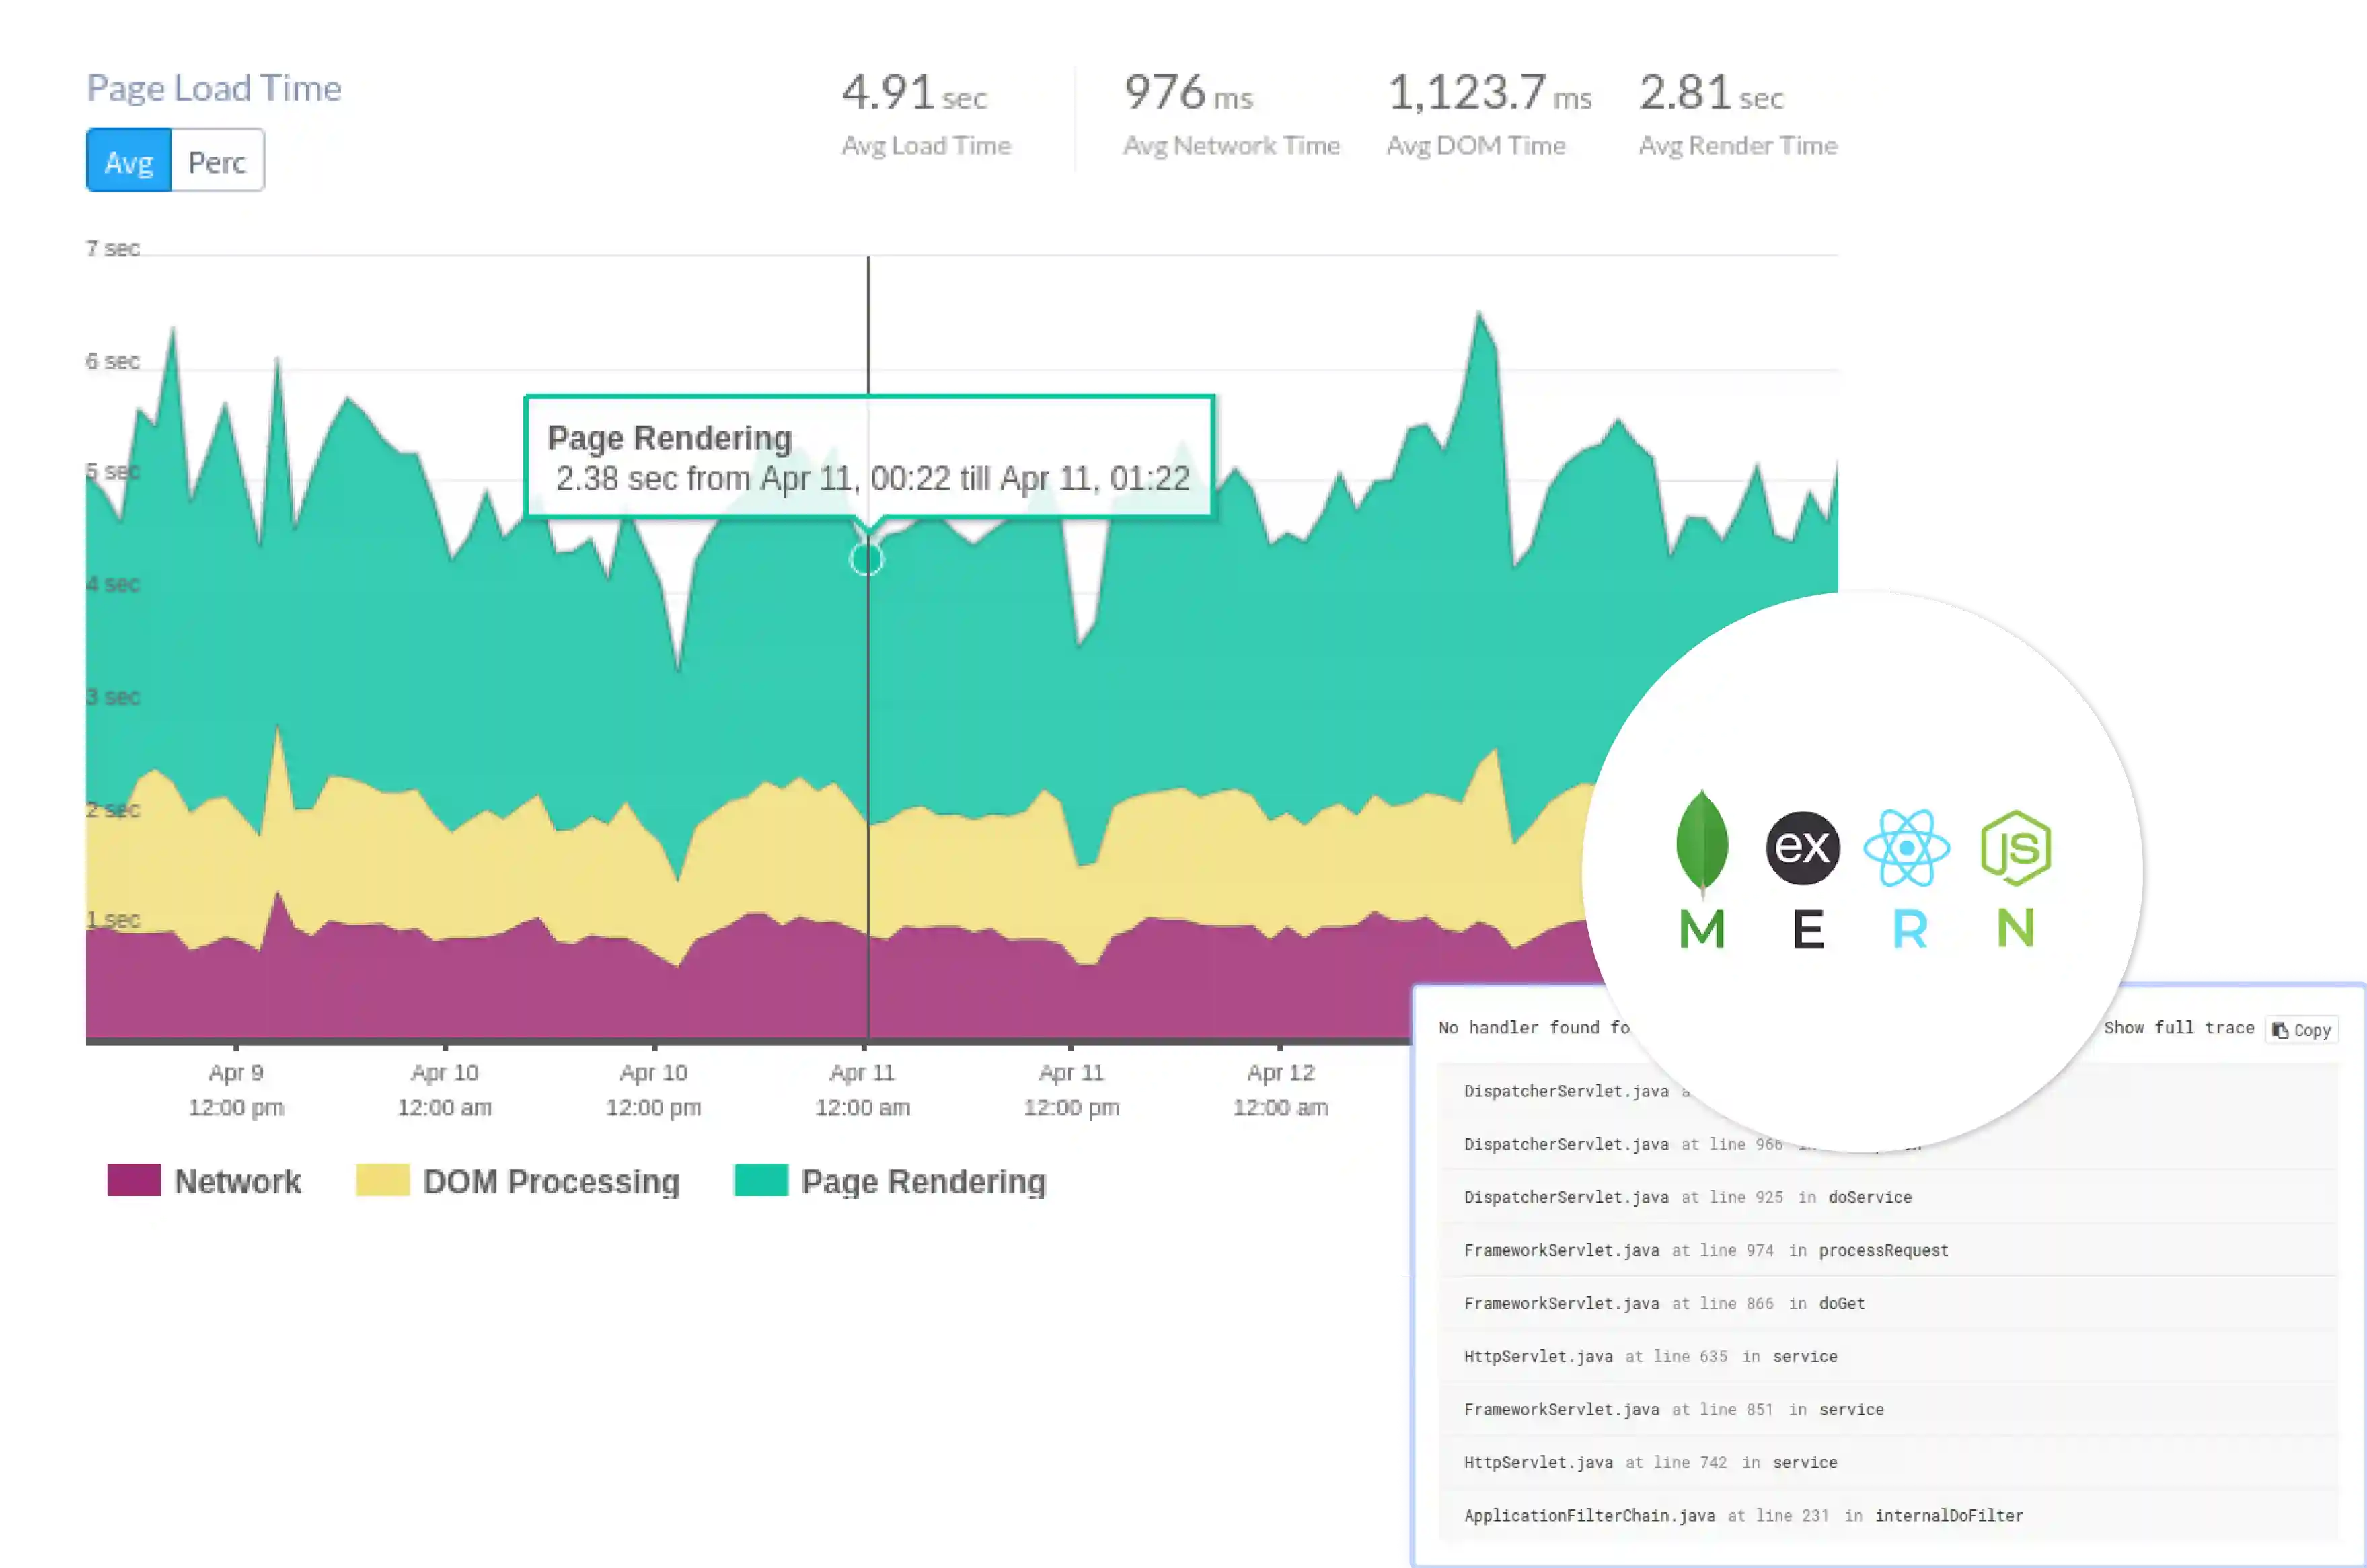
Measures the time it takes for the React app to load in the browser, including all static assets like HTML, CSS, and JavaScript files. This impacts user experience directly.
Tracks the latency of internal or third-party API calls made by the backend (Node.js). This is important for apps that rely on external services for data.
Monitors the distribution of HTTP status codes (e.g., 200, 400, 500) to quickly identify and diagnose any issues related to bad client requests or server errors.
Identifies slow-running transactions across the entire stack (Node.js, MongoDB, React) and pinpoints the bottlenecks, whether they are due to slow database queries, inefficient backend code, or rendering delays in the front end.
Tracks specific user actions (such as clicks form submissions) or custom events in the React frontend. This is useful for understanding how users interact with the app and identifying potential friction points.
Monitors network errors such as failed requests, DNS issues, or timeout errors in both frontend (React) and backend (Node.js). Identifies connectivity issues between client and server.
Tracks the health and usage of MongoDB connection pools, helping optimize database connections and reduce connection-related errors.
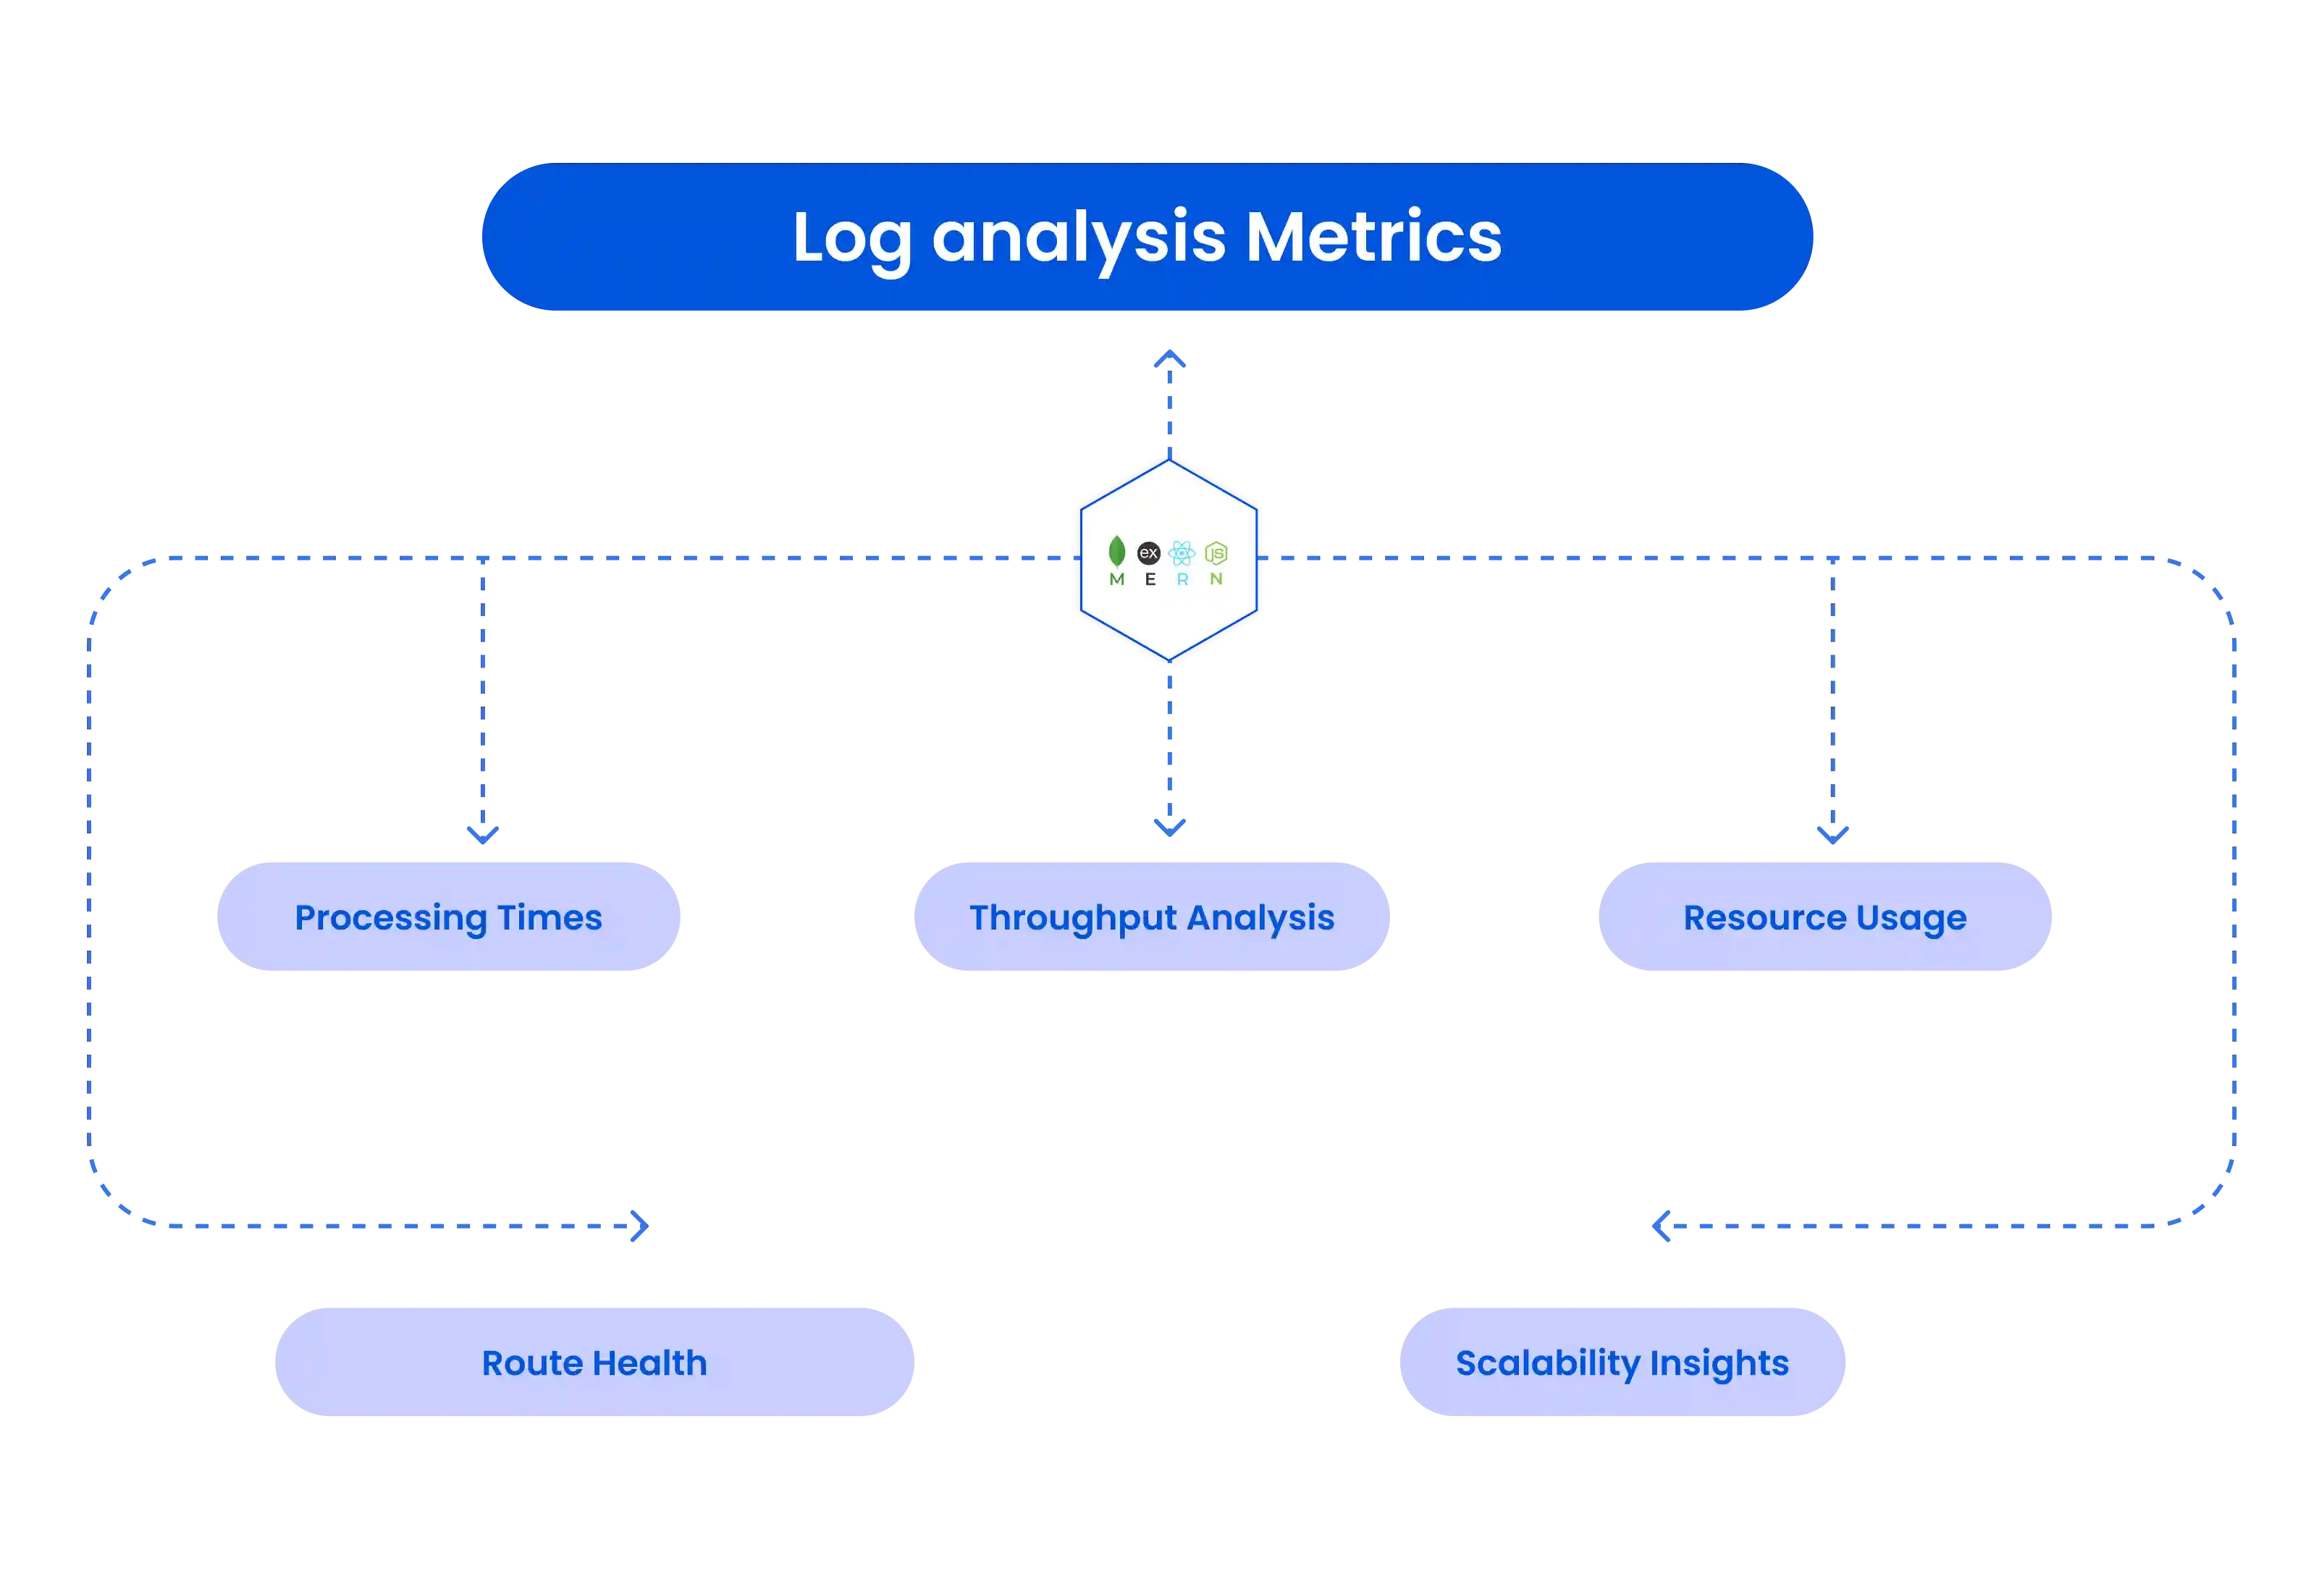
Monitors how different Express routes perform in terms of response time and throughput, helping identify slow or inefficient endpoints.
MERN Stack Monitoring delivers real-time insights across your entire application—tracking React load times, Node.js API performance, and MongoDB query efficiency. It helps detect frontend errors, backend bottlenecks, and database slowdowns, all in one place.
With Atatus, gain end-to-end visibility into your MERN stack by monitoring ReactJS (frontend), Node.js (backend), MongoDB (database), and Express (API). This helps you troubleshoot issues in real time by correlating data across every layer of the stack in a single dashboard.
MERN stack monitoring identifies slow database queries, unoptimized API routes, and heavy frontend assets. Atatus helps you pinpoint bottlenecks and optimize each component of your stack to boost the overall performance of your app.
Ensure a seamless user experience by detecting JavaScript errors in React, server crashes in Node.js, or MongoDB query failures before they impact your users. With Atatus’s MERN Stack Monitoring, stay ahead by catching and resolving issues early.
As your application scales, monitoring its performance becomes critical. Atatus helps track request throughput, CPU usage, memory consumption, and MongoDB performance, ensuring your app scales efficiently without performance degradation.
Monitor how real users interact with your ReactJS frontend, tracking page load times, interaction delays, and JavaScript errors. With real user monitoring, optimize the client-side experience for a faster, more responsive application.
Atatus’s MERN Stack Monitoring provides easy-to-understand, actionable insights by analyzing vast amounts of performance data across your app. Spend less time sifting through logs and more time focusing on enhancing your app’s performance and reliability.
MERN Stack is a popular web development stack consisting of four key technologies: MongoDB (NoSQL database), Express.js (backend web framework), React (frontend JavaScript library), and Node.js (server-side JavaScript runtime). Together, they provide a full-stack solution for building dynamic web applications, enabling developers to work seamlessly across the frontend and backend using JavaScript.
Key metrics include MongoDB query performance, Node.js CPU and memory usage, React page load times, API response times, error rates, and real user interactions. These metrics help you monitor the entire stack from frontend to backend and database.
Yes, with Atatus you can monitor the frontend (React) and backend (Node.js, Express) separately. You can track frontend load times, errors, and user interactions, while also monitoring backend API response times, server health, and MongoDB performance.
Yes, Atatus supports real-time alerts for performance issues, errors, and other critical metrics. You can configure alerts for specific conditions, ensuring that you are notified immediately if something goes wrong in your MERN stack application.
Atatus can detect a wide range of errors, including JavaScript errors in React, API failures in Node.js, slow or failed database queries in MongoDB, and server-side exceptions. It helps you quickly identify and resolve these issues.
Avail Atatus features for 14 days free-trial. No credit card required. Instant set-up.