Laravel

Unlock the full potential of your Laravel applications by actively monitoring performance metrics with the Atatus PHP agent. Track Laravel performance in real-time, optimize PHP Laravel efficiency and swiftly address issues to enhance user experience.

Sign Up for Free

Laravel PHP Monitoring

Essential Metrics for Laravel PHP Monitoring

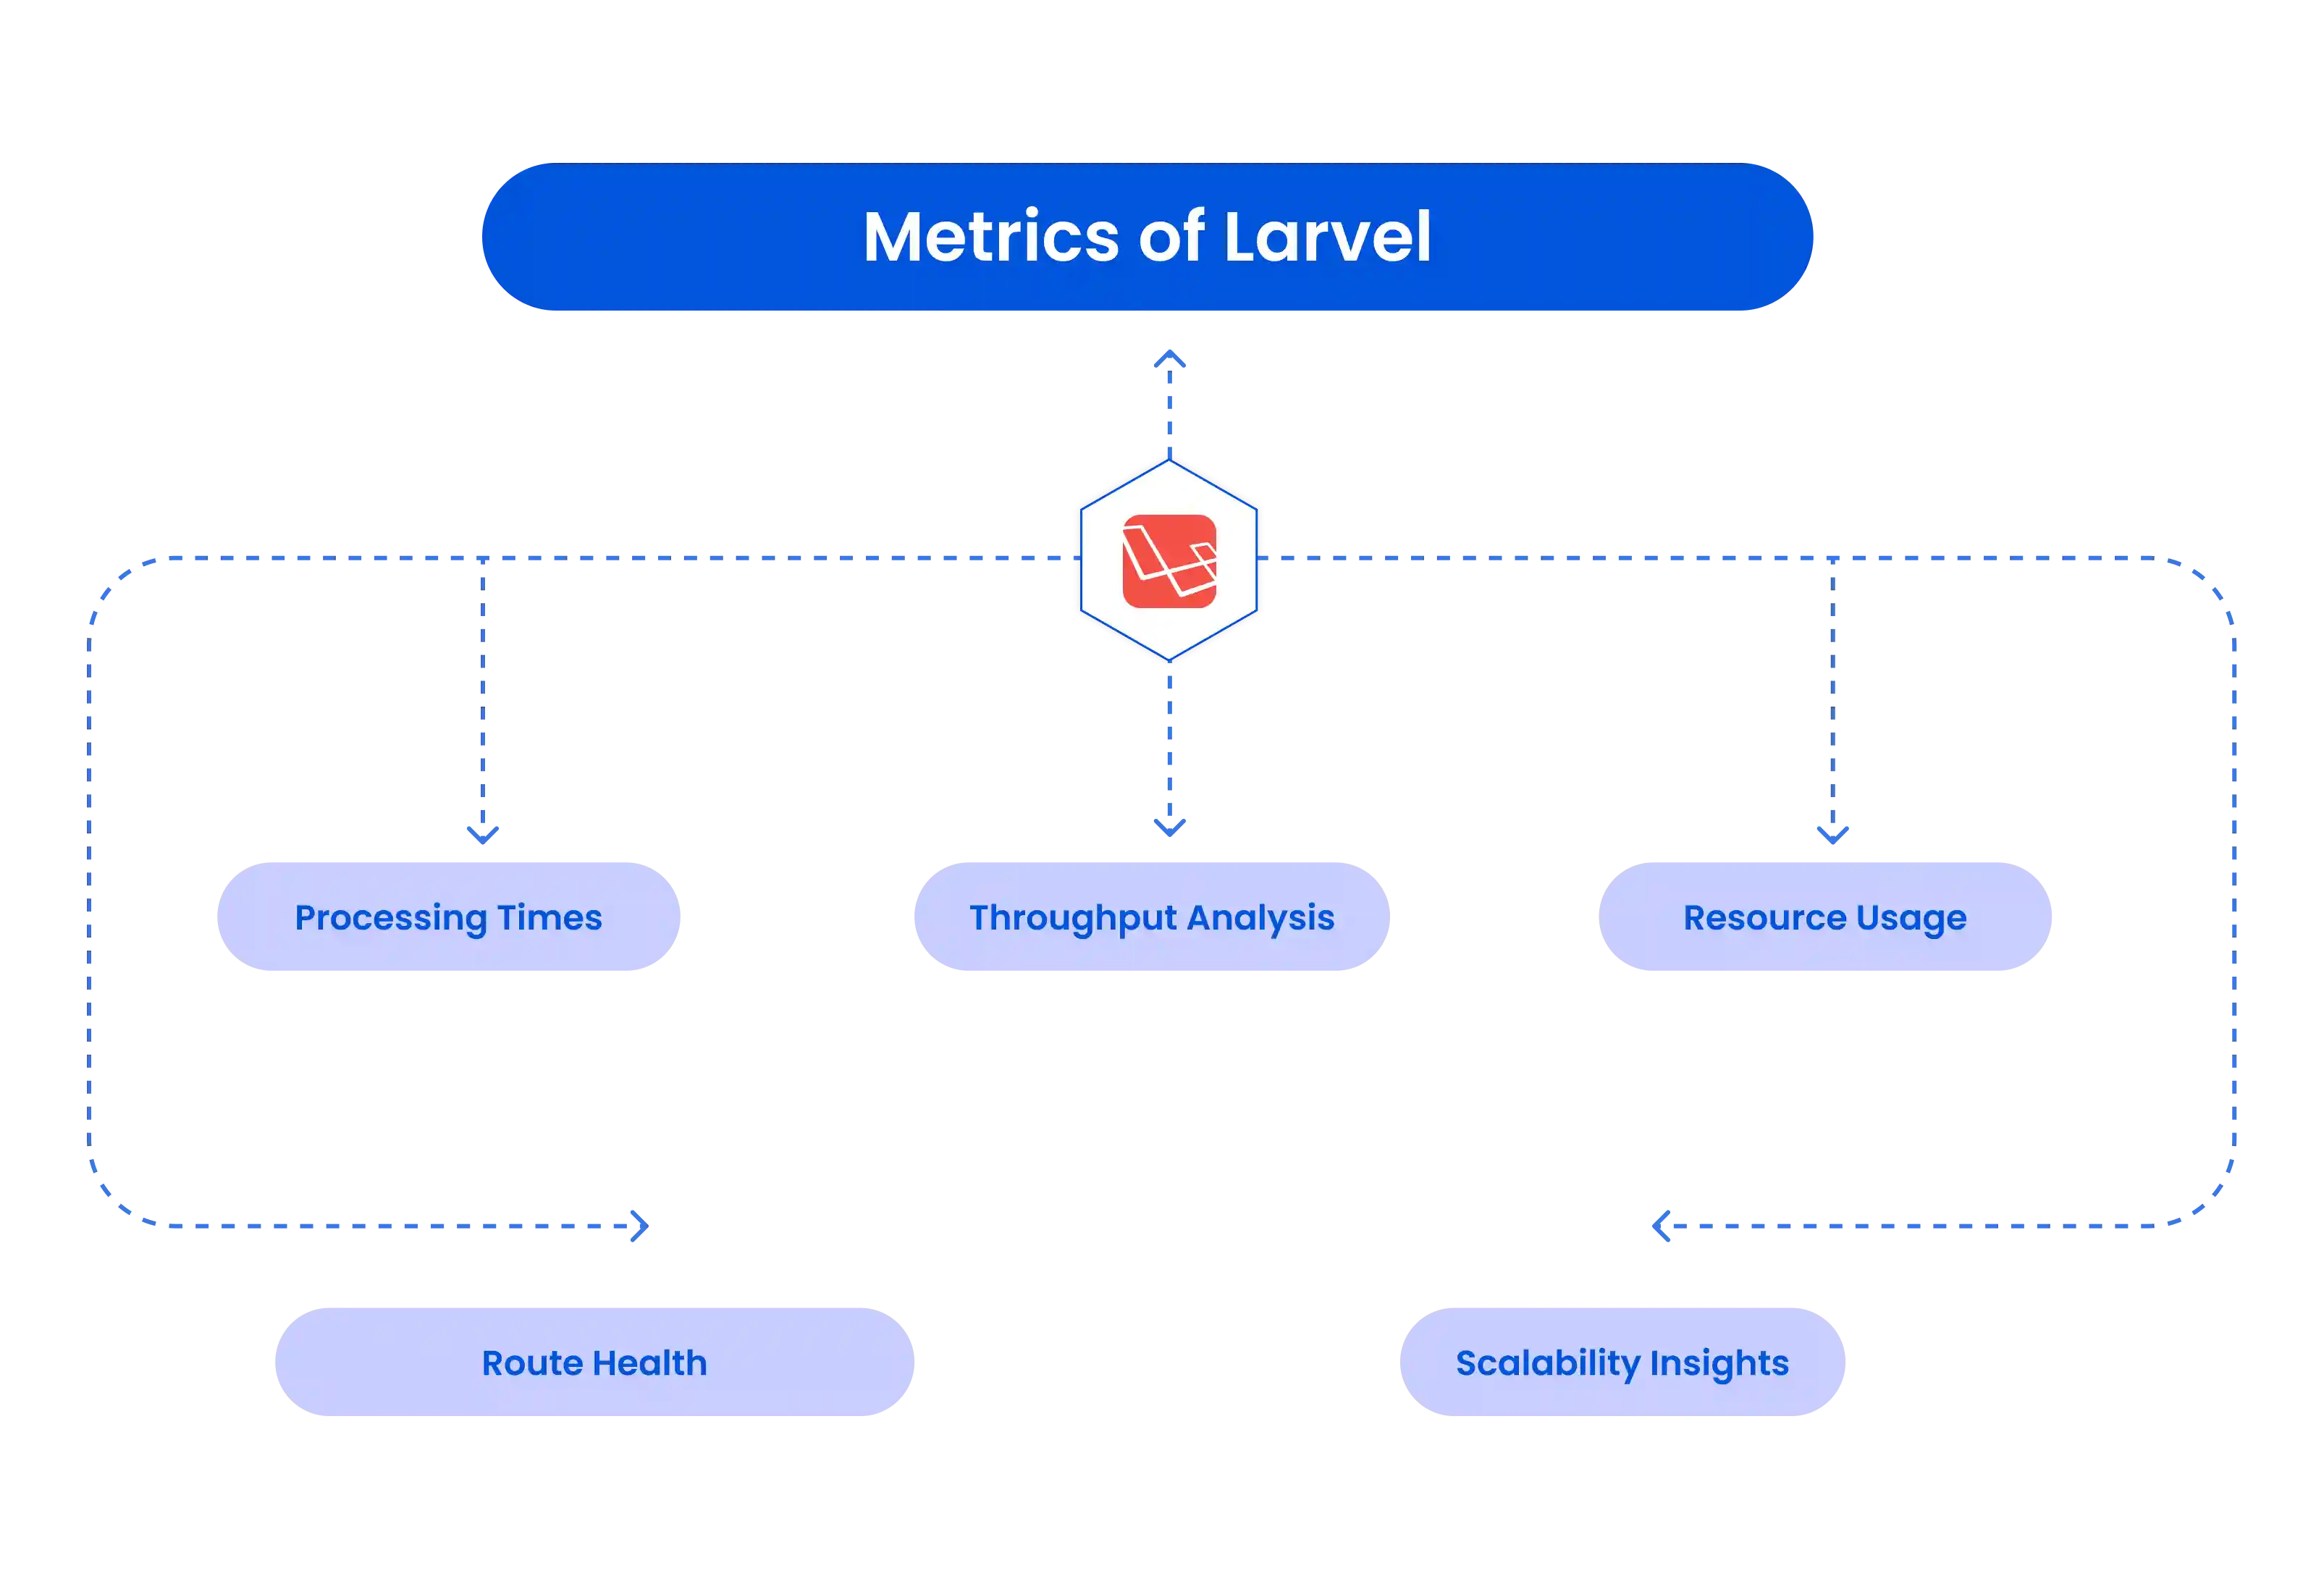
Monitor these key metrics to ensure your Laravel applications perform efficiently and securely, allowing you to identify potential issues before they affect your application's performance and user experience.

Request Duration

Request Duration

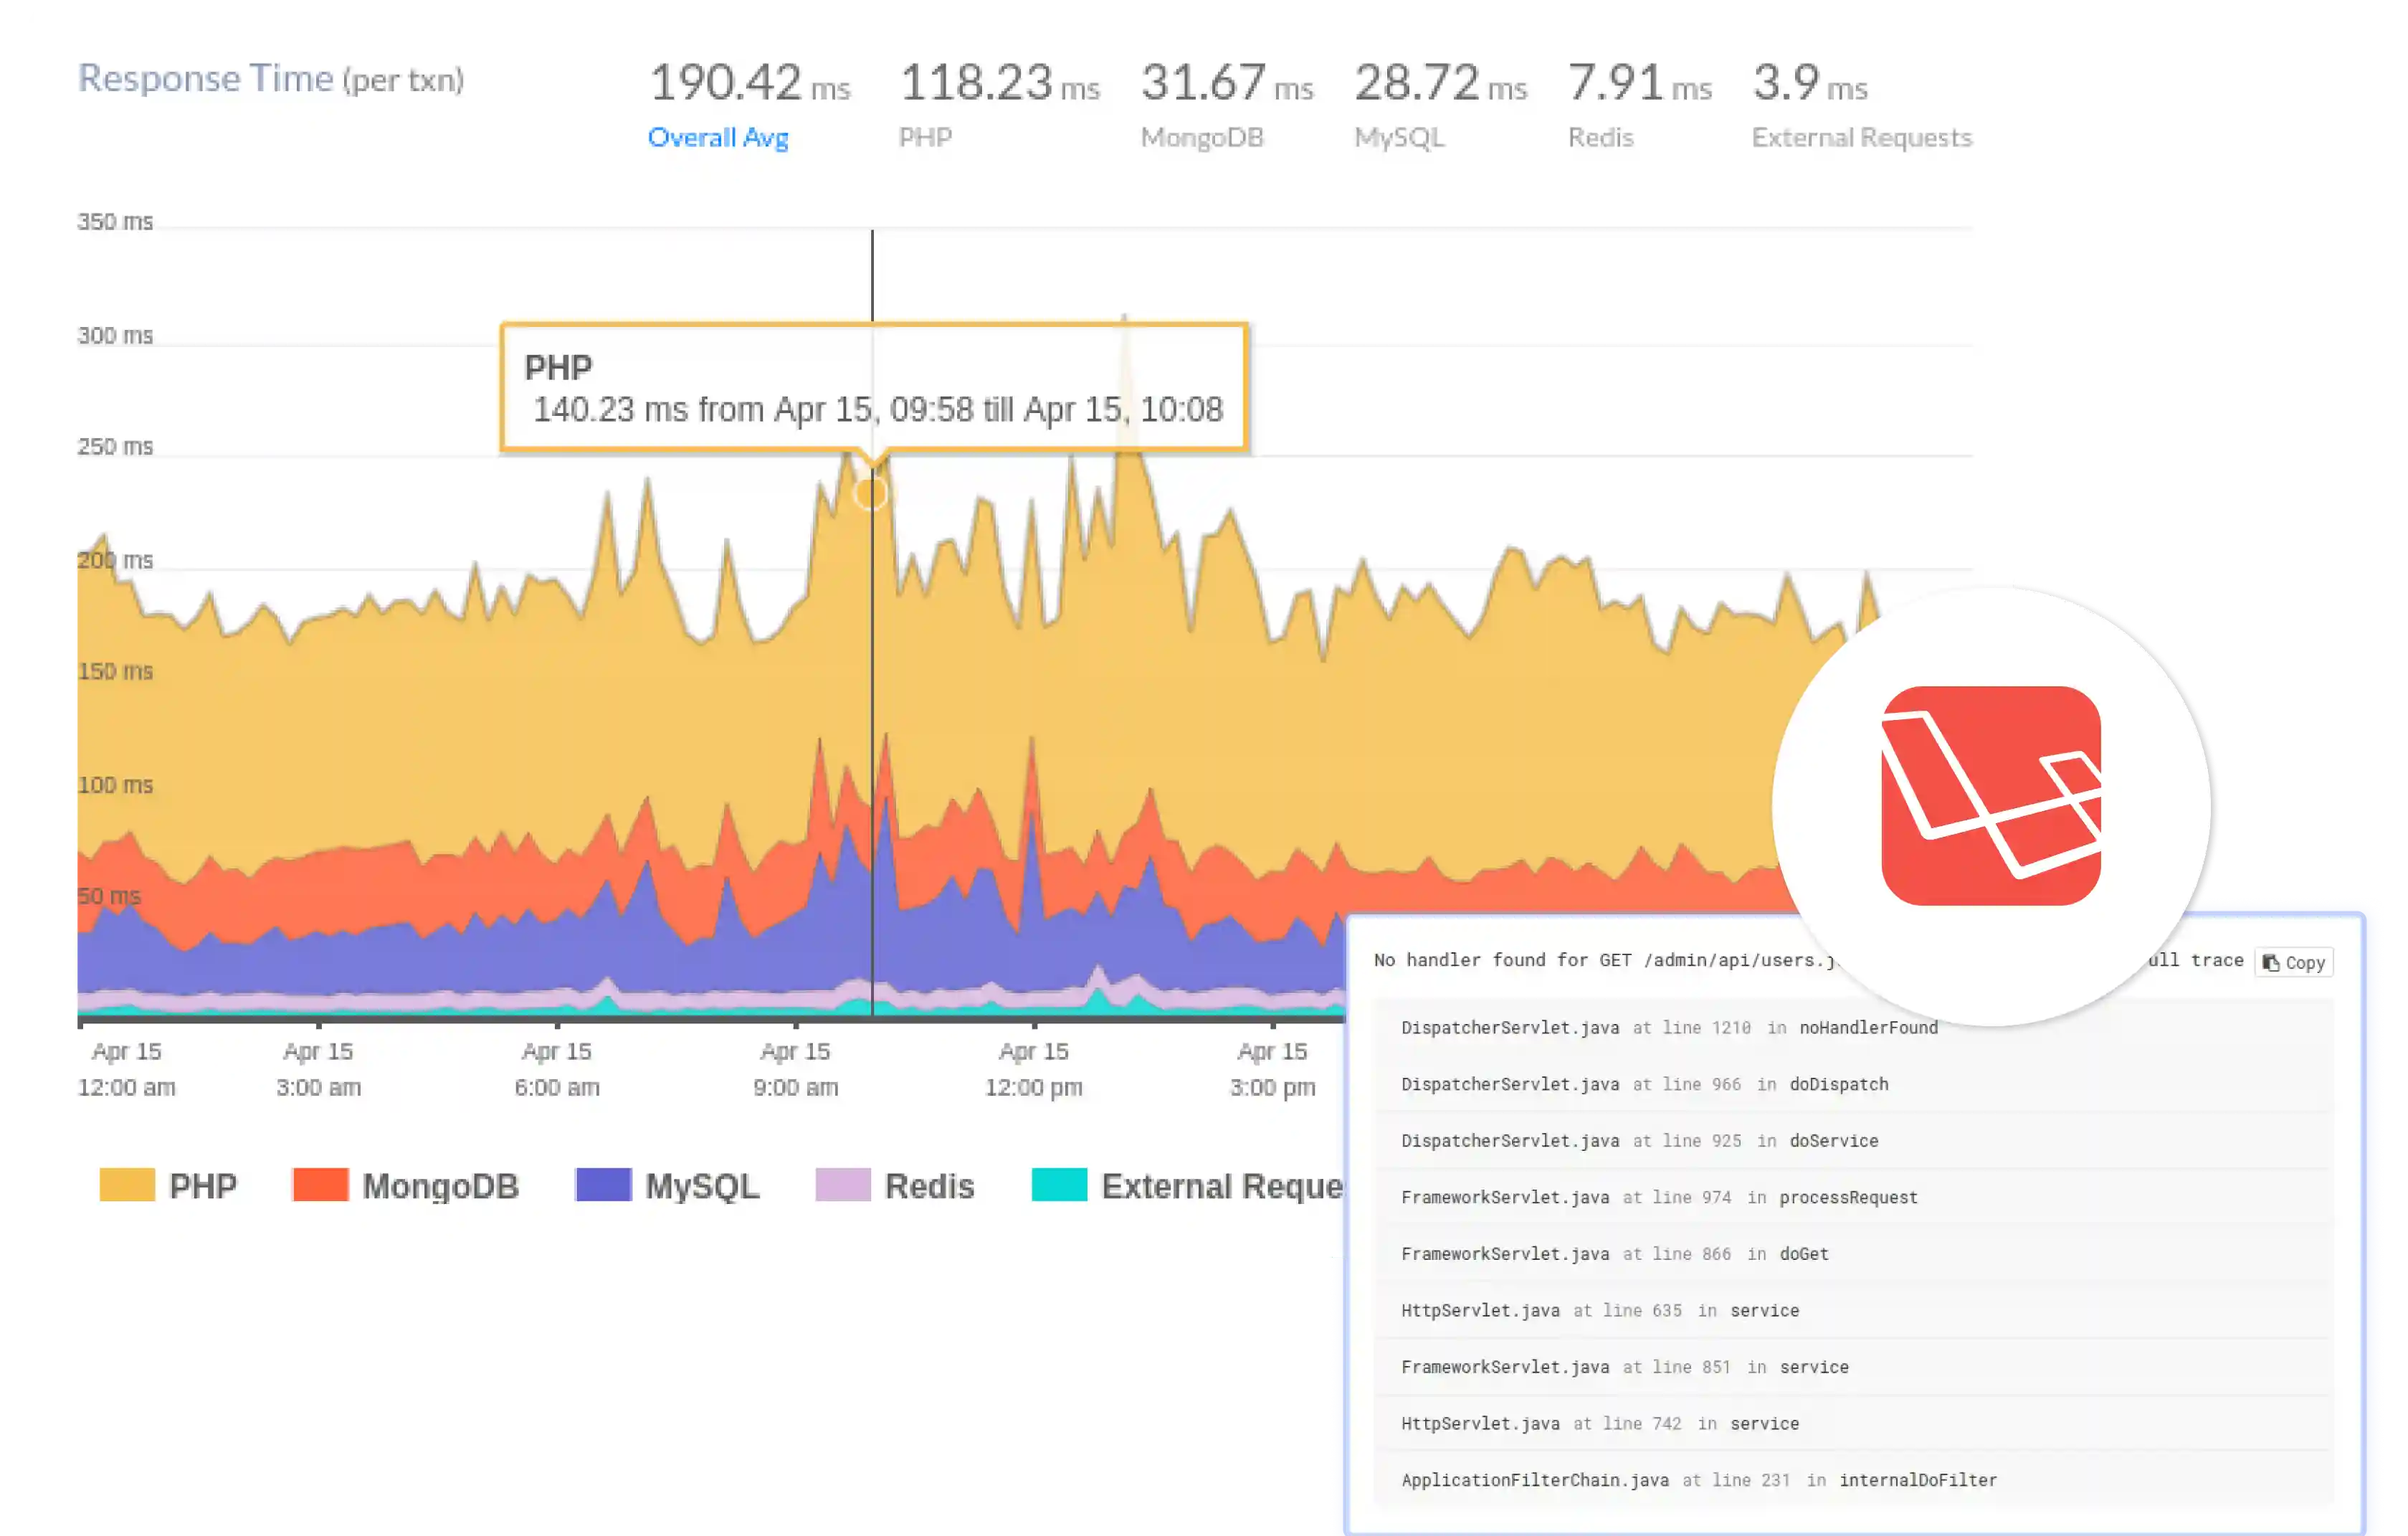
Measure the time taken for each request to complete, allowing you to identify slow routes and optimize them for better performance.

Database Query Performance

Database Query Performance

Monitor the execution time of database queries to pinpoint inefficient queries and optimize your database interactions.

Exception Rate

Exception Rate

Track the frequency of exceptions thrown in your application, helping you identify and resolve recurring issues that may affect user experience.

Route Performance

Route Performance

Analyze the performance of individual routes to understand which ones are causing bottlenecks or experiencing high traffic.

Cache Hit Rate

Cache Hit Rate

Measure the effectiveness of your caching strategy by monitoring the ratio of cache hits to misses, allowing you to adjust cache configurations for optimal performance.

Database Query Performance

Job Processing Time

Monitor the execution time of background jobs and queued tasks, helping you identify any delays in processing and ensuring your application handles workloads efficiently.

Why Laravel Monitoring Matters?

Laravel monitoring is essential as it provides in-depth visibility into application performance and user interactions. With the Atatus PHP agent, you can precisely identify performance bottlenecks, optimize database queries, and track exception rates in real-time.

Uncover Performance Bottlenecks

With Atatus Laravel monitoring, you can easily identify and analyze performance bottlenecks within your application. By tracking request durations and response times, you can pinpoint slow routes and optimize them for faster load times, ensuring a smoother experience for your users.

Laravel PHP Scalability

Optimize Database Interactions

Laravel applications often rely heavily on database queries, and inefficient queries can significantly impact performance. Atatus enables you to monitor database query performance, helping you detect slow queries and optimize your database interactions. This leads to reduced latency and improved overall application responsiveness.

Laravel Database Interactions

Gain Visibility into Errors and Exceptions

Understanding the health of your application is crucial, and Atatus provides detailed insights into errors and exceptions in your Laravel app. By tracking exception rates, you can identify recurring issues and take corrective action before they affect your users, ensuring a more stable and reliable application.

Laravel Perforamnce

Enhance User Experience with Real-Time Monitoring

Real-time monitoring is vital for maintaining a high-quality user experience. With Atatus, you can monitor user interactions and application performance metrics continuously. This allows your team to respond quickly to any issues, making necessary adjustments to keep your Laravel application running smoothly and efficiently.

Laravel User Experience

FAQs for Laravel PHP Monitoring

What is Laravel PHP monitoring?

Laravel PHP monitoring involves tracking the performance and health of Laravel applications using monitoring tools like Atatus. It provides insights into key metrics such as request duration, database query performance, and error rates to ensure optimal application functionality.

Can I monitor my Laravel application’s database queries?

Yes, Atatus allows you to monitor database queries in your Laravel application. You can track the execution time of individual queries, identify slow queries, and optimize your database interactions to improve overall performance.

How can real-time monitoring benefit my Laravel application?

Real-time monitoring enables you to swiftly identify and resolve performance issues as they occur. This proactive approach minimizes downtime, enhances application reliability, and ultimately leads to improved user satisfaction and retention.

Is there an easy way to integrate Atatus with my Laravel application?

Yes, integrating Atatus with your Laravel application is straightforward. You can install the Atatus PHP agent via Composer and follow the setup instructions provided in the documentation to start monitoring your application quickly.

What types of alerts can I set up with Laravel monitoring?

With Atatus, you can set up various alerts based on performance thresholds, error rates, and other key metrics. This ensures that your team is notified of any issues that require immediate attention, allowing for quick resolution.

Ready to see actionable data?

Avail Atatus features for 14 days free-trial. No credit card required. Instant set-up.