LAMP stack Monitoring
Atatus actively monitors the LAMP Stack, delivering real-time insights into Linux, Apache, MySQL, and PHP performance. By tracking key metrics across the entire stack, Atatus helps you optimize system performance and quickly identify bottlenecks to ensure your LAMP Stack runs efficiently.
Where LAMP production visibility fails
Request Handling Opacity
Apache request processing and PHP execution paths vary by configuration, making it difficult to confirm how requests actually flowed in production.
Incomplete Execution Context
Errors surface without sufficient runtime state, forcing engineers to infer request inputs, execution timing, and environment conditions.
Slow Root Diagnosis
Determining whether failures originate in application logic, database interaction, or server behavior takes longer as systems grow.
Database Attribution Gaps
Query behavior and connection usage vary under load, making it hard to associate latency with specific execution paths.
Hidden Network Dependencies
External services and internal calls degrade independently, often remaining invisible until user-facing impact becomes severe.
Noisy Error Signals
Logs and alerts lack correlation depth, pushing teams to chase symptoms instead of isolating root causes.
Unclear Scaling Effects
Increased traffic changes memory usage, process behavior, and query patterns in ways teams cannot easily observe.
Declining Operational Trust
Repeated blind debugging erodes confidence in production understanding, slowing response during critical incidents.
Complete Performance Visibility for
LAMP Stack Applications
Real-time observability for LAMP workloads that helps teams analyze web traffic, optimize PHP execution, and maintain reliable performance across Apache, MySQL, and backend services.
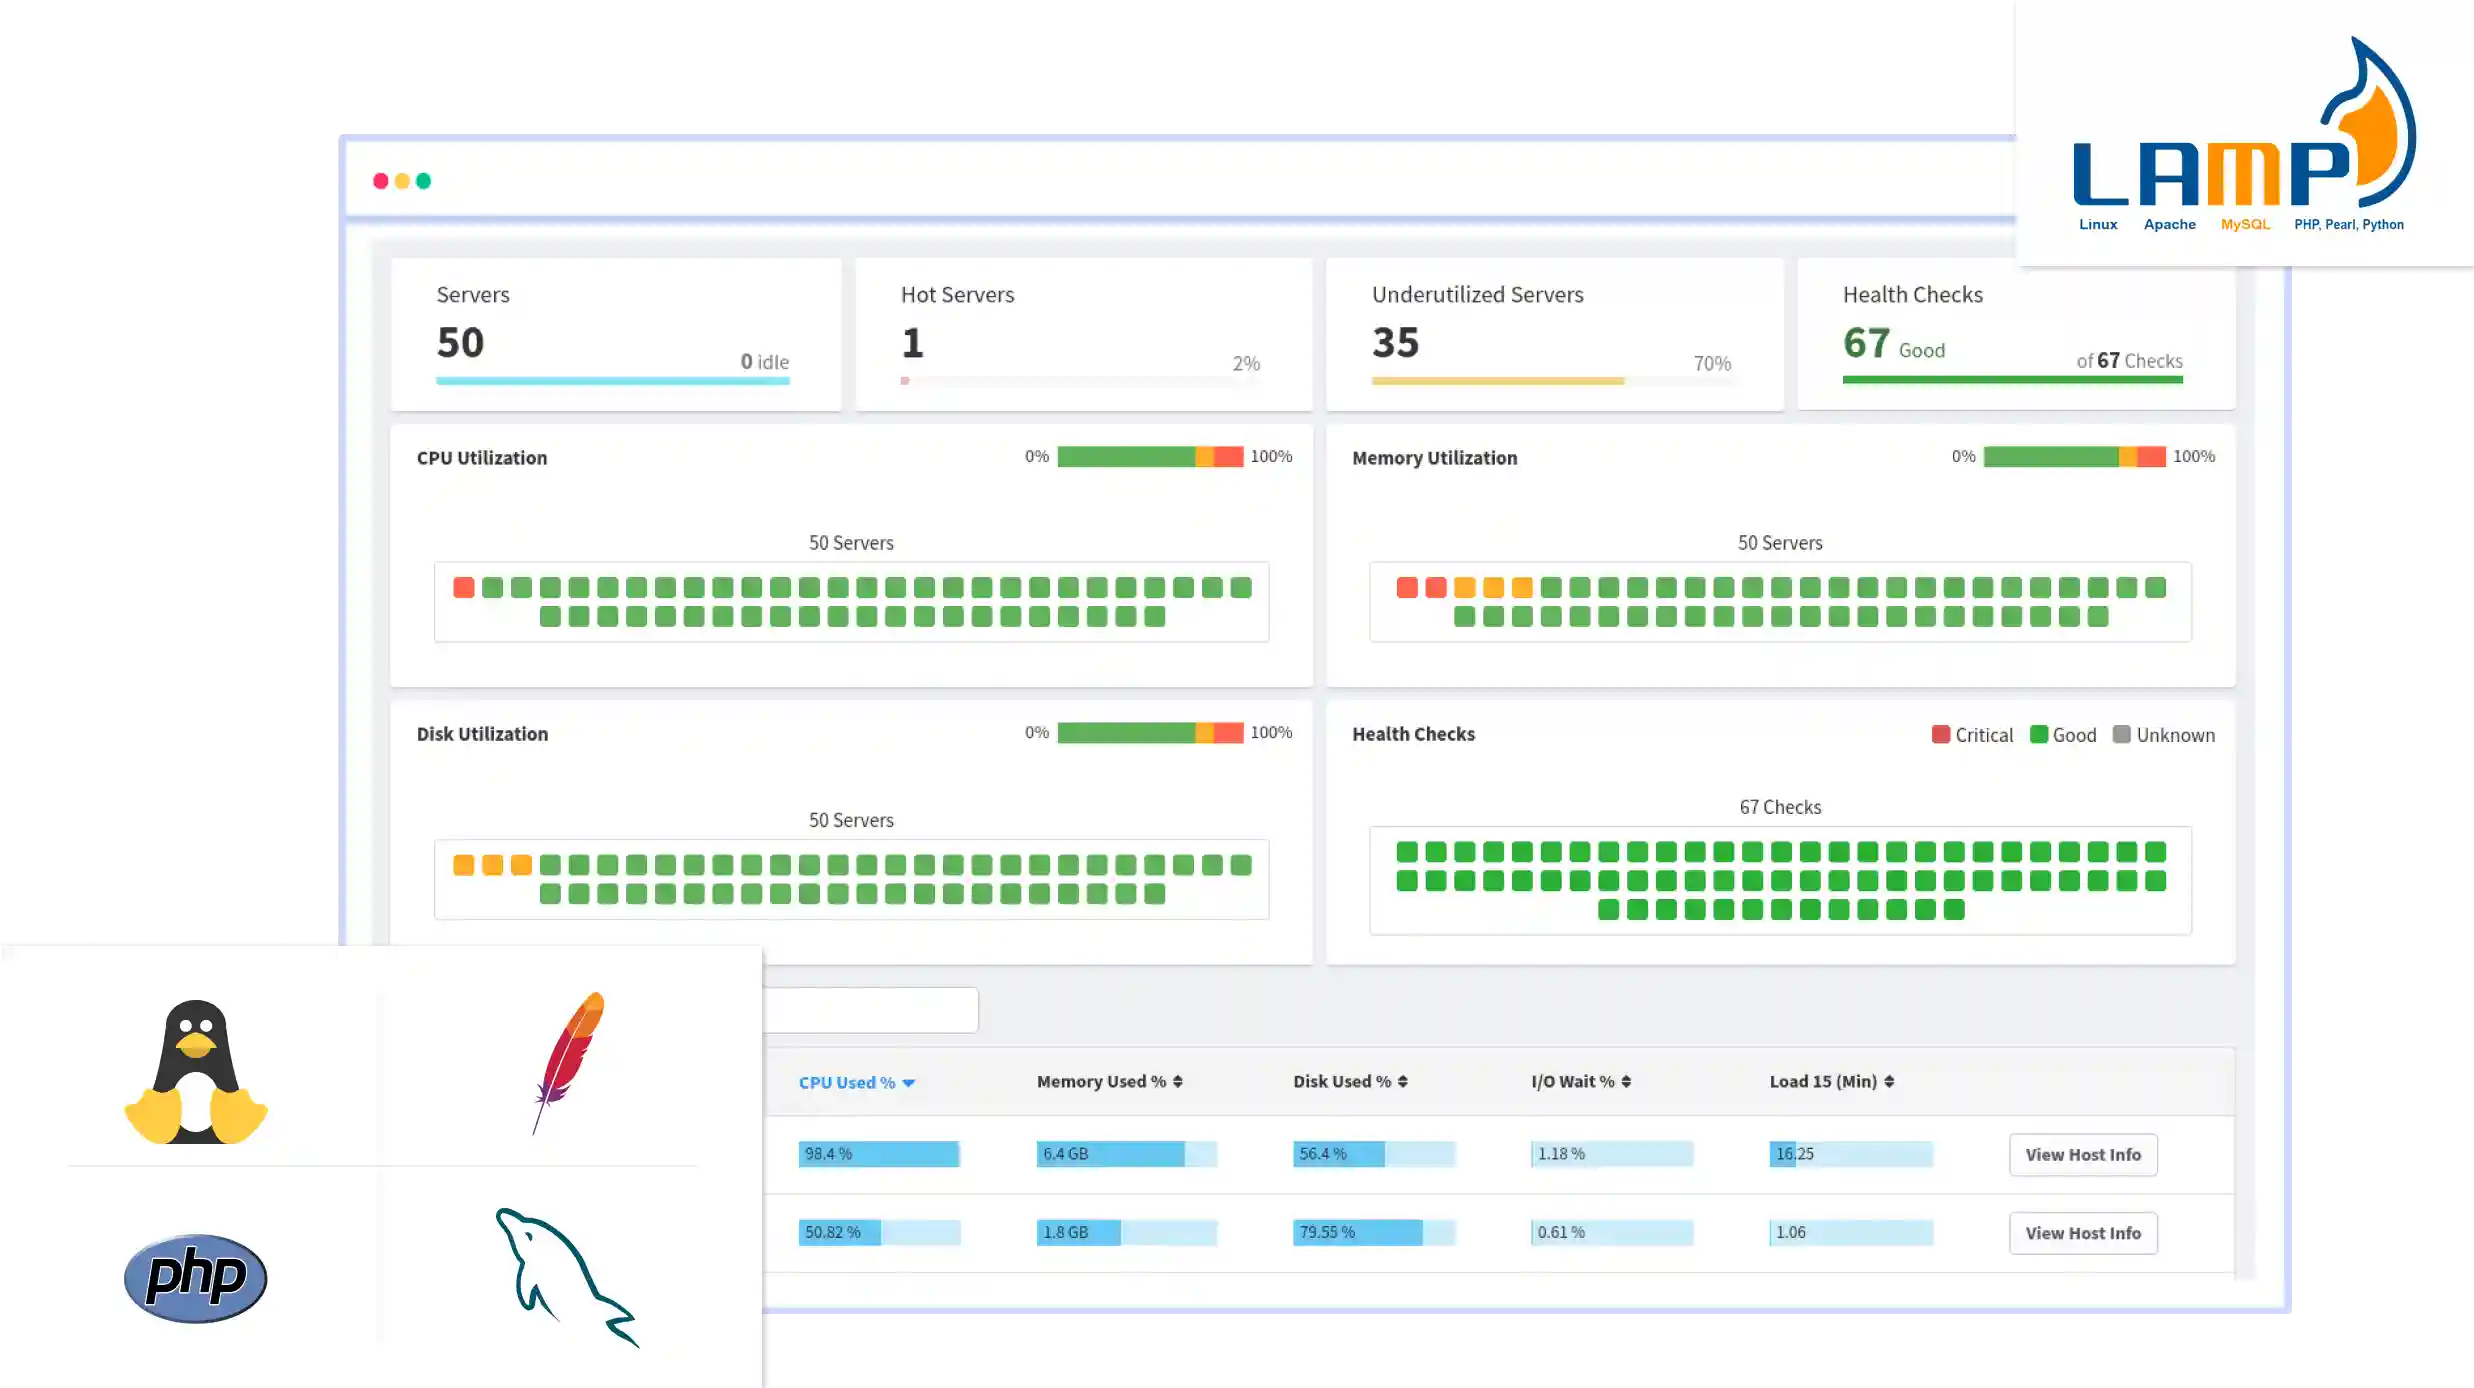
Apache Request Metrics
Track incoming request volume, response time, and error patterns across Apache servers. Quickly identify traffic spikes and slow responses.
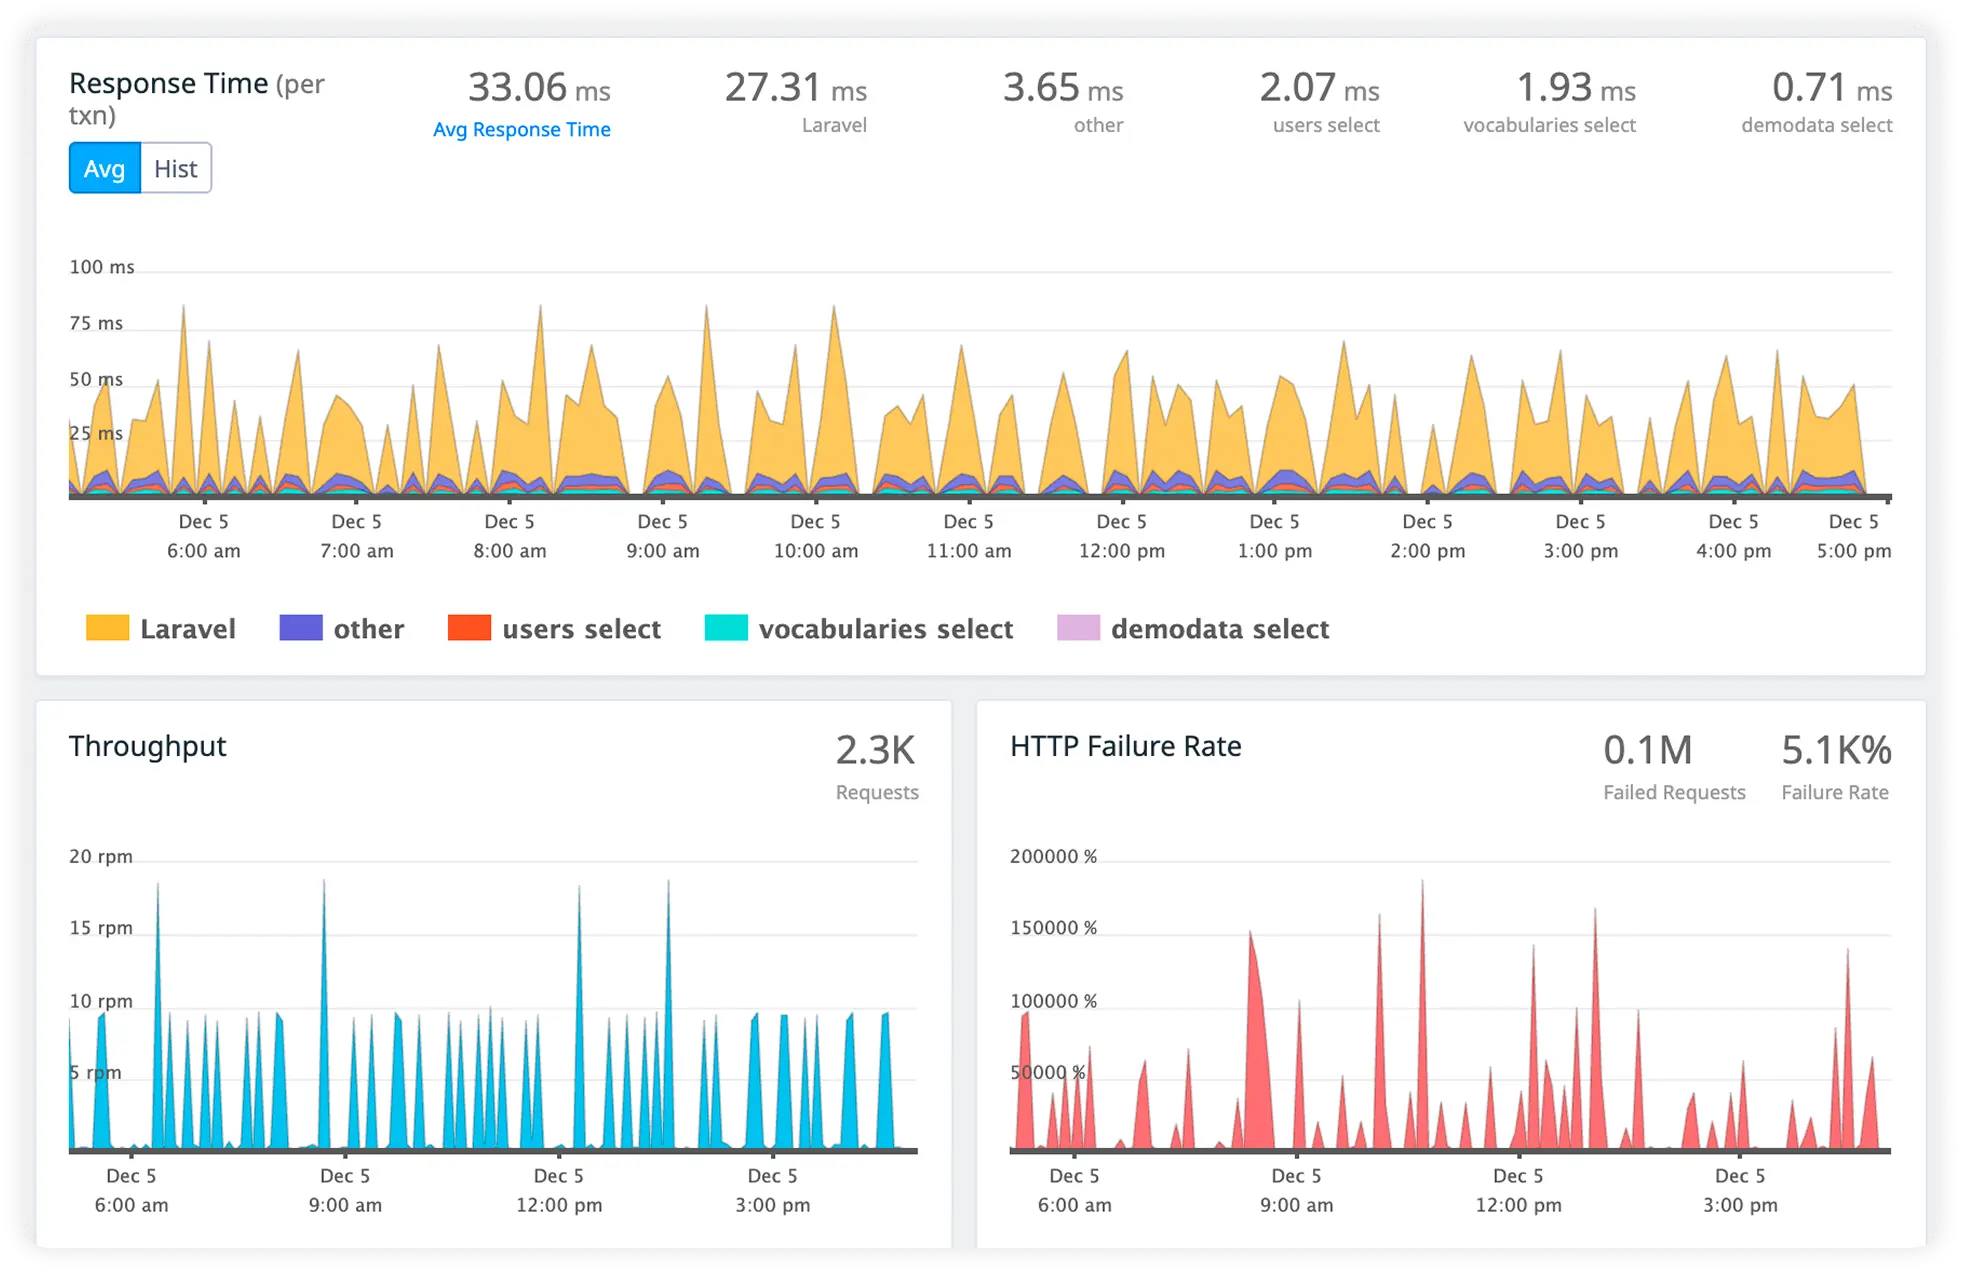
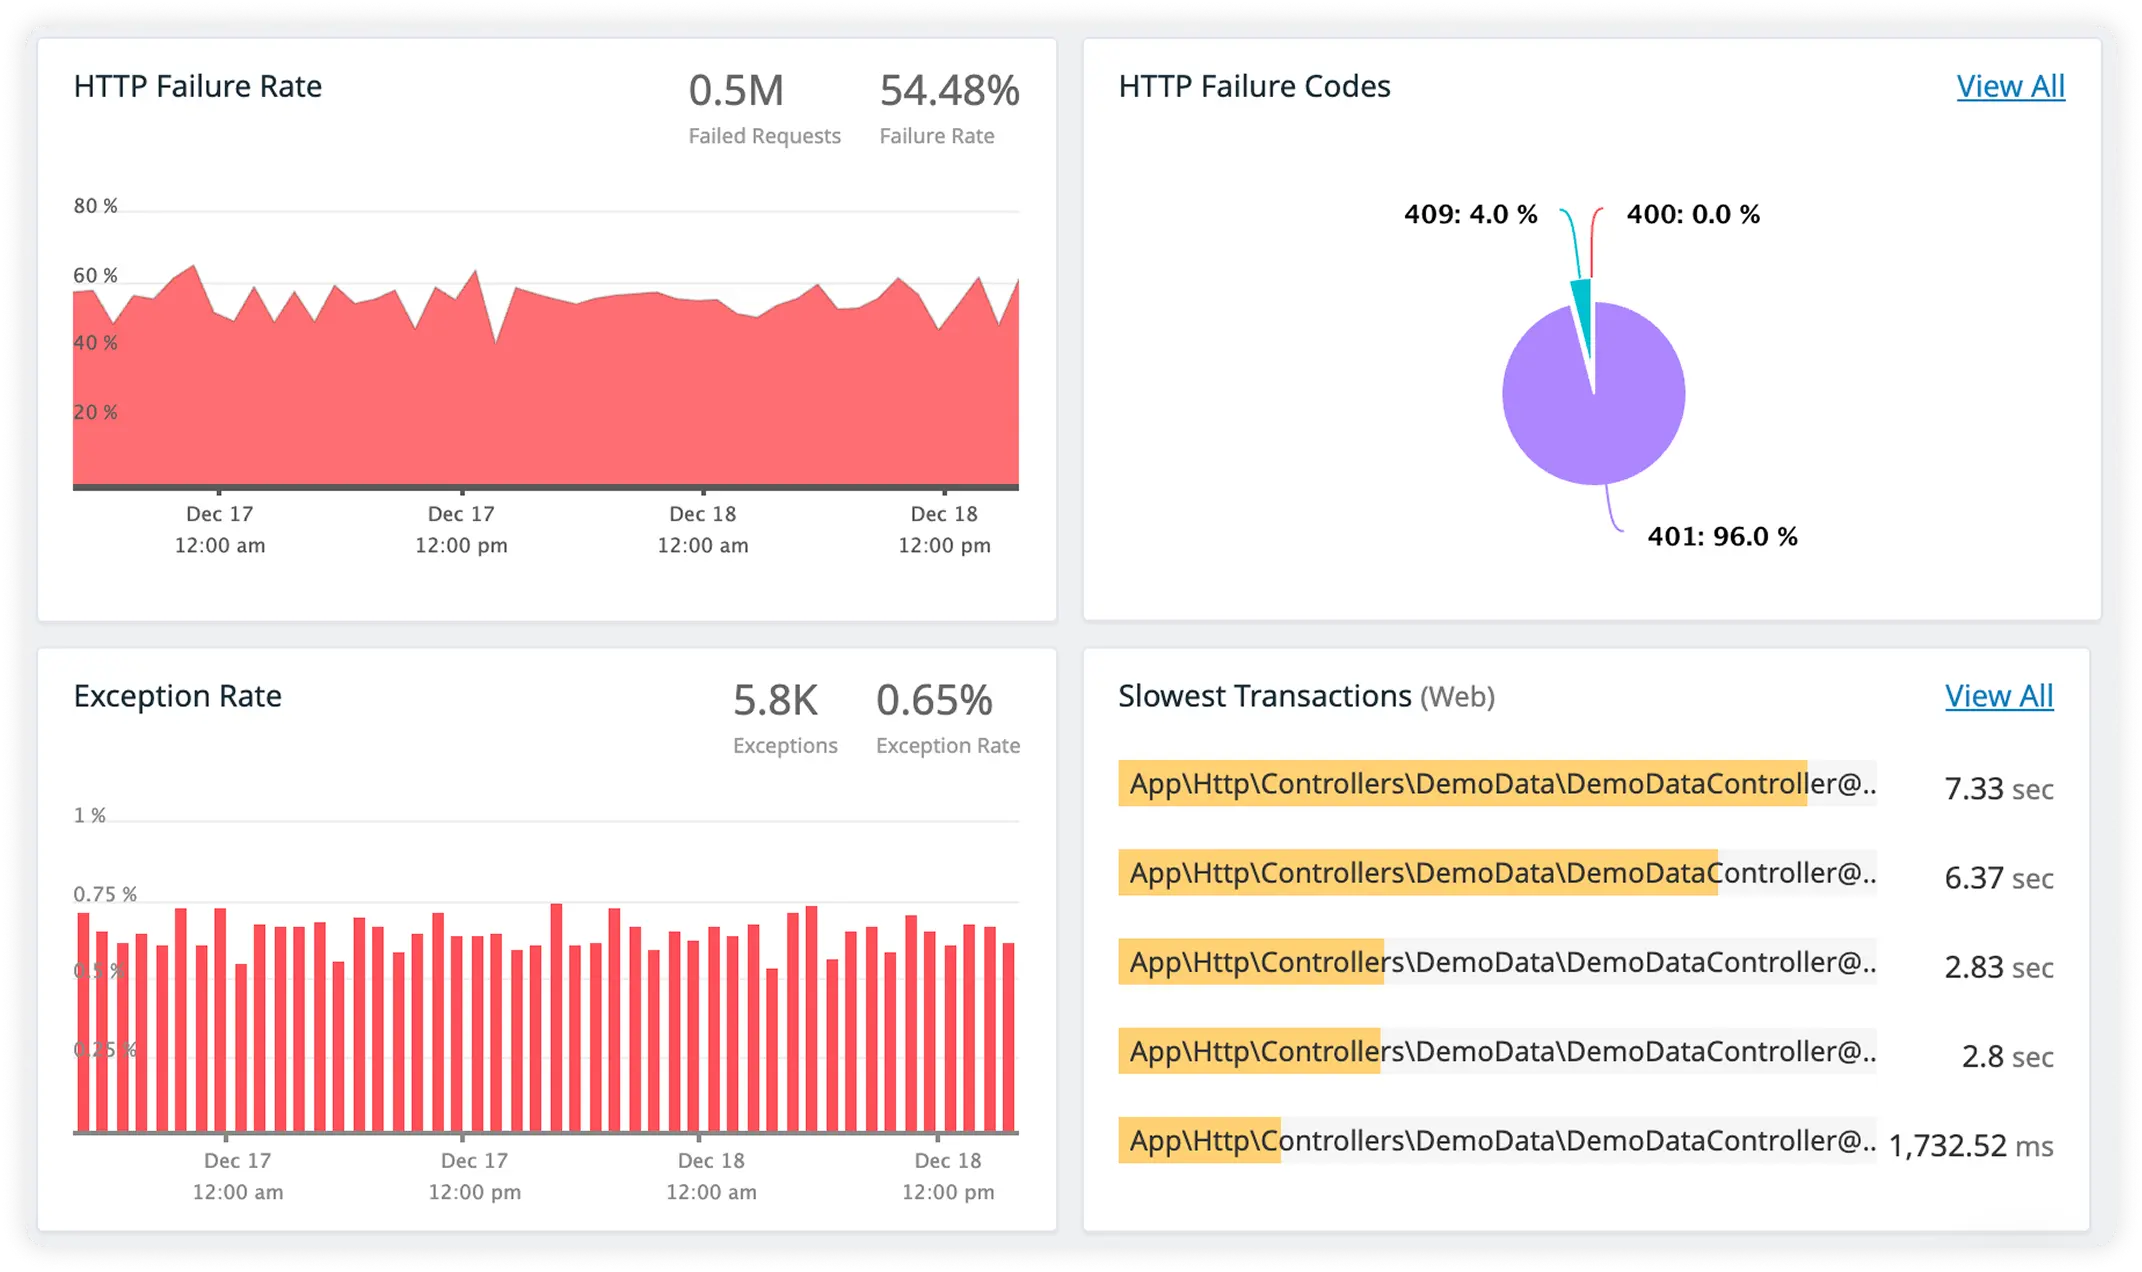
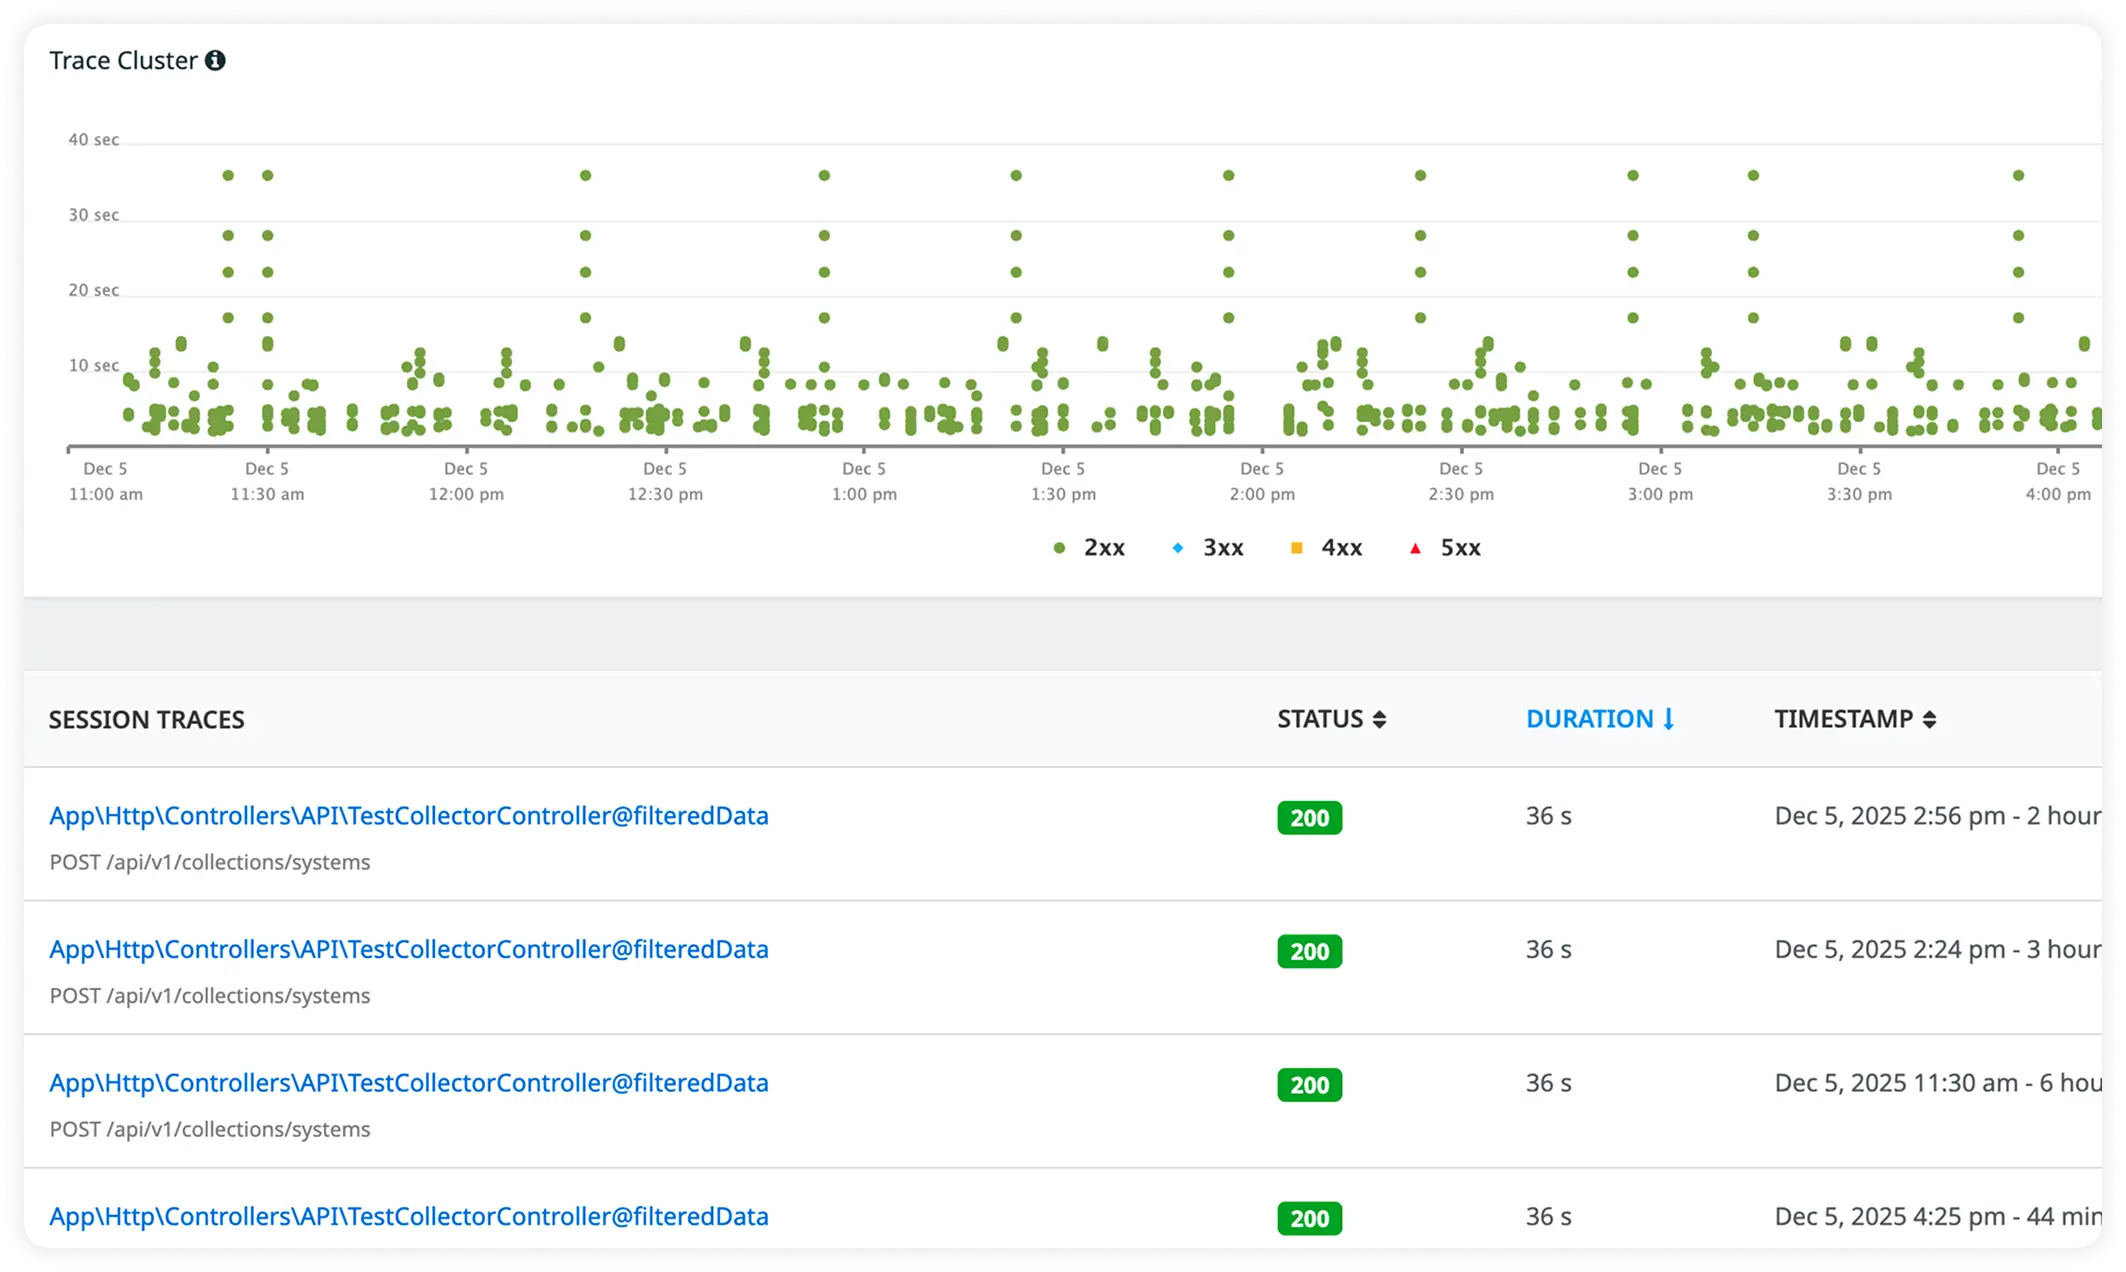
Response Timing
Monitor reponse time, throughput and http failure rate in real time. Pinpoint slow functions and performance bottlenecks.
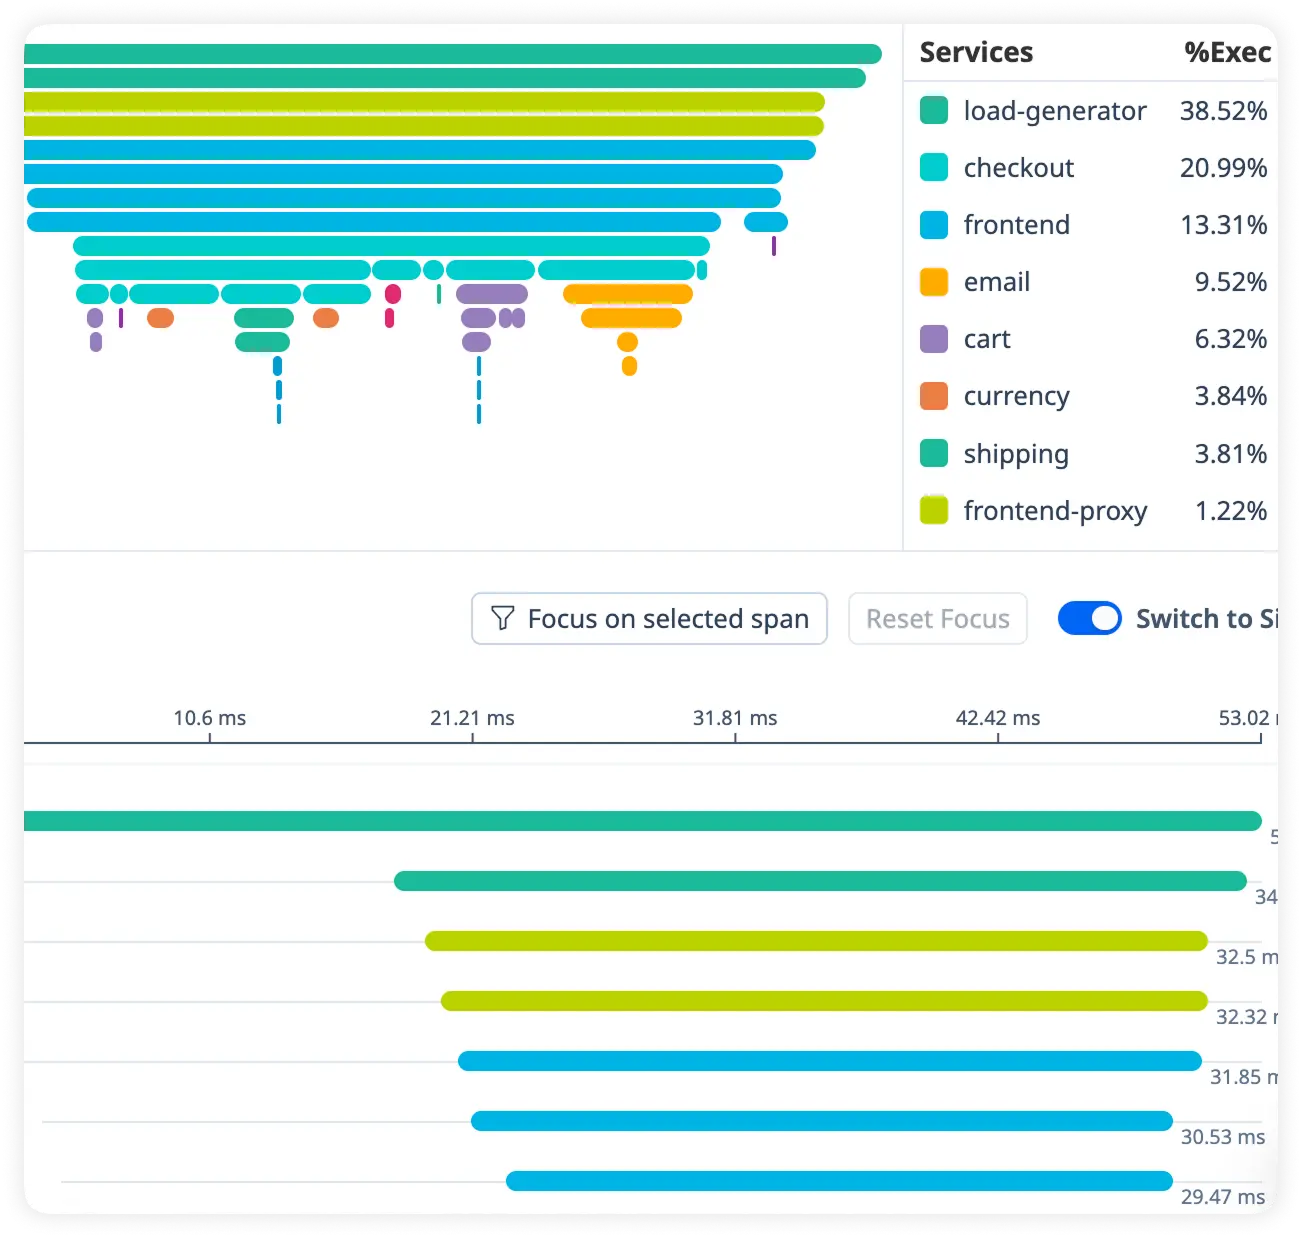
SQL Query Performance
Analyze database query execution time and load to eliminate inefficient SQL operations slowing your application.
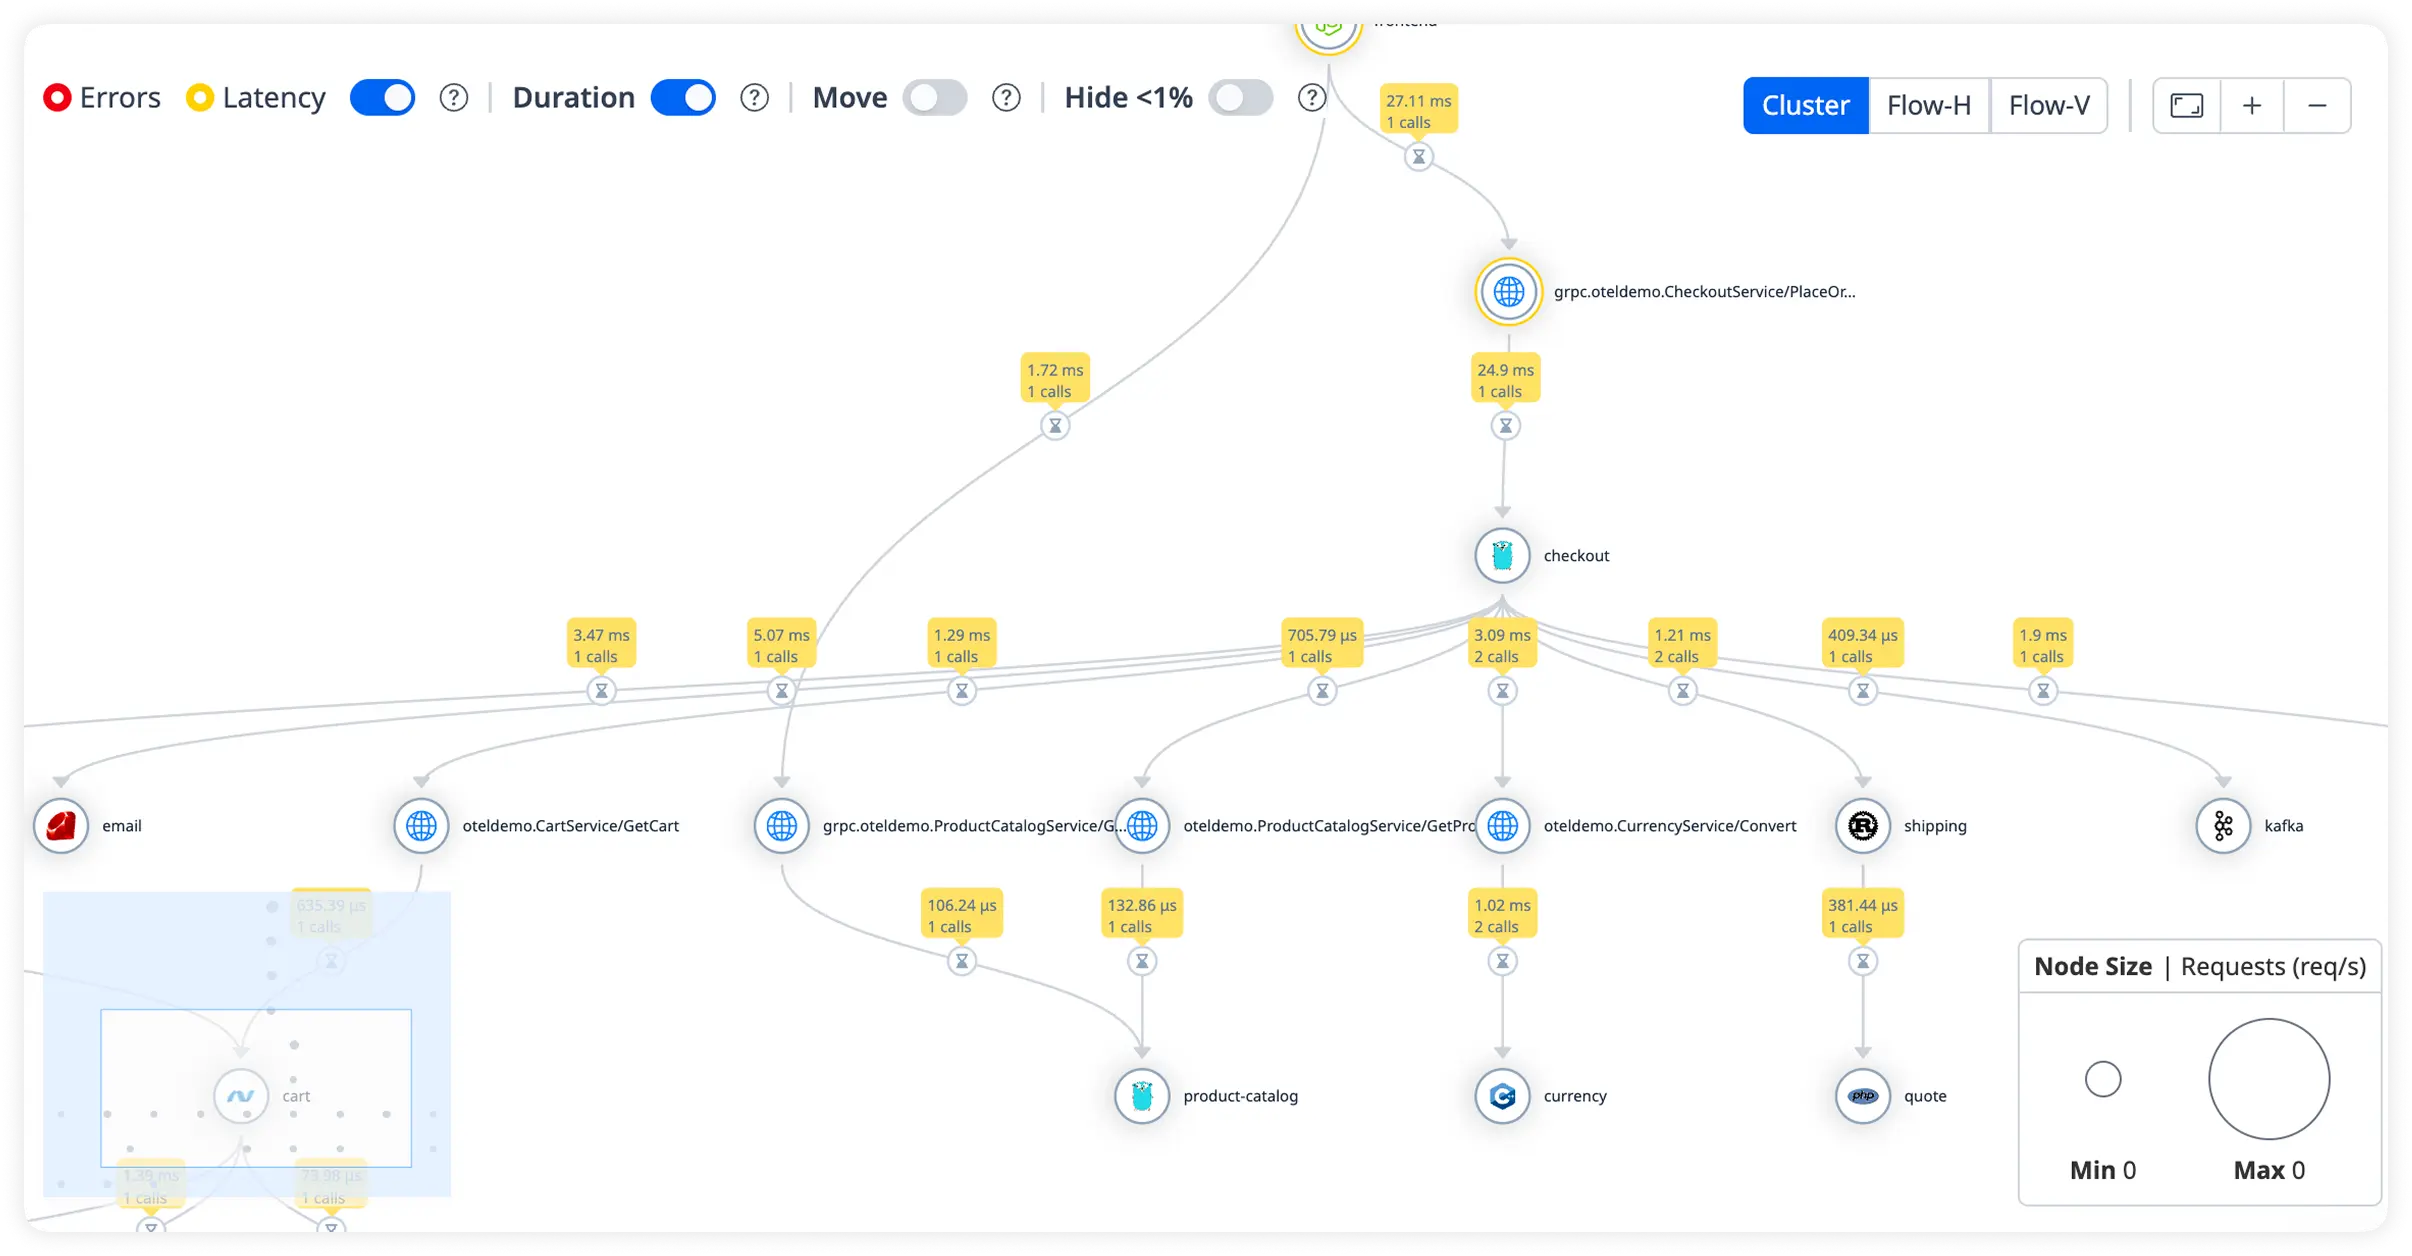
Throughput & Latency Trends with Host Resource Correlation
Monitor traffic flow and response trends while correlating performance with CPU and memory usage. Understand how infrastructure impacts application speed.
Why engineering teams standardize on Atatus for LAMP
As LAMP stacks mature, understanding how long-lived components behave together under real production load becomes harder than keeping systems online. Teams standardize on Atatus to restore clarity across Apache behavior, PHP execution, and database interaction, reducing uncertainty as traffic patterns and ownership evolve.
Unified Execution Perspective
Engineers maintain a consistent understanding of how requests traverse servers, application logic, and data layers in production.
Fast Operational Alignment
Platform, SRE, and backend teams reach shared understanding of runtime behavior without extended investigation handoffs.
Immediate Signal Confidence
Production signals are trusted early in investigations, enabling decisive action during high-impact incidents.
Lower Debugging Friction
Engineers spend less time correlating fragmented data and more time validating where execution actually failed.
Predictable Incident Flow
Incident response follows structured patterns even as traffic volume and system complexity increase.
Shared Production Reality
Teams reference the same runtime evidence during outages and post-incident reviews, reducing misalignment.
Stable Under Load
Production understanding remains intact as concurrency, memory pressure, and query volume rise.
Reduced On-Call Fatigue
Clear execution insight shortens incident cycles and limits escalation loops for on-call engineers.
Long-Term Stack Confidence
Teams continue maintaining and evolving LAMP systems without fear of unseen production behavior.
Unified Observability for Every Engineering Team
Atatus adapts to how engineering teams work across development, operations, and reliability.
Developers
Trace requests, debug errors, and identify performance issues at the code level with clear context.
DevOps
Track deployments, monitor infrastructure impact, and understand how releases affect application stability.
Release Engineer
Measure service health, latency, and error rates to maintain reliability and reduce production risk.