OBSERVABILITY/ KUBERNETES (PROMETHEUS)
Kubernetes (Prometheus) Monitoring
Monitor Kubernetes clusters effortlessly with Atatus using Prometheus metrics for real-time insights, efficient resource management, and automated alerting.
Sign Up for Free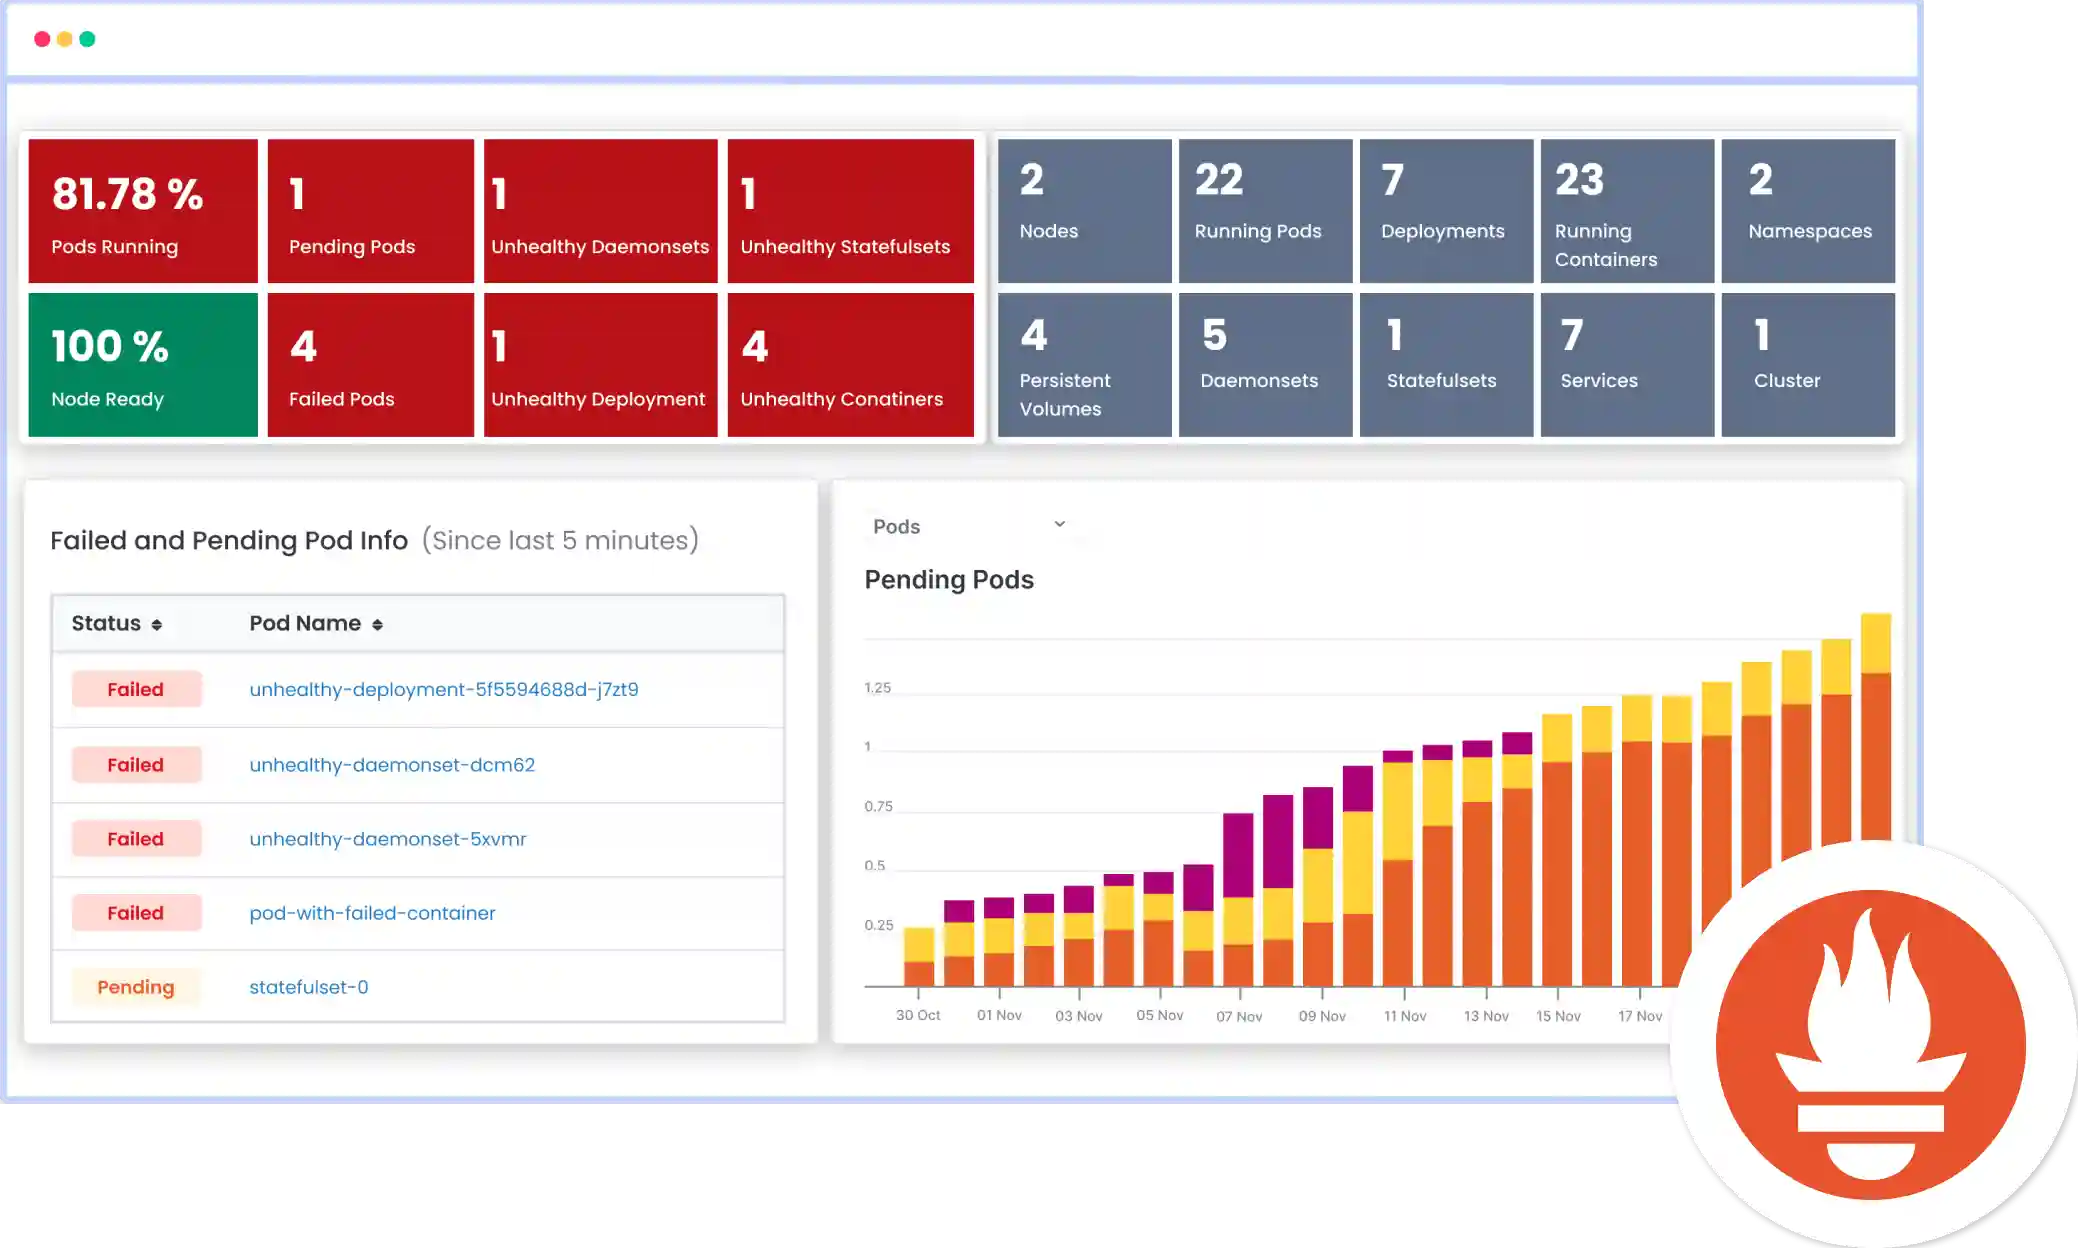


 +1-760-465-2330


