Gain a high-level cluster overview and drill down into pod-specific details with Atatus Kubernetes monitoring. Keep your clusters, pods, and nodes running smoothly with real-time insights and proactive optimization.
Sign Up for FreeMonitor key metrics in your Kubernetes environment to track cluster health, optimize resource utilization, and ensure seamless application performance across pods and nodes.
Monitor CPU utilization at the node, pod, and container levels to ensure workloads have sufficient resources and prevent resource throttling.
Track memory usage against set limits and requests to identify memory leaks or over-provisioned pods that could cause node pressure.
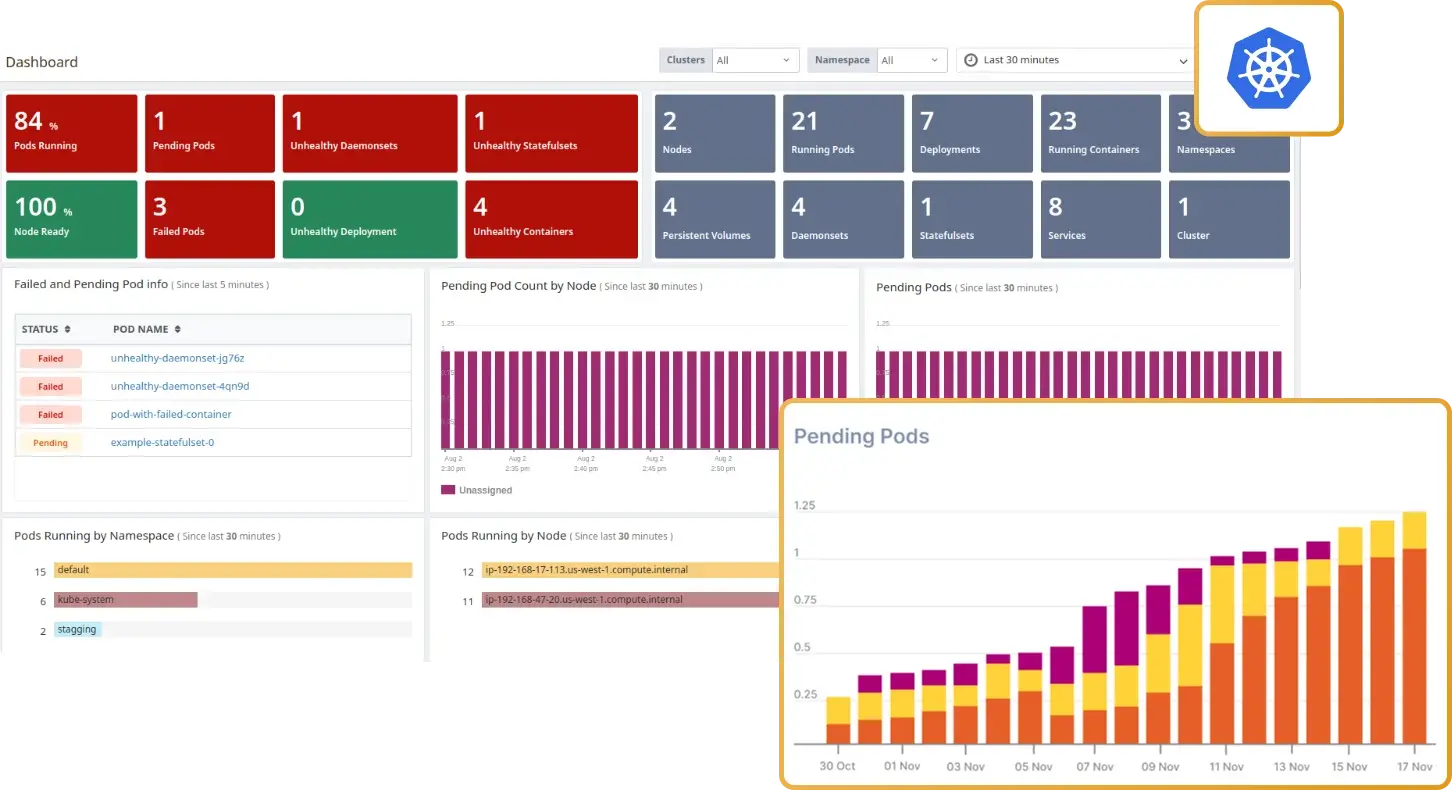
Keep an eye on pod states (Running, Pending, CrashLoopBackOff) and lifecycle events (restarts, terminations) to detect issues with deployments or container failures.
Assess node conditions such as Ready, DiskPressure, and MemoryPressure alongside available CPU and memory to maintain cluster health and balance.
Measure network performance by monitoring incoming and outgoing traffic, packet loss, and latency between services to ensure smooth communication.
Monitor the API server's request rate and response times to detect bottlenecks or high latencies that could impact cluster operations and user interactions.
Kubernetes monitoring matters because it delivers real-time insights into your clusters, pods, and resource usage, ensuring peak performance and seamless scalability. By monitoring key pod metrics and cluster health, you can proactively prevent issues and optimize your infrastructure for maximum efficiency.
Kubernetes monitoring provides a bird’s-eye view of your cluster’s health and performance. From node conditions to pod metrics, gain real-time insights to optimize resource allocation and prevent bottlenecks. With continuous monitoring, ensure your workloads run seamlessly, even under heavy loads.
Understanding complex microservices architectures is critical. Kubernetes monitoring with distributed tracing helps track requests across pods and services, identifying bottlenecks and latency issues. Coupled with service maps, visualize your entire ecosystem to diagnose and resolve issues faster.
Dive deep into individual pod performance with metrics like CPU and memory usage. Kubernetes monitoring ensures you spot resource contention, optimize pod scaling, and prevent costly downtime. Stay proactive with alerts that keep you ahead of performance issues.
Monitor Kubernetes clusters to anticipate scaling needs based on workload trends. By analyzing historical data and resource utilization, you can automate scaling decisions, ensuring your applications remain responsive while optimizing infrastructure costs.
Frequent resource depletion can result from under-provisioned nodes or misconfigured resource limits. Atatus Kubernetes monitoring helps you track resource usage, identify bottlenecks, and optimize workloads to prevent resource exhaustion.
Pod failures can occur due to crashes, misconfigurations, or resource limits. With Atatus Kubernetes monitoring, you get real-time alerts on pod statuses and detailed metrics to quickly pinpoint and resolve the root cause.
Improper scaling can lead to over-provisioning or under-provisioning. Kubernetes monitoring analyzes resource trends and scaling events, ensuring your cluster scales efficiently to meet demand without wasting resources.
Slow deployments may result from image pull delays, insufficient resources, or misconfigured settings. Monitoring deployment metrics helps you identify delays and optimize your CI/CD pipelines for faster rollouts.
Yes, Kubernetes monitoring tracks network traffic, latency, and packet loss, enabling you to detect and resolve communication issues between pods and services to ensure smooth operations.
Node failures can disrupt workloads. Kubernetes monitoring provides detailed node metrics like CPU, memory usage, and disk pressure, allowing you to take proactive measures before a node goes down.
Avail Atatus features for 14 days free-trial. No credit card required. Instant set-up.