Kong API Analytics
Monitor and analyze APIs passing through Kong Gateway with Atatus. Get real-time insights into API traffic, request-response data, latency, and error rates to ensure high performance and reliability.
Sign Up for Free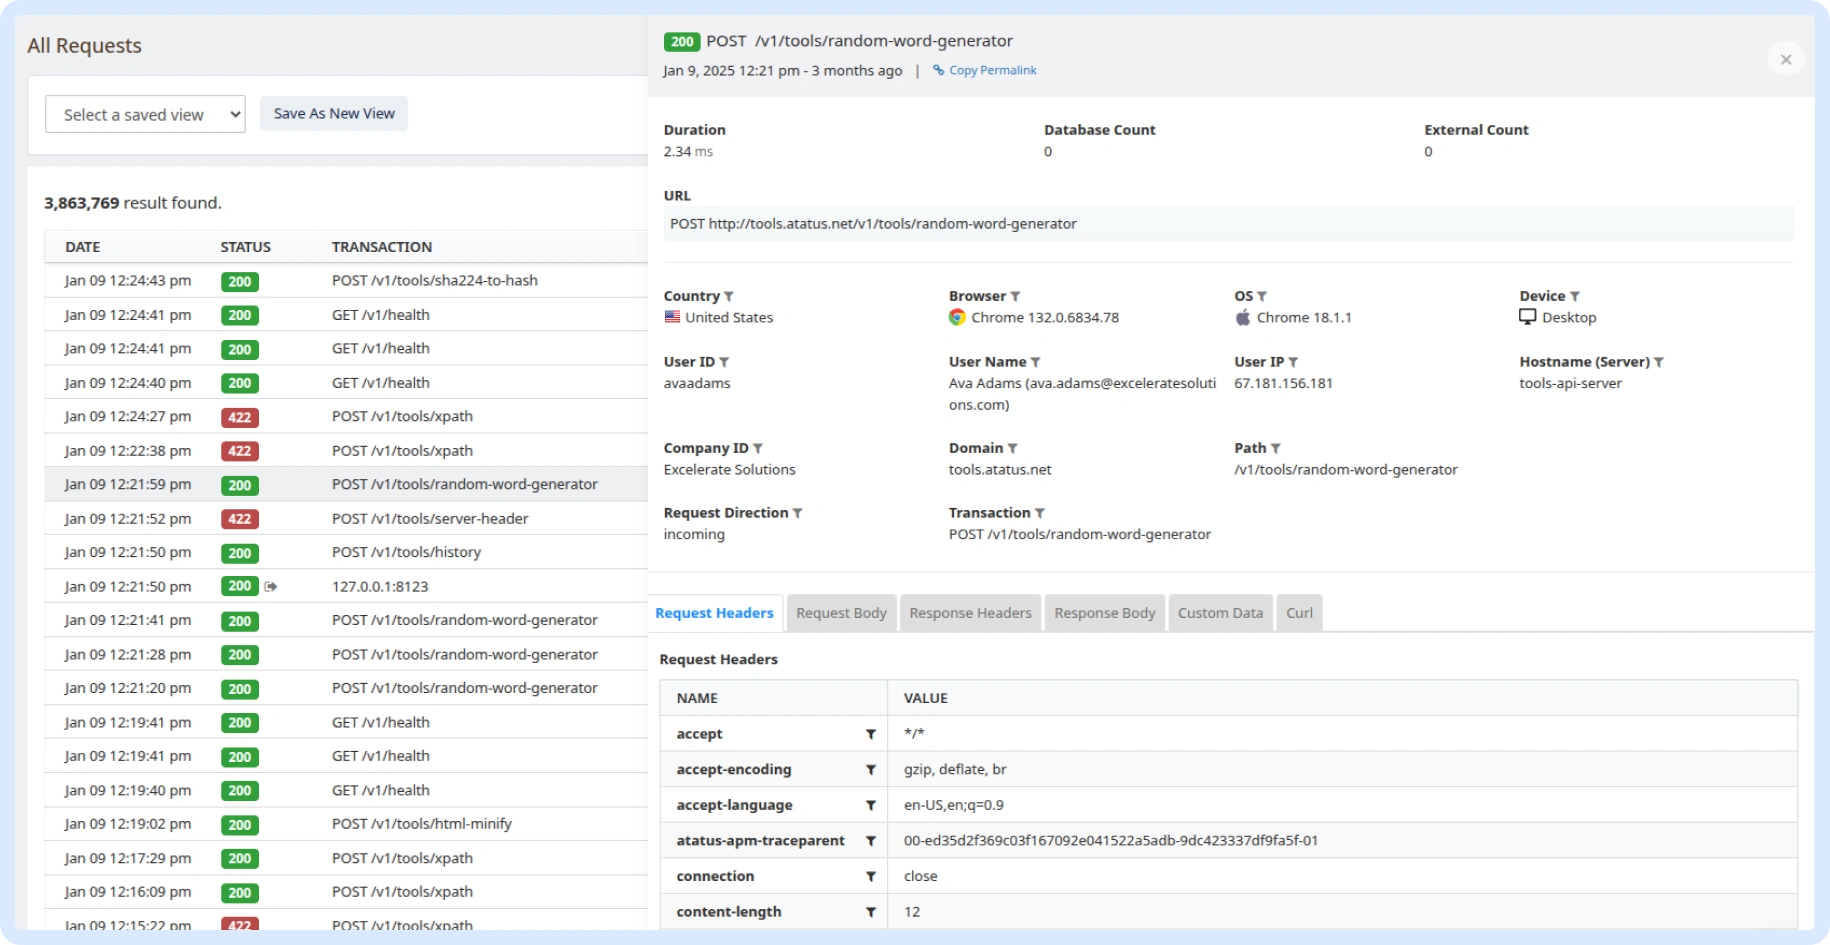
Monitor and analyze APIs passing through Kong Gateway with Atatus. Get real-time insights into API traffic, request-response data, latency, and error rates to ensure high performance and reliability.
Sign Up for FreeReal-time visibility into Kong Gateway is essential to detect and resolve API issues before they impact users. Atatus delivers in-depth monitoring of traffic, latency, and failures across your API ecosystem. It empowers teams to optimize performance, detect anomalies, and strengthen API security.
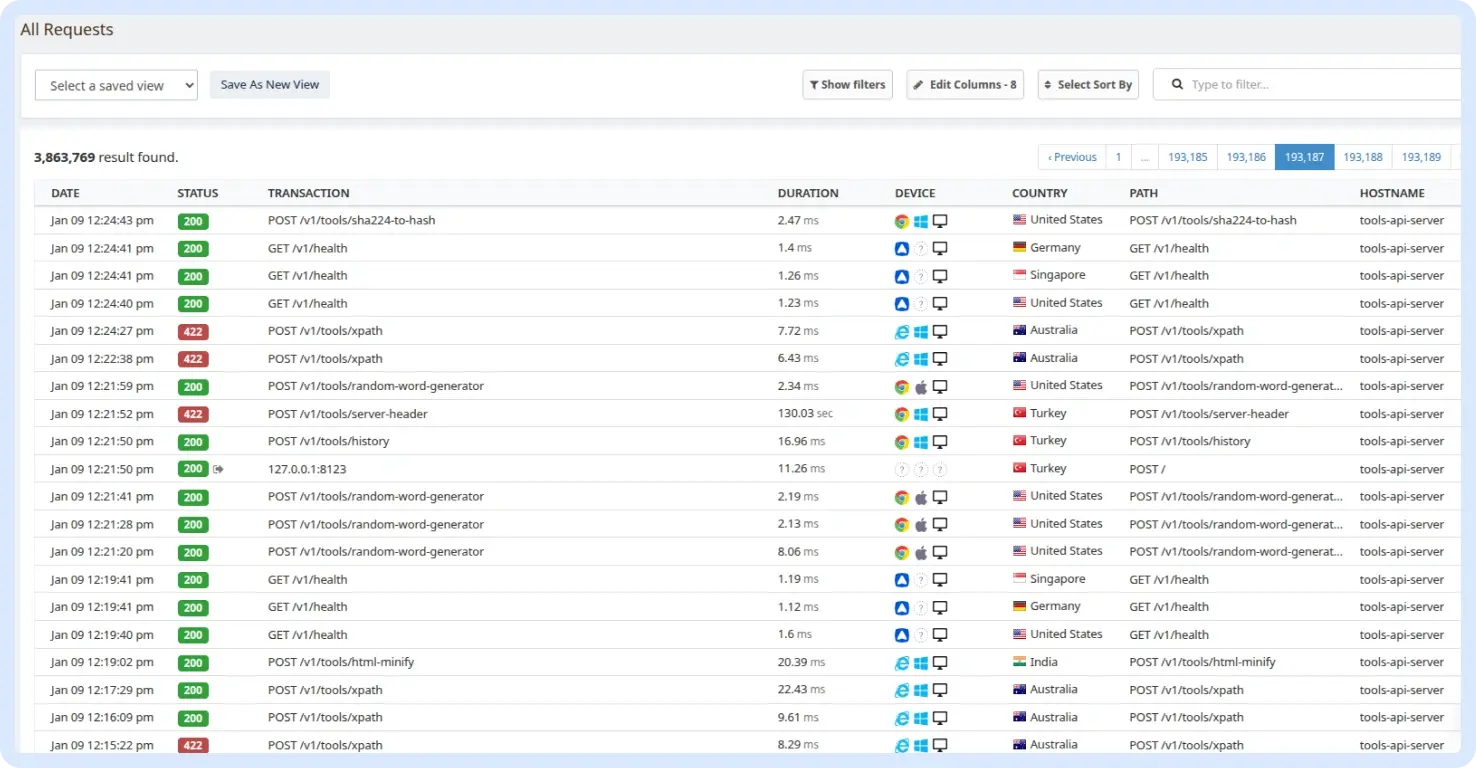
Monitor every API request passing through Kong Gateway in real time. Track request volume, HTTP methods, response status codes, and throughput to ensure APIs are running efficiently. Identify traffic spikes and prevent bottlenecks before they impact users.
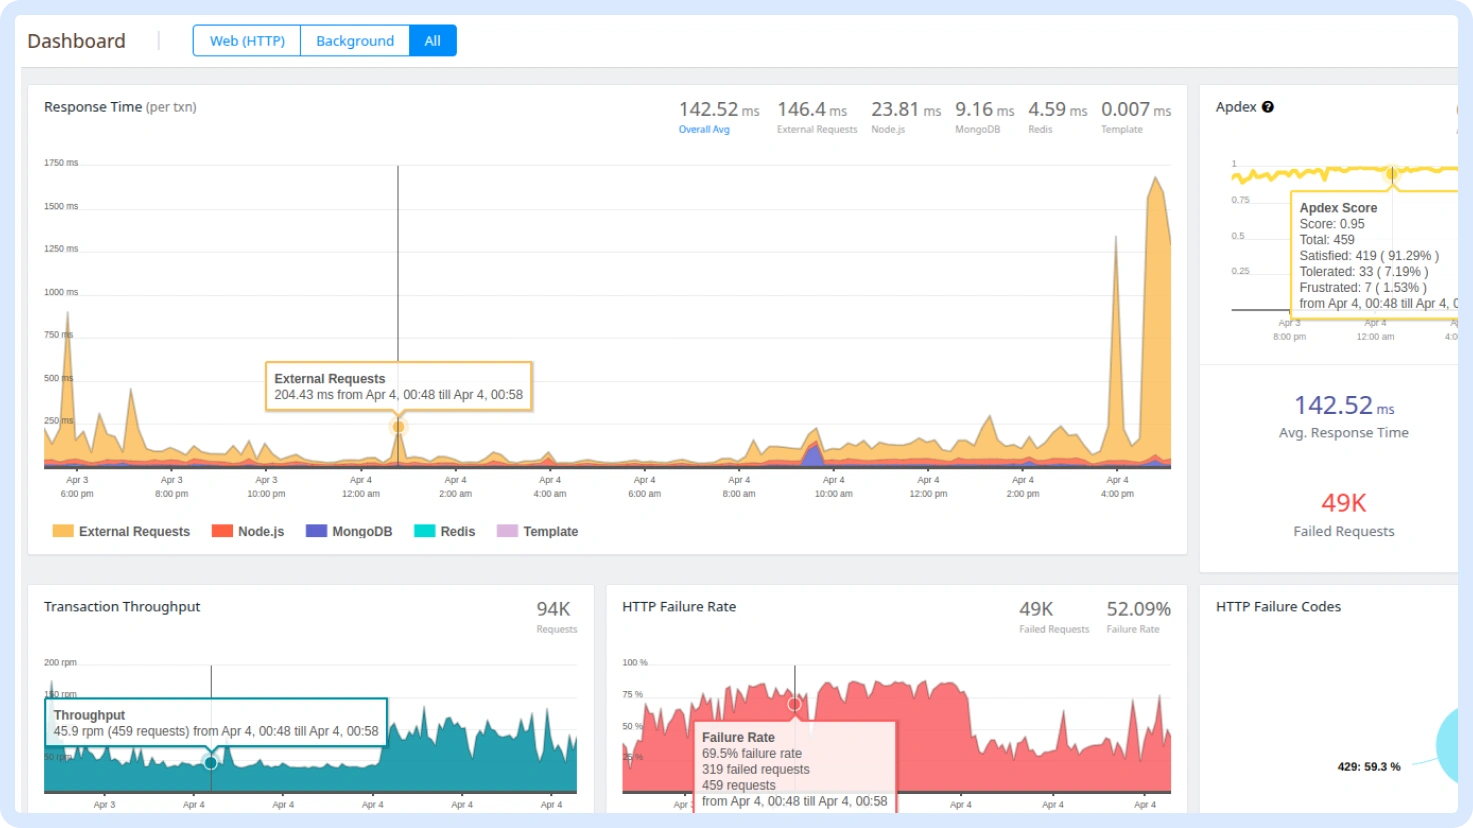
Analyze API response times and identify performance bottlenecks instantly. Monitor latency metrics (avg, p95, p99), and slow endpoints to optimize API performance. Detect whether delays originate from Kong, backend services, or network issues.
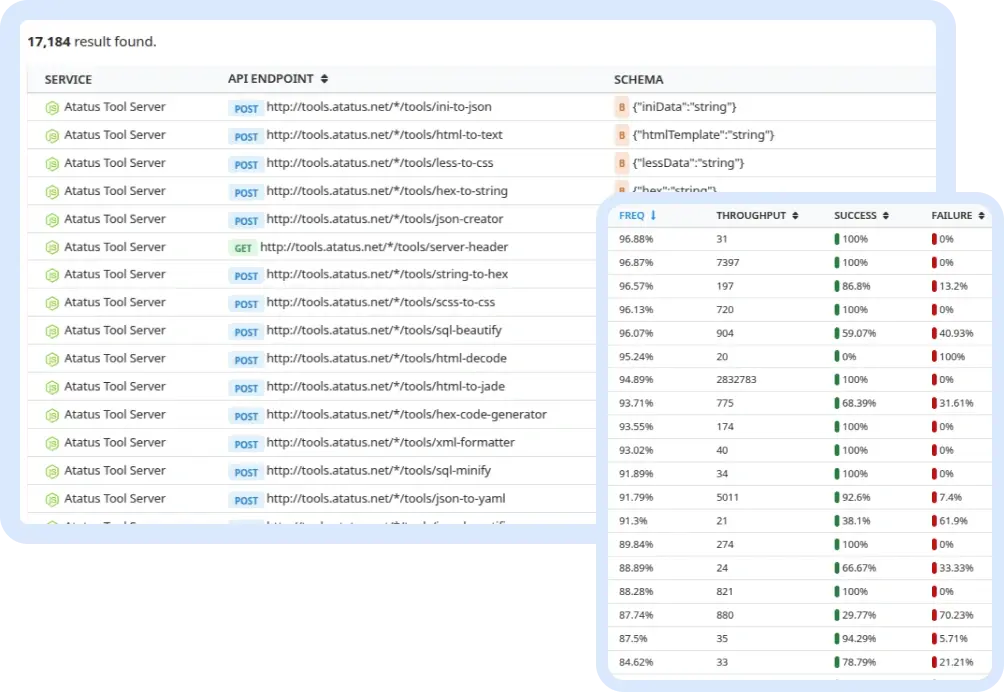
Gain deep insights into how your users interact with your APIs. identify popular endpoints, track API traffic trends over time, and analyze geographic usage patterns. Understand request volumes across different services to optimize API scalability.
Identify and debug API failures with detailed error tracking. Monitor failed requests, analyze error trends, and capture request payloads for better troubleshooting. Full stack trace logging helps engineers quickly pinpoint and resolve issues.
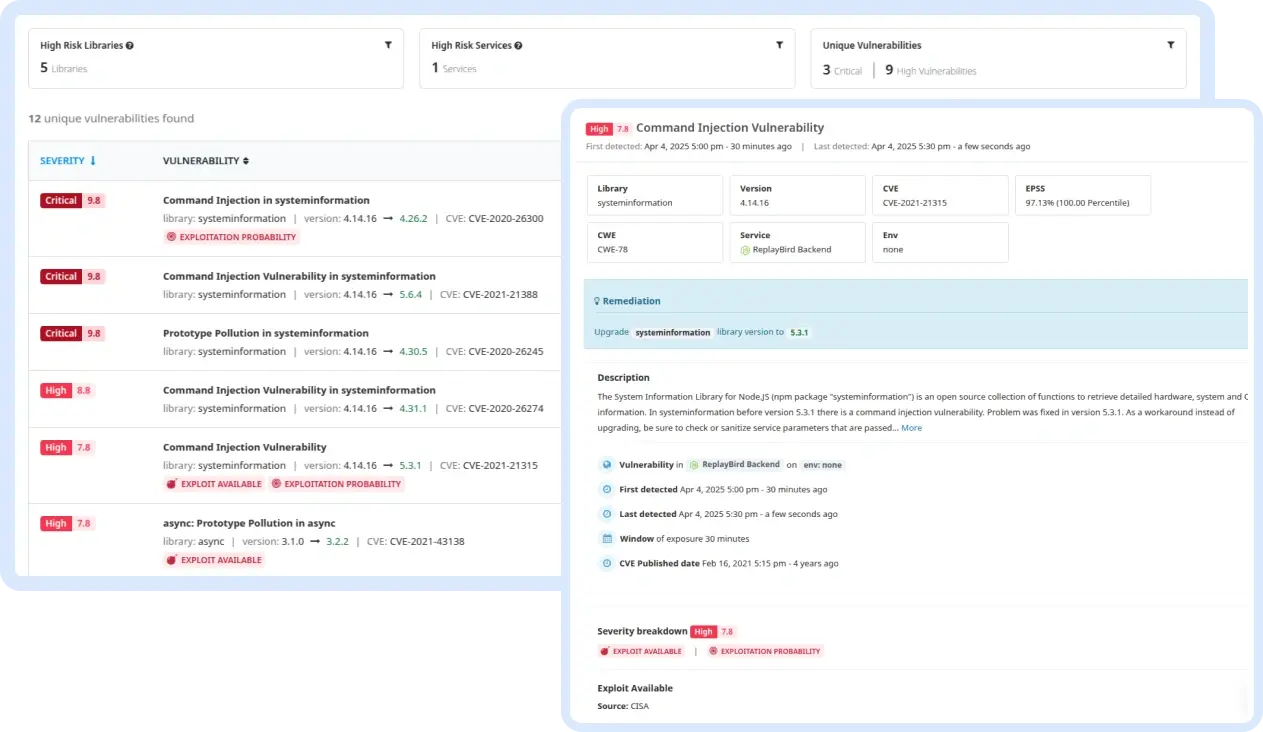
Protect your APIs from unauthorized access and malicious activity. Detect abnormal traffic patterns, track failed authentication attempts, and monitor API key misuse. Identify rate-limiting violations and suspicious IP activity to strengthen API security.
Kong API monitoring refers to tracking the performance, and usage of APIs managed through Kong Gateway. It helps teams detect issues early, measure latency, and understand usage patterns through Kong API analytics. Monitoring is essential to ensure high availability, performance, and security across your APIs. Without it, bottlenecks, failures, or anomalies could go unnoticed, impacting both end users and backend systems.
Atatus API Analytics provides deep insights into API traffic by capturing API calls, user behavior, and trends across your Kong Gateway. It enables tracking of API usage by individual users or companies, monitors errors, and supports advanced filtering and segmentation for debugging and analytics. Atatus also offers real-time alerts, API monetization insights, and retention tracking, helping you optimize your API strategies effectively.
Some of the best Kong observability tools include:
Each tool offers unique strengths in visualizing Kong API Gateway metrics and traffic.
Key Kong API Gateway metrics you should track include:
These API monitoring metrics ensure reliable performance, scalability, and security of your APIs.
Integrating Atatus with Kong Gateway is seamless and efficient. Here is a quick look at how it works and why it’s optimized for performance and flexibility:
1. Visibility into API Usage
2. Error and Anomaly Detection
3. Performance Monitoring
4. Business Insights
5. Data-Driven Decision Making
6. Security and Compliance
To monitor APIs in Kong Gateway, you can:
This setup gives you real-time visibility into your API behavior, helping with optimization and troubleshooting.
You don't have to trust our word. Hear what our customers say!
Atatus is a great product with great support. Super easy to integrate, it automatically hooks into everything. The support team and dev team were also very helpful in fixing a bug and updating the docs.

Atatus is powerful, flexible, scalable, and has assisted countless times to identify issues in record time. With user identification, insight into XHR requests to name a few it is the monitoring tool we choose for our SPAs.

Atatus continues to deliver useful features based on customer feedback. Atatus support team has been responsive and gave visibility into their timeline of requested features.

Feel assured as we maintain rigorous security protocols, ensuring the safety of your data with every interaction


Avail Atatus features for 14 days free-trial. No credit card required. Instant set-up.
 +1-415-800-4104


