Java Monitoring
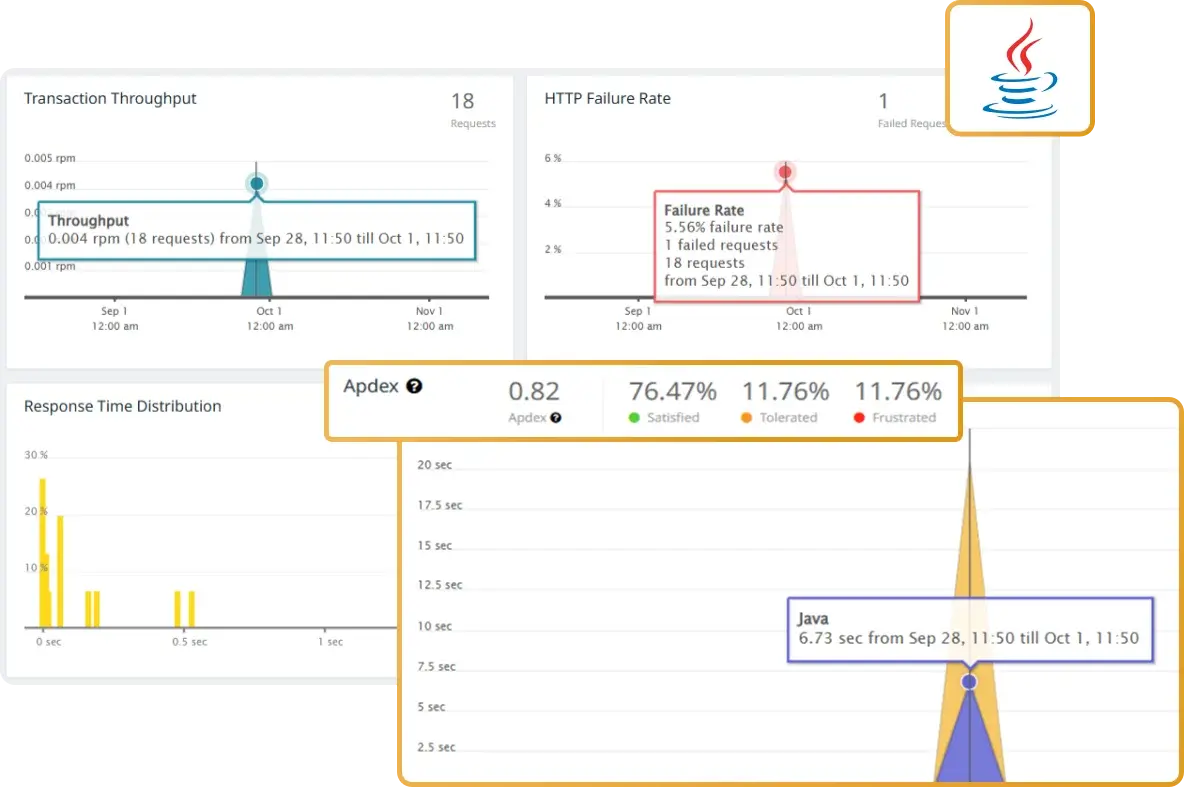
Take control of your Java application performance with Atatus. Monitor distributed Java applications effortlessly, optimize efficiency, and resolve issues in real-time to deliver flawless user experiences.
Sign Up for Free
Take control of your Java application performance with Atatus. Monitor distributed Java applications effortlessly, optimize efficiency, and resolve issues in real-time to deliver flawless user experiences.
Sign Up for Free
Monitor key metrics in your Java application to track JVM performance, optimize memory usage, and ensure optimal application performance.
Measures the time spent by the JVM in garbage collection activities. This metric helps identify excessive GC times that can impact application performance, causing latency or slow response times.
Tracks the amount of heap memory used by the JVM, including the memory occupied by objects in memory. This helps identify memory leaks or inefficient memory usage that could result in OutOfMemoryError.
Monitors the number of active threads in the JVM. A sudden increase in thread count may indicate thread contention, deadlocks, or inefficient multi-threading practices, which could negatively affect application scalability.
Measures the percentage of CPU resources consumed by the JVM process. This metric helps detect resource-hogging or inefficient code that could be causing high CPU utilization, potentially degrading application performance.
Tracks the time taken to process requests by the Java application. This metric is crucial for understanding the application's ability to handle user requests and helps pinpoint performance bottlenecks in specific areas of the code.
Measures the time it takes for the JVM to load classes. High-class loading times could indicate inefficiencies in the application’s startup or potential issues with large or complex class dependencies, impacting overall application performance.
Java monitoring is essential for maintaining high-performing applications in today’s complex environments. With Atatus, you gain deep insights into Java application performance and distributed Java applications, allowing you to detect issues proactively, optimize resource usage, and ensure seamless, high-speed user experiences.
Java APM (Application Performance Monitoring) provides deep insights into your Java applications, helping you identify and resolve performance bottlenecks quickly. Atatus Java monitoring offers real-time tracking of response times, memory usage, and thread activity, ensuring that your applications run efficiently under varying loads. By pinpointing slow transactions and resource hogs, Atatus helps enhance the user experience and optimize system performance across the board.

Effective memory management is crucial in Java applications to prevent crashes and performance degradation. Atatus Java monitoring tracks JVM heap and non-heap memory usage, providing insights into memory leaks and excessive garbage collection cycles. By proactively identifying memory-related issues, Atatus ensures that your application avoids OutOfMemoryError, reducing downtime and ensuring smooth operation.

In Java applications, thread contention and deadlocks can cause significant slowdowns and even application crashes. Atatus Java monitoring gives you a detailed overview of thread performance, including active, blocked, and waiting threads. With Atatus, you can quickly identify bottlenecks in multi-threaded environments, helping you optimize concurrency and improve overall application responsiveness.

When performance issues arise in Java applications, quick diagnosis is key. Atatus’ root cause analysis tool helps you identify the exact line of code, method, or external service causing the problem. With detailed error tracking and code-level visibility, you can troubleshoot and fix issues faster, minimizing downtime and improving the reliability of your Java applications.

With Atatus Java monitoring, you get end-to-end visibility into your application’s transactions. This includes tracking database calls, third-party API interactions, and background services. By monitoring transaction flows from start to finish, Atatus helps you detect slow requests, uncover performance issues, and ensure a smooth user experience by proactively addressing performance degradation before it impacts your users.

Java applications rely on garbage collection to manage memory, but excessive or inefficient GC activity can lead to unpredictable performance. Atatus Java monitoring offers detailed insights into GC cycles, including duration, pause times, and frequency. By understanding GC behavior, you can optimize memory usage and reduce the impact of GC pauses, ensuring that your application runs with minimal interruptions.

Java applications can experience slowdowns due to inefficient code, excessive garbage collection, memory leaks, or thread contention. With Atatus Java monitoring, you can pinpoint the root causes by tracking response times, memory usage, thread performance, and garbage collection cycles in real-time, allowing for targeted optimizations.
Memory leaks in Java often occur due to improperly managed objects or unclosed resources. Atatus helps by tracking JVM heap and non-heap memory usage, identifying objects that are occupying memory longer than necessary. This visibility helps you spot and resolve memory leaks before they affect application performance.
An OutOfMemoryError usually points to inefficient memory management or excessive memory usage. Atatus Java monitoring provides detailed insights into memory allocation, garbage collection pauses, and heap usage, enabling you to optimize memory settings and prevent crashes due to insufficient memory.
Thread deadlocks occur when two or more threads are waiting on each other to release resources, causing the application to freeze. Atatus allows you to monitor active threads and detect thread contention or deadlocks, helping you address concurrency issues and ensure your application runs smoothly.
Slow database queries can severely impact application performance. With Atatus Java monitoring, you get deep visibility into database interactions, including query performance and execution times. This enables you to identify slow queries and optimize them to improve overall application responsiveness.
Garbage collection can cause performance hiccups if not managed properly, especially in large-scale Java applications. Atatus provides detailed insights into GC cycles, duration, and pause times, helping you identify if GC is causing latency and optimize memory management to reduce interruptions.
High CPU usage can indicate inefficient code or resource hogging by specific components in your Java application. Atatus Java monitoring tracks CPU consumption by the JVM, allowing you to pinpoint areas of high computational load, optimize resource-intensive processes, and improve overall system performance.
Avail Atatus features for 14 days free-trial. No credit card required. Instant set-up.