Golang Monitoring
Golang Monitoring provides real-time insights into goroutines, memory usage, and CPU performance. Ensure your Golang app runs efficiently and stays error-free with Atatus Golang Agent.
Sign Up for Free
Golang Monitoring provides real-time insights into goroutines, memory usage, and CPU performance. Ensure your Golang app runs efficiently and stays error-free with Atatus Golang Agent.
Sign Up for Free
Monitor key metrics in your Golang application to track goroutines, optimize resource usage, and ensure peak performance.
The number of goroutines currently in use. This metric helps monitor concurrency and ensures that your application isn’t leaking goroutines or spawning an unexpected number.
Tracks the amount of memory allocated on the heap. Useful for identifying memory leaks or inefficient memory usage.
Measures the time taken by the garbage collector (GC) to pause application execution during memory cleanup. High or frequent pauses can indicate memory pressure.
The total number of garbage collection cycles. This helps track how often garbage collection occurs and its potential impact on application performance.
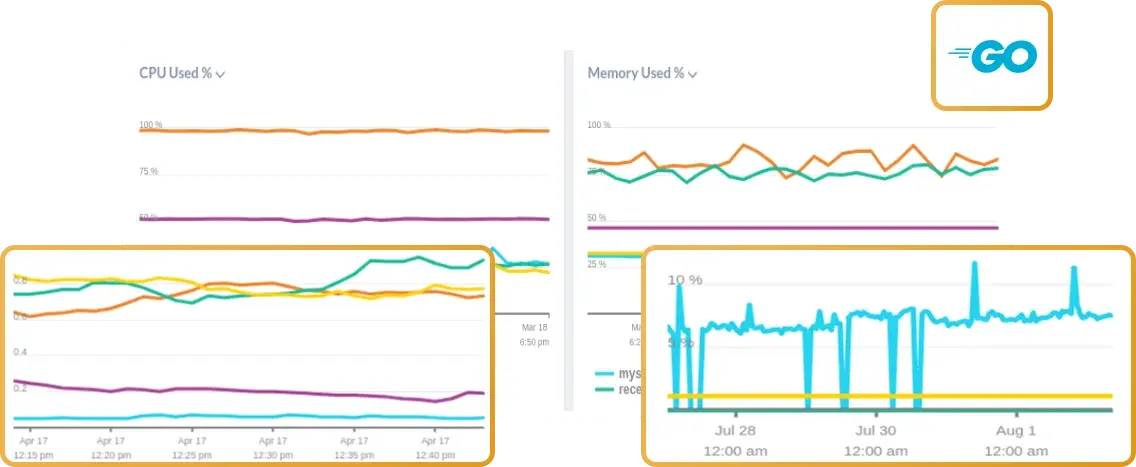
Percentage of CPU used by the Go process. Monitoring this helps identify CPU bottlenecks, especially in compute-intensive applications.
Measures the time it takes to process incoming requests. Critical for monitoring performance and user experience in web or API-based applications.
Golang Monitoring matters because it ensures optimal performance and reliability of your applications by tracking critical metrics like goroutine usage, memory, and CPU efficiency. With Atatus, you get distributed tracing and a service map for end-to-end visibility, helping you quickly identify and resolve bottlenecks across your Golang application stack.
Golang’s strength lies in its goroutines and channels, but without proper monitoring, concurrency issues like deadlocks or goroutine leaks can go unnoticed. With Atatus Golang Monitoring, you gain deep insights into goroutine performance, helping you pinpoint and resolve bottlenecks efficiently.

Modern Golang applications often rely on microservices. Atatus provides distributed tracing to track requests across services, ensuring no latency spikes or failures go undetected. Visualize request flows in a service map, making it easier to debug and optimize your Golang application’s architecture.

Efficient resource utilization is critical in high-performance Golang applications. Atatus monitors Golang applications heap usage, garbage collection, and CPU metrics, enabling you to detect memory leaks, optimize CPU usage, and maintain top-notch performance even under heavy workloads.

Atatus Golang Monitoring keeps you one step ahead by delivering real-time alerts for errors, high latency, or resource exhaustion. Identify anomalies before they impact your users, ensuring your Golang applications remain resilient and reliable around the clock.

Golang, or Go, is an open-source programming language developed by Google. It’s designed for building scalable and high-performance applications, offering features like concurrency through goroutines, garbage collection, and a robust standard library. Ideal for web servers, APIs, and distributed systems, Golang emphasizes simplicity and efficiency.
Goroutine leaks can lead to excessive memory usage and degraded performance. Golang Monitoring with Atatus tracks active goroutines in real-time, helping you identify abnormal increases and debug the root cause efficiently.
Monitoring memory usage and garbage collection is critical for optimizing performance. Atatus provides detailed metrics on heap allocation, garbage collection pauses, and object counts, enabling you to fine-tune your application’s resource management.
Tracing issues across distributed systems can be challenging. Atatus offers distributed tracing and a service map, allowing you to track requests as they move through different services, making it easier to identify bottlenecks or failures.
High CPU usage can impact application performance. Atatus Golang Monitoring provides real-time CPU metrics, helping you identify and address performance bottlenecks during peak traffic.
Avail Atatus features for 14 days free-trial. No credit card required. Instant set-up.