OBSERVABILITY/ CAMEL
Apache Camel Java Agent Extension Monitoring
Atatus actively monitors the Apache Camel Java Agent Extension, tracking Camel route performance in real time. It analyzes exchange patterns, measures route latencies, and assesses resource utilization, helping you optimize integrations with minimal overhead.
Sign Up for Free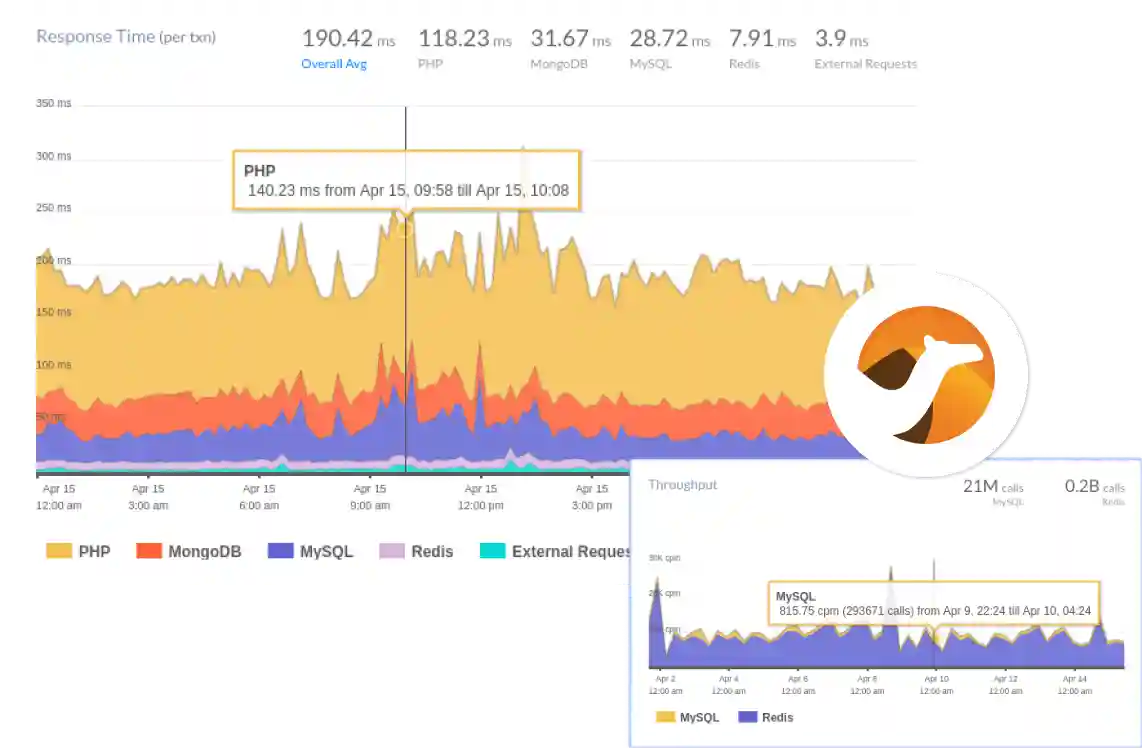


 +1-415-800-4104


