CakePHP

CakePHP error tracking performance monitoring and fix CakePHP performance errors and monitoring tools and status apm with a monitoring tool and fix performance issues and resolve problems faster.

Sign Up for Free
CakePHP Monitoring

Key Metrics for CakePHP Monitoring

Monitor these key metrics to ensure CakePHP performs efficiently and securely, helping you identify potential issues before they impact your application's performance and user experience.

throughput

Request Throughput

Measures the number of requests handled per second. This helps identify traffic patterns and assess the app's ability to handle high loads.

Response Time

Response Time

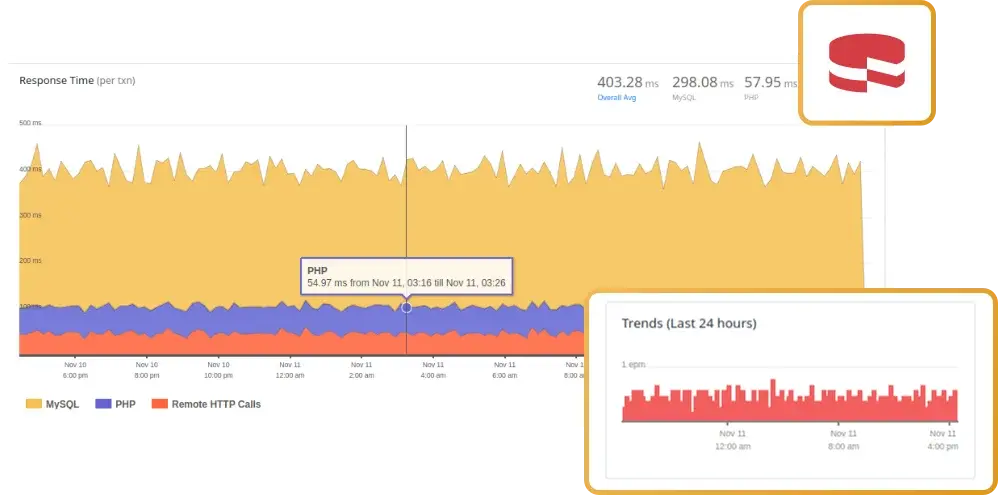
Tracks the time taken to process requests. Lower response times indicate better performance, while higher values may point to bottlenecks in the application or database.

Error Rate

Error Rate

Monitors the percentage of requests that result in errors (e.g., 4xx or 5xx HTTP status codes). A high error rate can indicate application bugs, configuration issues, or external system failures.

Database Query Performance

Database Query Performance

Measures the execution time and frequency of database queries. Slow queries or excessive database calls can impact the overall performance of your CakePHP application.

Memory Usage

Memory Usage

Tracks the amount of memory consumed during request processing. High memory usage might signal inefficient code or excessive data handling, potentially leading to crashes.

CPU Utilization

CPU Utilization

Monitors the percentage of CPU resources used by the application. Spikes in CPU usage can point to inefficient loops, heavy computations, or unoptimized tasks.

Why CakePHP Monitoring Matters?

CakePHP monitoring is crucial for ensuring optimal application performance and a seamless user experience. With Atatus APM, you can track performance metrics, detect bottlenecks, and resolve errors in real-time, keeping your app fast, reliable, and user-focused.

Pinpoint Performance Bottlenecks in Real-Time

With CakePHP monitoring, you can instantly identify slow-running queries, memory leaks, or inefficient code. Using the Atatus PHP agent, track response times and optimize your application’s critical workflows before they affect end-user experience.

Pinpoint Performance Bottlenecks in Real-Time

Reduce Error Rates and Debug Faster

Never let errors disrupt your operations. CakePHP monitoring with Atatus APM captures every exception and error, along with detailed stack traces. This helps developers diagnose issues quickly and deploy fixes with confidence, reducing downtime.

Reduce Error Rates and Debug Faster

Optimize Database Interactions

Efficient database queries are crucial for smooth application performance. Monitoring CakePHP with Atatus provides insights into slow or frequent queries, helping you streamline database interactions and reduce response times effectively.

Optimize Database Interactions

Ensure Seamless User Experience

Monitor key user journeys and measure the impact of your application’s performance on user satisfaction. With CakePHP performance monitoring, track metrics like latency and request throughput to deliver a fast, reliable experience for every user interaction.

Ensure Seamless User Experience

FAQs for CakePHP Monitoring

What is CakePHP?

CakePHP is an open-source, rapid development framework for PHP that provides a robust structure for building web applications. It follows the Model-View-Controller (MVC) pattern, making it easier to develop and maintain complex applications. With built-in tools for authentication, security, and caching, CakePHP streamlines the development process while offering flexibility, scalability, and fast performance.

How can Atatus help me identify Performance Bottlenecks in CakePHP?

Atatus CakePHP monitoring provides deep visibility into your application’s performance, pinpointing slow database queries, inefficient code, and long response times. It allows you to quickly address these bottlenecks by providing real-time insights, helping optimize your CakePHP application’s efficiency and performance.

Can Atatus monitor Database Performance in CakePHP?

Absolutely! Atatus CakePHP monitoring includes detailed insights into your database performance, including slow queries, query frequency, and execution times. This allows you to optimize database interactions, reducing delays and improving the overall efficiency of your CakePHP application.

What happens if my CakePHP Application experiences a Spike in Traffic?

With Atatus APM, you’ll be alerted to sudden spikes in traffic or resource consumption. This allows you to scale up your CakePHP application and prevent slowdowns or crashes. Monitoring helps ensure your application can handle peak loads efficiently, ensuring continuous performance even under heavy demand.

How do I track errors in my CakePHP Application?

Atatus APM automatically tracks all errors, from HTTP failures to application exceptions, and provides detailed stack traces. This makes it easier to debug issues in real-time, significantly reducing the time spent troubleshooting errors and minimizing downtime for users.

How does Atatus handle Alerts and Notifications?

Atatus enables customized alerts for various metrics in your CakePHP application, including performance drops, errors, and database issues. You can set thresholds for different performance parameters, and Atatus APM will notify you instantly via email, Slack, or other integration channels so you can take action swiftly.

Ready to see actionable data?

Avail Atatus features for 14 days free-trial. No credit card required. Instant set-up.