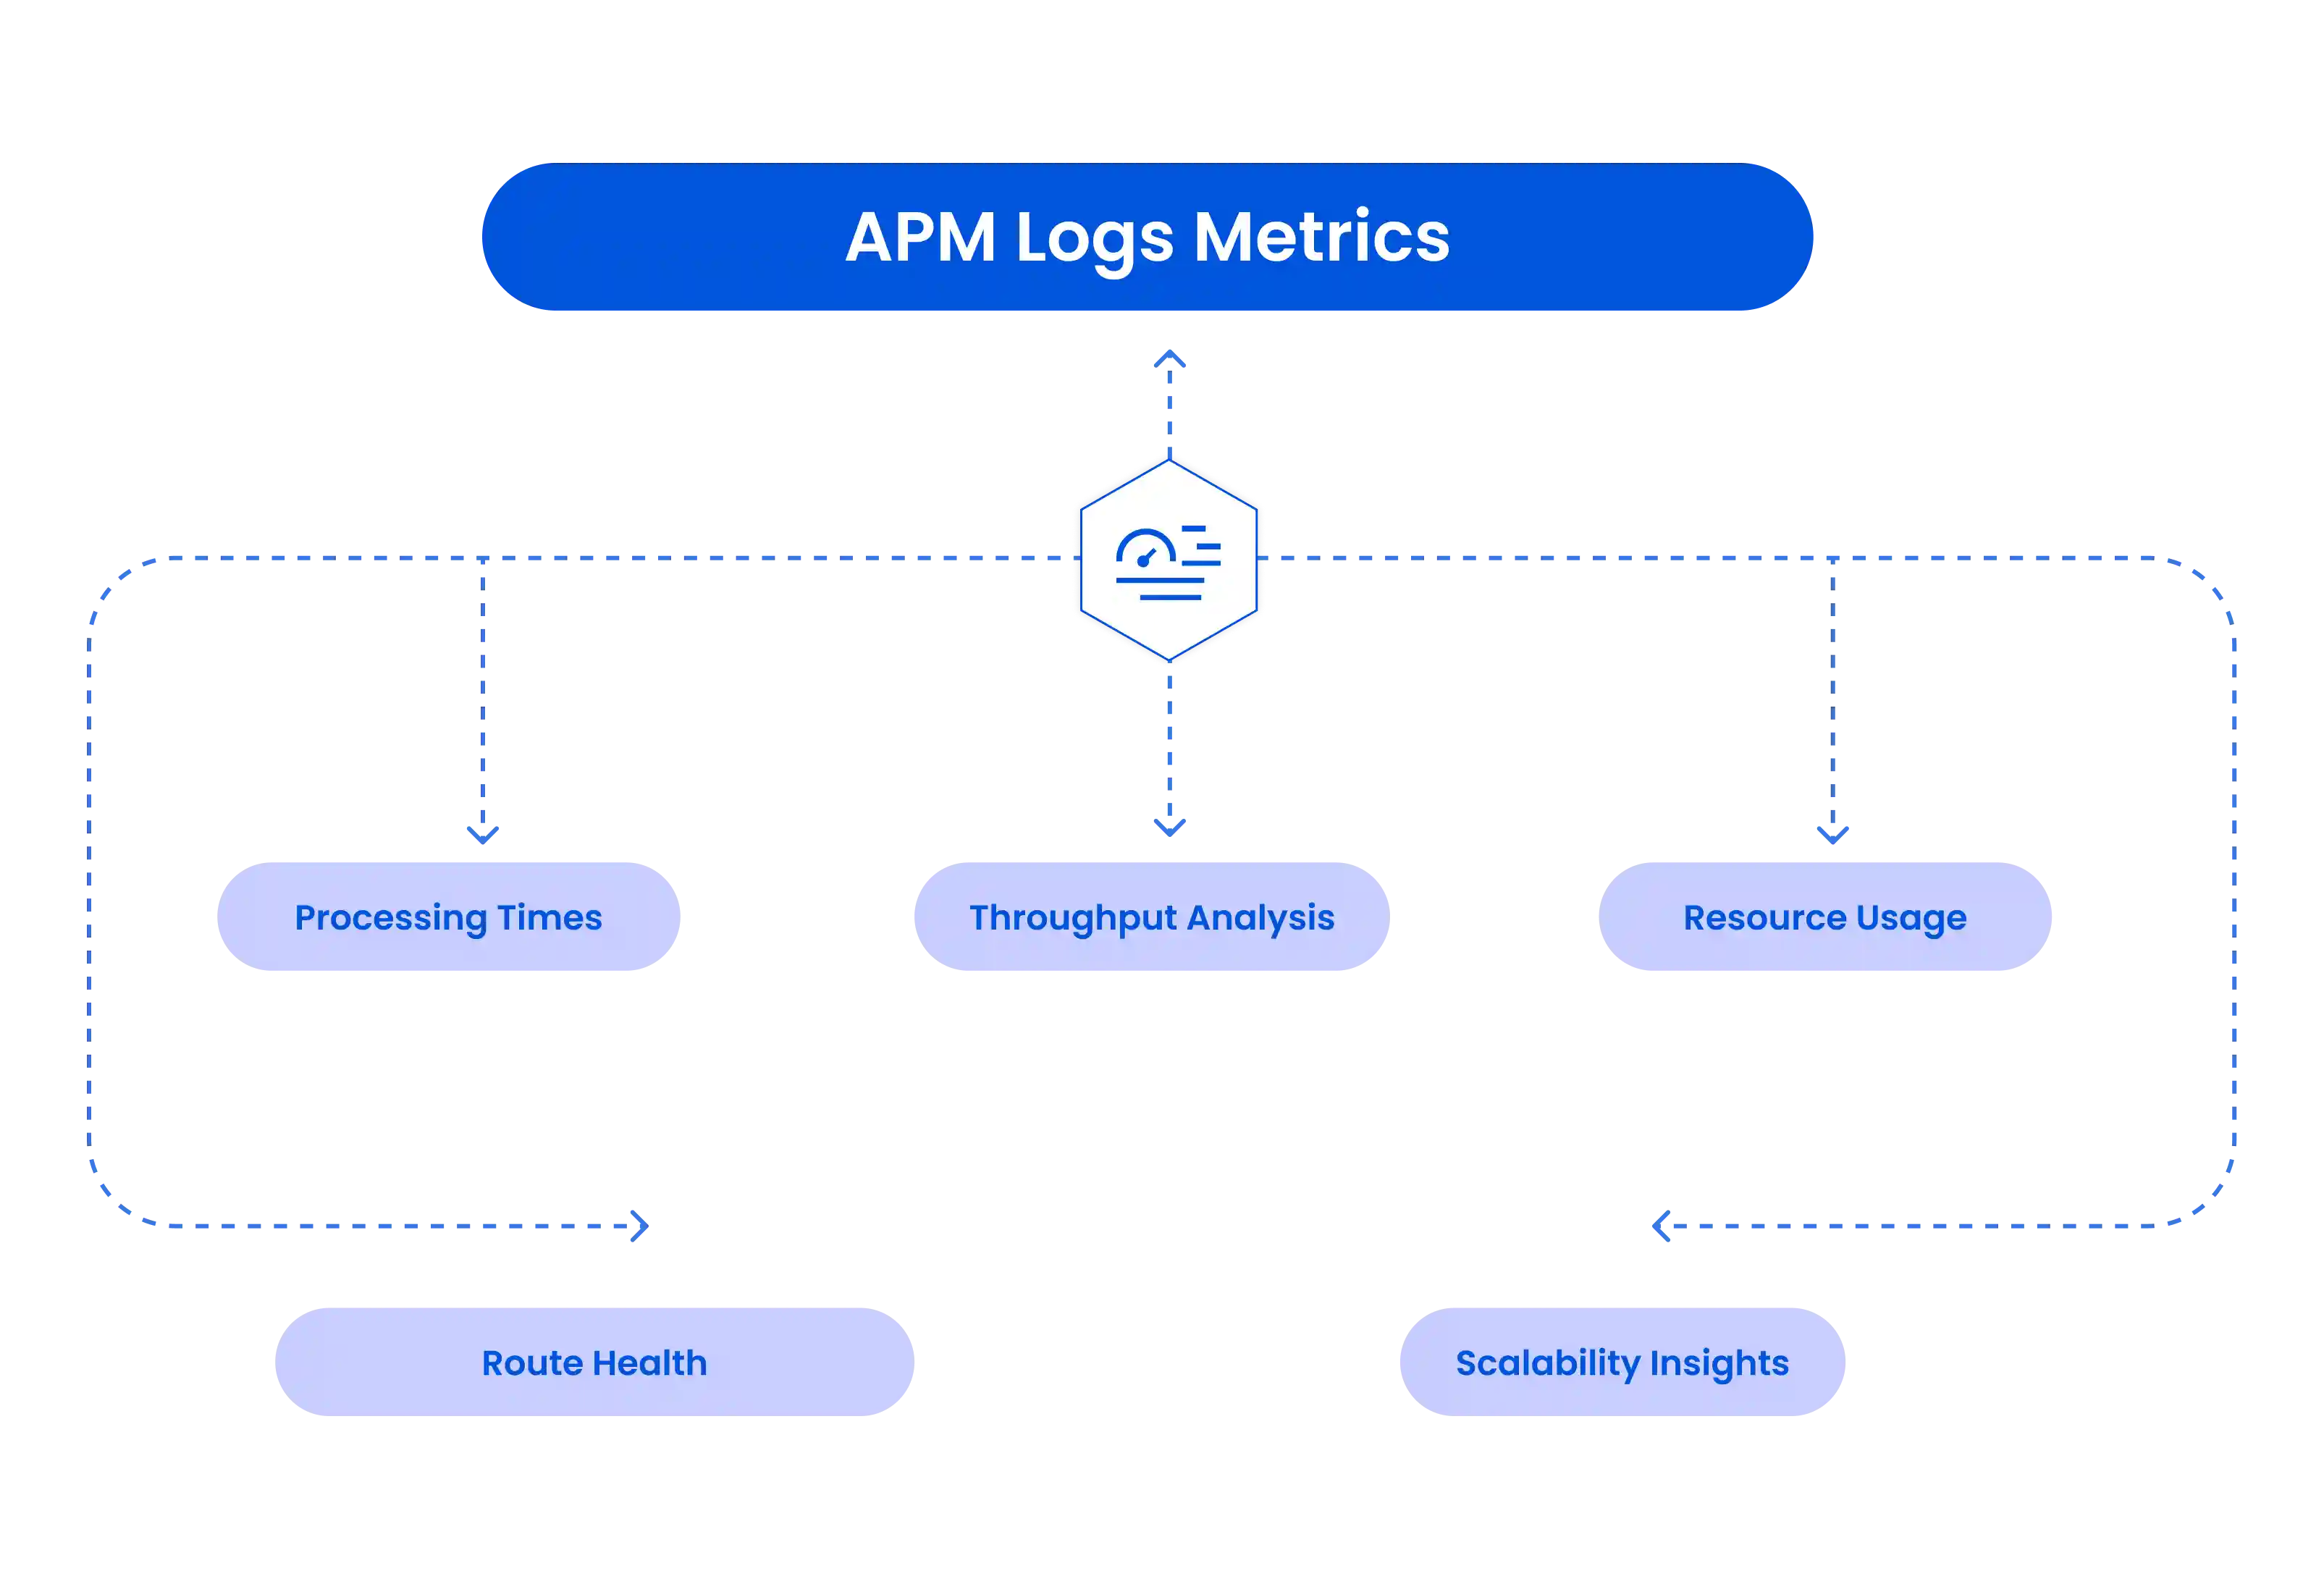
Atatus APM Logs provide deep visibility into your application by correlating performance metrics with log data. By linking Atatus logs to specific transactions, you can quickly pinpoint and resolve performance issues, ensuring optimal application efficiency.
Sign Up for FreeMonitor key metrics with APM Logs Observability to detect and resolve issues early, ensuring smooth application performance and system reliability.
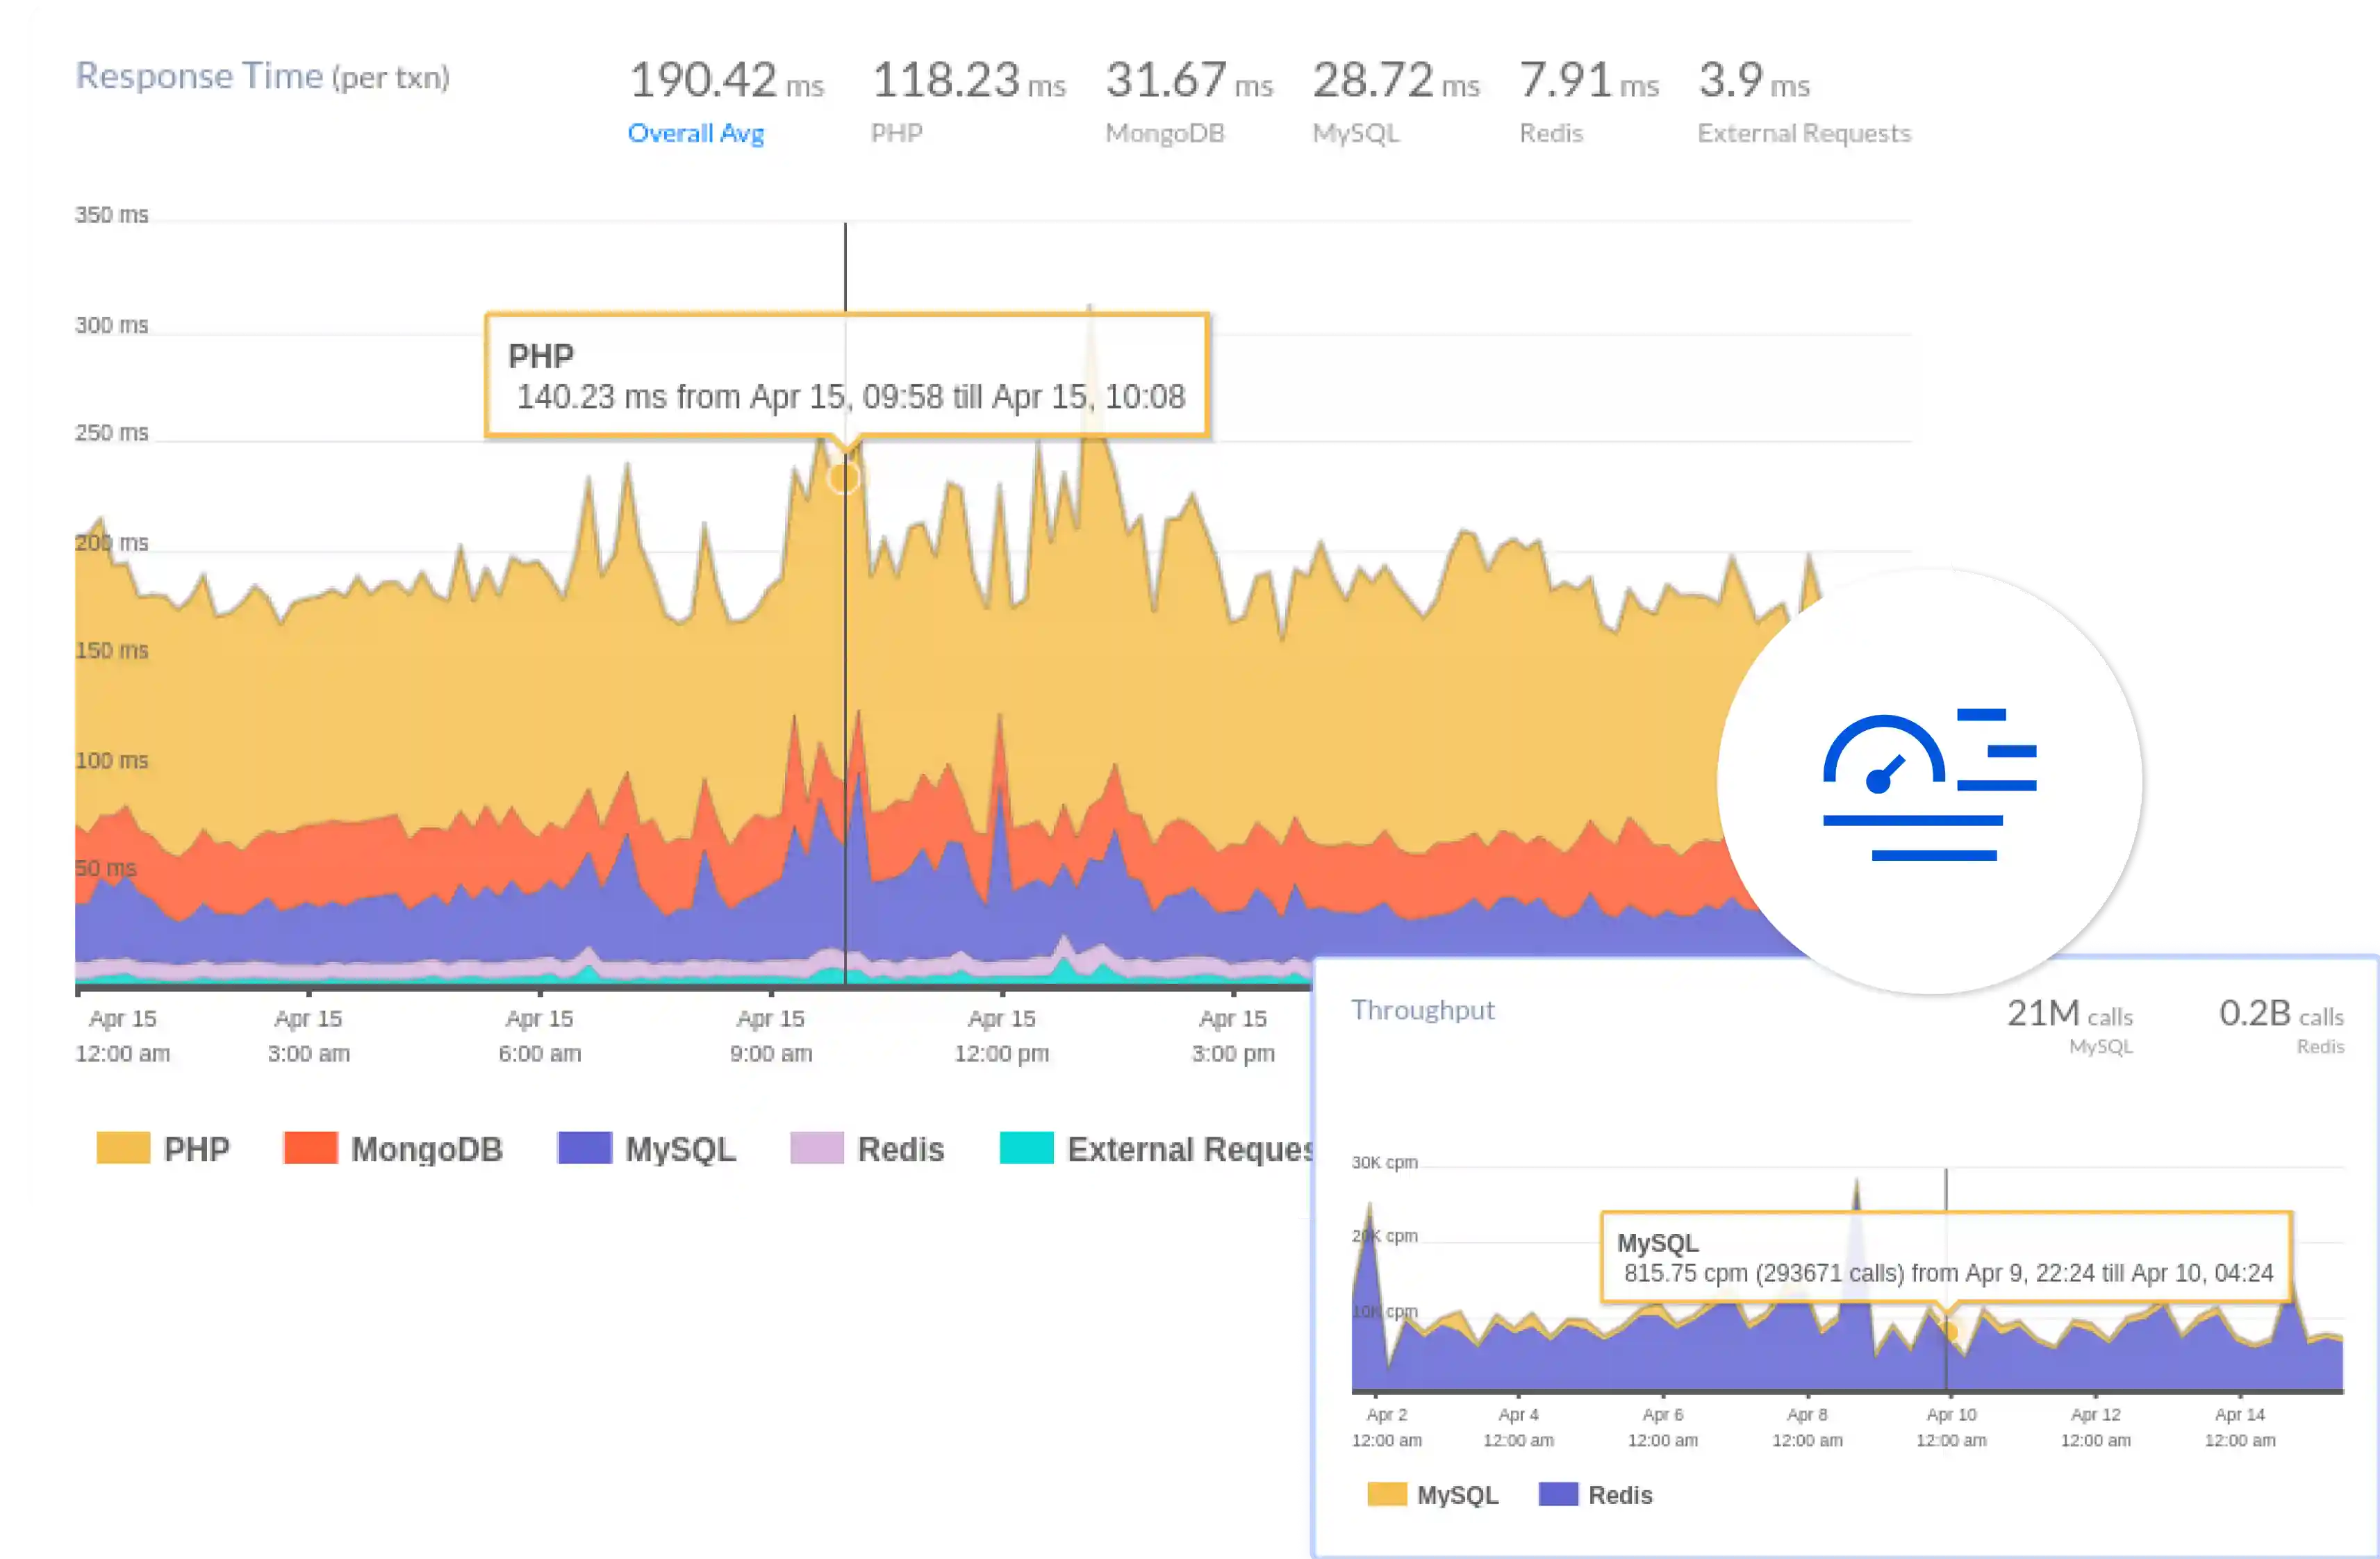
Tracks individual transactions across your application, helping identify bottlenecks and performance issues in real-time. Useful for tracing API calls, database queries, and external requests.
Monitors application error rates and correlates them with log entries, helping to pinpoint the root cause of errors by connecting performance issues with specific log data.
Measures the number of requests per second (throughput) and the time taken to process each request (latency). Log data can help diagnose slow endpoints or services.
Monitors resource consumption (CPU and memory) for individual transactions and correlates log data to understand the resource impact of specific performance issues.
Tracks slow database queries and associates relevant logs to help analyze why specific queries are slowing down your application’s performance.
Measures the response times of various services and dependencies in your application architecture, linking them with logs to provide a complete picture of performance across the stack.
When combined, APM and log monitoring provide powerful insights into your application’s performance, helping you troubleshoot, optimize, and proactively address issues. Let’s explore the key advantages that make APM logs indispensable for your organization with Atatus.
With APM logs, Atatus gives you real-time visibility into every layer of your application’s infrastructure. From backend services to individual API calls, you can trace performance issues and link them directly to the relevant logs for faster debugging and improved accuracy.
When an error occurs, APM logs correlate detailed performance metrics with the exact log entries related to those issues. This enables your team to quickly identify root causes, significantly reducing the time spent troubleshooting and preventing performance bottlenecks before they affect users.
APM logs empower proactive issue detection by combining performance data with logs. Atatus allows you to set up alerts based on specific conditions found in both performance metrics and logs, helping your team detect hidden problems early and mitigate risks before they impact user experience.
APM Logs are logs that are correlated with application performance monitoring (APM) metrics, providing detailed insights into performance issues. They link log data with specific transactions, errors, and bottlenecks, allowing for quicker identification and resolution of performance problems.
Yes, Atatus APM Logs helps detect the root cause of performance issues by linking error logs, slow transactions, and bottlenecks to their underlying log data. This correlation enables you to quickly identify and resolve the source of performance problems.
APM Logs focus on correlating log data with performance metrics to track application health, whereas regular log monitoring collects logs across various systems for general troubleshooting. APM Logs provide deeper context for performance issues, making them ideal for application performance monitoring.
Yes, Atatus allows you to set up custom alerts based on both performance data and log entries. This ensures proactive issue detection, allowing you to receive alerts when specific performance or log thresholds are exceeded.
Avail Atatus features for 14 days free-trial. No credit card required. Instant set-up.