Full Stack Django Performance Monitoring
Get end-to-end visibility into your Django performance with application monitoring tools. Gain insightful metrics on performance bottlenecks with Python monitoring to optimize your application.
Get end-to-end visibility into your Django performance with application monitoring tools. Gain insightful metrics on performance bottlenecks with Python monitoring to optimize your application.
1. Install the agent using pip:
pip install atatus
2. Add "atatus.contrib.django" to INSTALLED_APPS in your settings.py:
INSTALLED_APPS = [
#...
'atatus.contrib.django'
]
3. Add license key and app name in your settings.py:
ATATUS = {
"APP_NAME": "Django App",
"LICENSE_KEY": "lic_apm_xxxxxxx"
}
4. Restart your server
1. Install the agent using pip:
pip install atatus[flask]
2. Initialize Atatus agent and add license key, app name in your main file.
from atatus.contrib.flask import Atatus
app = Flask(__name__)
# Add atatus agent to your app.
app.config['ATATUS'] = {
"APP_NAME": "Flask App",
"LICENSE_KEY": "lic_apm_xxxxxxx"
}
atatus = Atatus(app)
3. Restart your server
1. Go to your app directory and set your license key and app name to heroku config
heroku config:set ATATUS_APP_NAME="Flask App"
heroku config:set ATATUS_LICENSE_KEY="lic_apm_xxxxxx"
2. Add atatus.contrib to INSTALLED_APPS and set license key, app name in your settings.py.
INSTALLED_APPS = [
# ...
'atatus.contrib.django',
]
3. Add atatus to your project’s requirements.txt file.
# requirements.txt
atatus
4. Create a Procfile in your root directory and add the following line.
web: gunicorn yoursite.wsgi
5. Run the following commands to commit the changes.
git add .
git commit -m "Added Atatus Agent"
git push heroku master
heroku logs --tail
6. Access your app.
Atatus captures all requests to your Django applications without requiring you to change your source code. Get a clear picture of how all your methods, database statements and external requests are affecting your user's experience.
Automatically visualize end-to-end business transactions in your Django application. Monitor the amount and type of failed HTTP status codes and application crash with Django Monitoring. Analyze response time to identify Django performance issues and errors on each and every business transaction. Understand the impact of methods and database calls that affects your customer's experience.
Learn more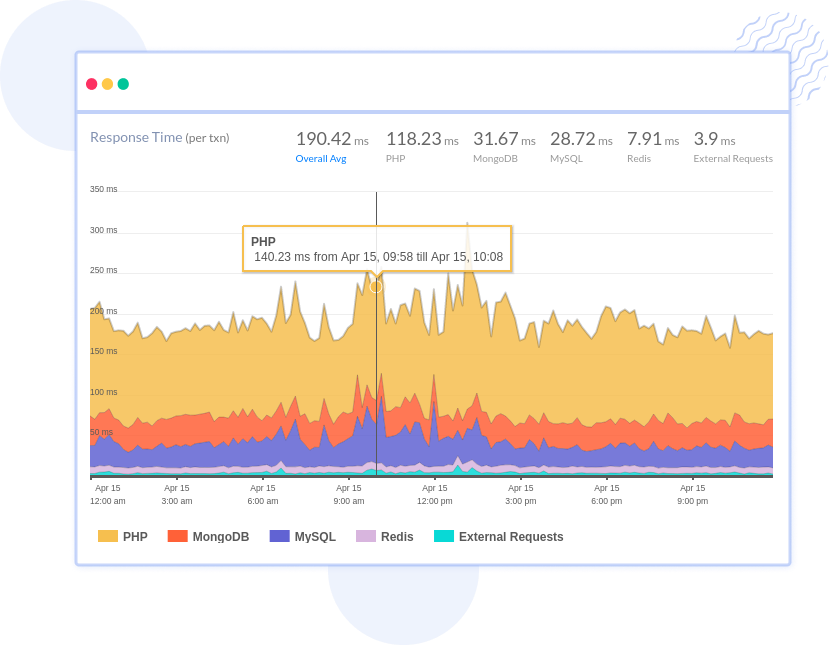
Examine all SQL and NoSQL queries used by your Django server. Identify slow database queries and optimize query performance with database monitoring proactively. Monitor and measure third party API calls' response times and REST API failure rates along with HTTP status codes. Slice and dice performance metrics in real time—based on host, version, release stage, URL and other attributes.
Learn more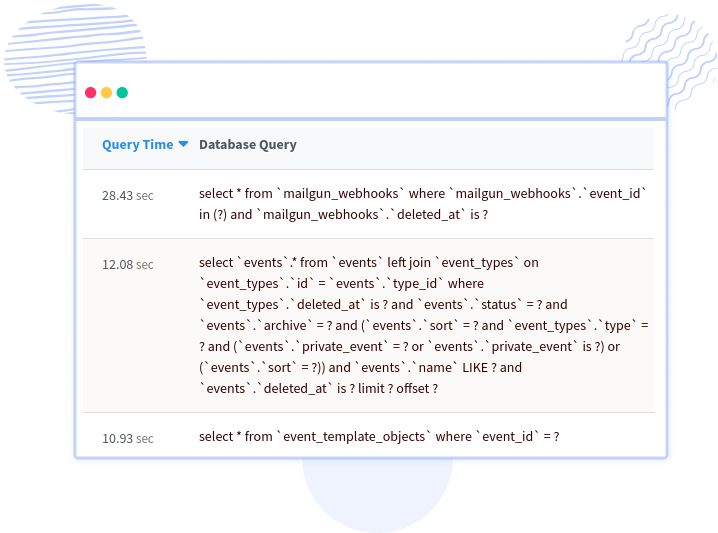
Every Django error is tracked using error tracking and captured with full stacktrace and exact line of source code is highlighted to make bug fixing easier. Get all the essential data such as class, message, URL, request agent, version etc to fix the Django exceptions and errors. Identify buggy API or third party services by investigating API failure rates and application crashes. Get alerts for application errors and exceptions via Email, Slack, PagerDuty, or using webhooks.
Learn more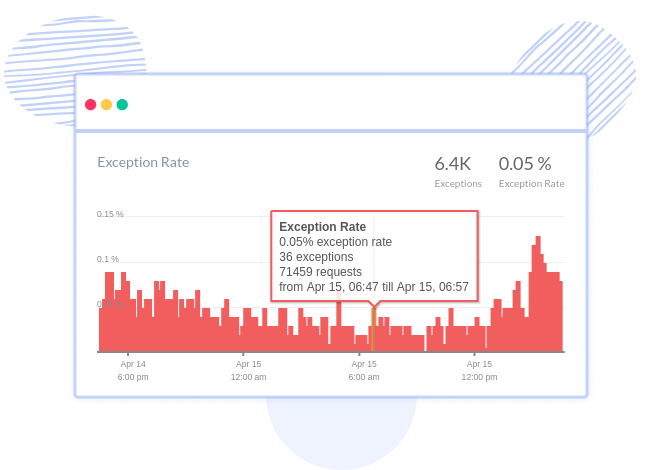
Quickly view the highest Django HTTP failures and get each request information along with custom data to identify the root cause of the failures. See the breakdown of the API failures based on HTTP Status Codes and the end-users having the highest impact.
Learn more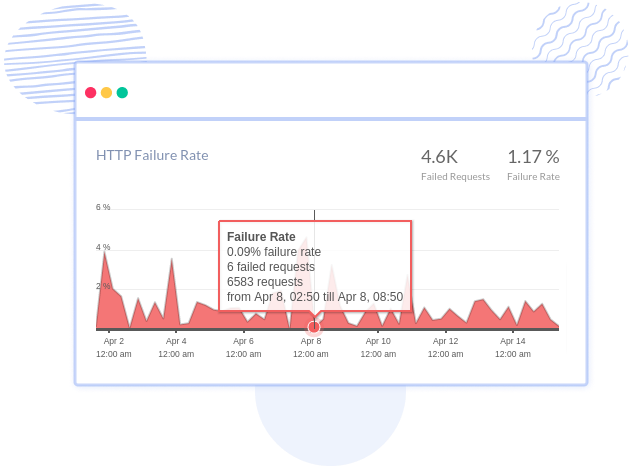
Break down slow Django requests by time spent in code blocks, database queries, external services, templates, message queues and much more. View logs, infrastructure metrics, VM metrics in context with the original request.
Learn more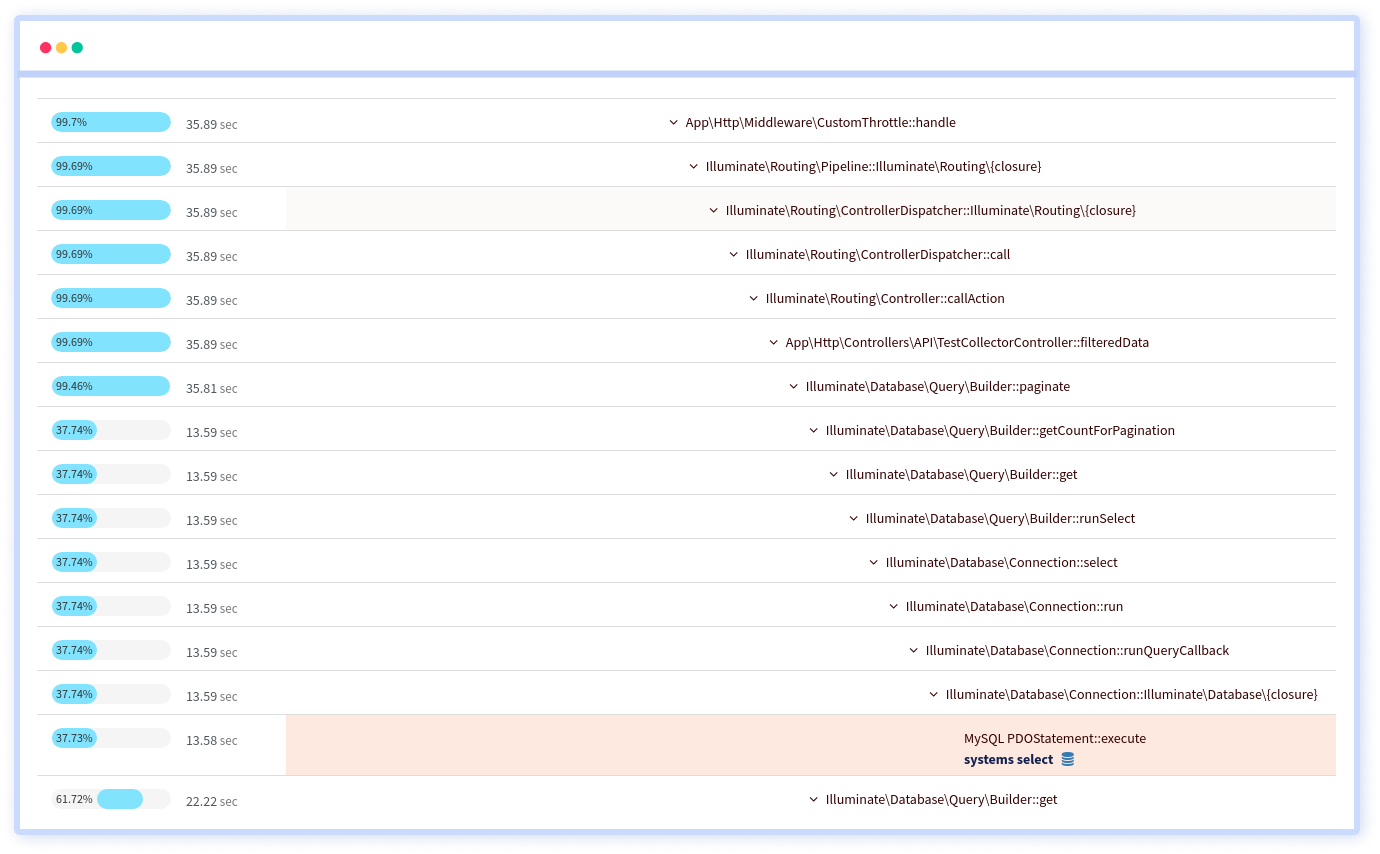
Try it free. No credit card required. Instant set-up.
Best APM Monitoring tool
— S Herman Kiefus, DevOps Admin, Compass
Utilize industry-leading integrations with libraries and frameworks for in-depth invisibility into Java, PHP, Node.js, Ruby, Python, Go, .NET applications.
See data from multiple apps in real time and visualize critical information including transaction performance, error rate, database performance, network calls and more.
Quickly identify error and Django performance issues and fix them by using the context, environment, and more before it affects your customers.
Track all your Django application workflow in one place. Add your production, dev, staging, QA to monitor your applications through the complete software development cycle.
Get your questions answered. Use custom queries to slice and dice the data by transaction, URL, error, user, browser, host OS and more using Django performance monitoring.
Designed by developers, for developers and managers to determine when and where your attention is required and enable teams to ship more and fix less.
Setup alerts to automatically monitor your applications for increase in response time, API failures, error rate and much more. Get notified through various channels, including Slack, Teams, Email, PagerDuty and more.
Easily compare one time range to another and so on, and identify changes in app behavior and stability with respect to the app releases.
Don't miss out on your Django web application performance and error stats. Atatus can send you weekly and monthly summaries directly to your inbox, helping you monitor web services and application performance monitoring.
Django performance monitoring involves using various Django monitoring tools to track, analyze, and optimize the performance of a Django application. This includes measuring response times and identifying bottlenecks. Django performance monitoring includes measuring response time, database performance, error tracking, resource usage, request throughput, and application logs.
Application Performance Metrics
Database Metrics
Resource Usage Metrics
Network Metrics
To implement Django performance monitoring you need a Django application performance monitoring tools like Atatus. First, install the Atatus APM client in your Django project. Next, configure Atatus in your settings file. Then, set up the Django monitoring dashboard in Atatus to visualize metrics and Django network monitoring data. This will provide comprehensive insights into your application's performance.
Feel assured as we maintain rigorous security protocols, ensuring the safety of your data with every interaction


Avail Atatus features for 14 days free-trial. No credit card required. Instant set-up.

 +1-415-800-4104


