Top Zabbix Competitors & Alternatives 2025
Looking for a Zabbix alternative that is easier to set up, scale, and manage? In this guide, we have listed the top monitoring tools that deliver faster insights, better dashboards, and modern capabilities. Whether you are focused on performance, infrastructure, or log monitoring, you will find an option that suits your needs and helps you move beyond the limitations of Zabbix.
Table of Contents:
- What is Zabbix and What are its Features?
- Why are People Looking for Zabbix Alternatives?
- Top Zabbix Alternative Tools
What is Zabbix and What are its Features?
Zabbix is a powerful, open-source monitoring tool used to monitor networks, servers, virtual machines, and cloud services. It collects real-time metrics and displays them through customizable dashboards and alerts. Designed for IT infrastructure teams, Zabbix is known for being robust, but it requires manual configuration and can be complex for beginners.
Key Features of Zabbix:
- Network, server, cloud, and VM monitoring
- SNMP, IPMI, and agent-based data collection
- Customizable dashboards and widgets
- Real-time alerting
- API for integration with third-party tools
While Zabbix is powerful, it has a steep learning curve, limited modern UX, and lacks some full-stack capabilities like APM or real user monitoring out-of-the-box. That’s where Zabbix alternatives come in.
Why are People Looking for Zabbix Alternatives?
Zabbix is known for being a flexible monitoring solution, but when you explore platforms like Reddit, Capterra, and G2, a consistent pattern of user feedback emerges, and it's not all positive. Here is a consolidated view of the most common issues raised by real users:

- Complex and Time-Consuming Setup: You have to do a lot of manual work to get Zabbix running properly. It’s not a tool where you can just plug in and start. If you’re not already familiar with how it works, the setup can feel long and confusing.
- Manual Scripting and Lack of Automation: Unlike modern tools that offer auto-discovery or built-in integrations, Zabbix needs you to write custom scripts and configure things yourself. That means more work for your team.
- Steep Learning Curve: Many users say it’s not beginner-friendly. You will need to spend time reading documentation or asking for help just to understand the basics especially if you are new to monitoring.
- Not always Accurate in Real Time: There can be delays in the data you see versus what iis actually happening. That can be risky if you are trying to catch problems fast.
- Not ideal for Modern Web Apps: If you want to monitor APIs or cloud-based apps, Zabbix doesn’t make it easy. Other tools offer ready-made options, but with Zabbix, you have to build a lot on your own.
If you are spending more time configuring alerts than solving real problems, or if your team struggles with the UI and slow workflows, it might be time to explore better options.
In the next section, we will explore some of the top Zabbix alternative tools that can help you streamline your monitoring and give your team a much better experience.
Top Zabbix Alternative Tools
- Atatus
- Prometheus
- Netdata
- LibreNMS
- Icinga
- Datadog
- Dynatrace
- Paessler PRTG
- SolarWinds
- ManageEngine OpManager
- Checkmk
- Nagios
Before getting into the details of each tool, lets take a quick look at the overview table below to get a clear idea of the best Zabbix alternatives.
| Tool | Why it’s a good alternative to Zabbix | What it offers more than Zabbix | Best for |
|---|---|---|---|
| Atatus | Replaces Zabbix’s complex multi-tool setup with an all-in-one observability platform | APM, Infra, Logs in one place, modern UI, easy alert setup | DevOps teams, app developers, SREs, startups |
| Prometheus | Offers better metric handling, real-time alerting, and stronger container/K8s integration | Flexible PromQL queries, native Kubernetes support, robust alerting | Developers, SREs, Kubernetes environment |
| Netdata | Solves Zabbix’s slow visual feedback and heavy setup with real-time, out-of-the-box metrics | Live streaming metrics, instant dashboards, no config needed | Edge monitoring, DevOps, quick dashboards |
| LibreNMS | Ideal for replacing Zabbix’s limited SNMP features with strong network device discovery & visibility | Auto-discovery, mobile UI, customizable graphs | Network admins, IT infra teams |
| Icinga | Improves Zabbix’s usability issues with a cleaner UI and easier plugin-based monitoring | REST API, native plugins, modular architecture | IT teams using hybrid infra |
| Datadog | Replaces Zabbix’s steep learning curve and fragmented tools with a unified cloud-native solution | 600+ integrations, built-in APM, logs, anomaly detection | SaaS companies, fast-growing teams |
| Dynatrace | Eliminates manual configurations in Zabbix by offering AI-powered auto-discovery and full-stack visibility | Davis AI, code-level tracing, dynamic topology mapping | Enterprises, large-scale environment |
| Paessler PRTG | Offers a simpler alternative to Zabbix’s configuration-heavy setup with a sensor-based UI | Prebuilt sensors, drag-and-drop dashboards, traffic flow monitoring | SMBs, network & system admins |
| SolarWinds | Delivers more advanced network analytics and visual topology than Zabbix’s basic infra monitoring | NetPath, AppStack, detailed reports | Enterprises, IT service providers |
| ManageEngine OpManager | Offers better out-of-the-box network insights and UI over Zabbix’s basic interface | Bandwidth analysis, alert escalation policies, device-based dashboards | IT teams in mid-sized businesses |
| Checkmk | A more manageable alternative to Zabbix for traditional infra, with quicker rule-based monitoring | Auto-discovery, hybrid support, simpler rule management | Traditional IT teams |
| Nagios | Familiar Nagios users find it easier than moving to Zabbix’s more complex but similar architecture | Proven base, active community, many plugins | Teams already used to Nagios structure |
1. Atatus
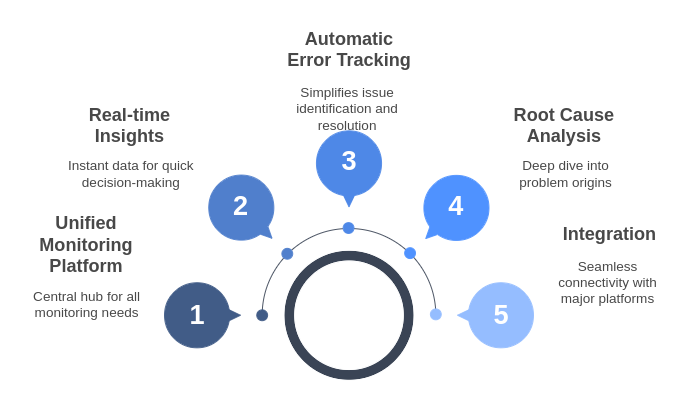
Atatus, a great Zabbix alternative is a performance monitoring tool that offers deep, real-time insights into your applications, infrastructure, and logs. Unlike traditional monitoring tools, Atatus combines everything you need into one unified platform, helping you track application performance, monitor servers, and manage logs with minimal setup.
It simplifies monitoring with powerful features like automatic error tracking, root cause analysis, and real-time metrics. It integrates seamlessly with major platforms and scales effortlessly as your infrastructure grows, whether cloud-based, on-premise, or hybrid.
Atatus replaces Zabbix by removing the complexity and manual setup Zabbix often requires. It provides out-of-the-box dashboards, allowing you to instantly track performance across your entire system.
With features like real-time monitoring and root cause analysis, Atatus helps you pinpoint and resolve issues much faster than Zabbix, which typically involves more manual troubleshooting.
The intuitive interface and instant notifications, integrated with platforms like Slack and email, make it easier to stay on top of performance, ensuring quicker resolutions and a smoother monitoring experience.
Key benefits of switching to Atatus:
- Zero-maintenance monitoring that scales automatically with your infrastructure.
- Instant real-time alerts and insights, ensuring faster issue resolution.
- User-friendly dashboards and intuitive reporting for easy decision-making.
- Out-of-the-box integrations with major platforms like AWS, Azure, and Google Cloud.
2. Prometheus
Prometheus is an open-source monitoring and alerting toolkit designed for reliability and scalability. It’s known for its pull-based time-series data collection, powerful query language (PromQL), and deep integration with Kubernetes and containerized systems. Ideal for developers and SREs, Prometheus works well in dynamic environments where metrics matter most.
Key benefits of switching to Prometheus:
- Advanced metric collection with high flexibility and customizability.
- Strong support for containerized and microservices architectures.
- Lightweight, modular, and can be scaled horizontally.
- Extensive community support and Grafana compatibility for visualization.
3. Netdata
Netdata is a high-resolution performance monitoring tool that offers real-time metrics and beautiful visualizations out of the box. It provides per-second insights across thousands of metrics for systems, apps, and containers. With zero configuration required, Netdata is ideal for users who want instant visibility with minimal overhead.
Key benefits of switching to Netdata:
- Real-time performance metrics with per-second granularity.
- Installs in minutes with no complex setup or tuning.
- Beautiful, interactive dashboards by default.
- Great for single-node and edge server monitoring.
4. LibreNMS
LibreNMS is a free, open-source network monitoring system with auto-discovery and device support for SNMP, IPMI, and more. As a Zabbix alternative, it offers customizable dashboards, alerting, and multi-user support. With strong community backing, LibreNMS is often chosen for its flexibility and focus on network monitoring.
Key benefits of switching to LibreNMS:
- Strong SNMP-based network device monitoring.
- Auto-discovery reduces manual device setup.
- Intuitive web UI and robust alerting capabilities.
- Open-source and self-hosted with community plugins.
5. Icinga
Icinga is an enterprise-grade infrastructure and service monitoring tool, designed to provide high availability and performance insight. It builds upon Nagios but with a modern UI, scalable architecture, and integrations for cloud, containers, and APIs. It’s great for users seeking detailed service monitoring with flexibility.
Key benefits of switching to Icinga:
- Modern interface with advanced reporting features.
- Scales well in distributed environments.
- Powerful monitoring logic inherited from Nagios with improvements.
- Flexible plugin and API support for deeper integrations.
6. Datadog
Datadog is a modern observability platform that brings together infrastructure metrics, application performance, logs, and security data into one pane of glass. With AI-powered alerts, ready-made dashboards, and 500+ integrations, it’s built for enterprises and fast-moving DevOps teams.
Key benefits of switching to Datadog:
- Unified monitoring with rich visualizations and AI-powered insights.
- Seamless integration with cloud providers and CI/CD pipelines.
- Fast setup with auto-discovery and out-of-the-box dashboards.
- Scalable and trusted by large-scale enterprises.
7. Dynatrace
Dynatrace offers AI-powered observability with deep application insights, infrastructure monitoring, digital experience tracking, and automation. It auto-discovers your entire tech stack and provides precise root cause analysis using its Davis AI engine.
Key benefits of switching to Dynatrace:
- Full-stack observability with AI-driven anomaly detection.
- Precise root cause pinpointing with no manual digging.
- Auto-instrumentation reduces setup time.
- Ideal for enterprise-scale and hybrid cloud environments.
8. Paessler PRTG
PRTG by Paessler is an all-in-one network monitoring tool that uses sensors to track device uptime, traffic, performance, and applications. Its flexible licensing and clean interface make it suitable for SMBs and mid-sized enterprises.
Key benefits of switching to PRTG:
- Sensor-based pricing lets you control costs easily.
- Excellent for network health and device monitoring.
- Simple interface with quick deployment.
- SNMP, WMI, and packet sniffing support built-in.
9. SolarWinds
SolarWinds provides a suite of IT operations and infrastructure monitoring tools, widely known for its Network Performance Monitor (NPM). It offers end-to-end network visibility, advanced alerting, and historical trend analysis suited for large networks.
Key benefits of switching to SolarWinds:
- Deep network diagnostics and topology mapping.
- Highly customizable alerting and reporting.
- Scalable for enterprise-grade IT infrastructure.
- Trusted by network admins in regulated industries.
10. ManageEngine OpManager
OpManager by ManageEngine is an IT operations platform that provides real-time network monitoring, server health insights, and fault detection. With built-in workflow automation and customizable dashboards, it’s tailored for IT teams managing multi-vendor networks.
Key benefits of switching to OpManager:
- Easy-to-navigate UI with real-time infrastructure visibility.
- Strong SNMP support and device auto-discovery.
- Integrated with ITSM, firewall, and flow analytics tools.
- Suitable for hybrid environments and growing IT teams.
11. Checkmk
Checkmk is a powerful infrastructure monitoring solution that supports monitoring of servers, containers, applications, and networks. With smart auto-discovery, rapid deployment, and scalable architecture, it's ideal for both SMBs and enterprises.
Key benefits of switching to Checkmk:
- High performance with low resource consumption.
- Auto-discovery for services, hosts, and containers.
- Easy migration path from Nagios-based systems.
- Flexible plugin support and extensibility.
12. Nagios
Nagios is one of the earliest and most well-known open-source infrastructure monitoring tools. It monitors servers, switches, applications, and services using a modular plugin-based architecture. Though powerful, it often requires extensive configuration.
Key benefits of switching to Nagios:
- Proven, stable, and battle-tested for infrastructure monitoring.
- Highly customizable via plugins and community modules.
- Great visibility across large on-premise setups.
- Strong community support and documentation.
Get Started with Atatus
Ready to experience monitoring without the complexity? With Atatus, you can start tracking your applications, servers, and logs in just a few clicks, no lengthy setup or steep learning curve. Sign up for a free trial, explore prebuilt dashboards, and see how quickly you can gain full visibility into your systems.
#1 Solution for Logs, Traces & Metrics
![]() APM
APM
![]() Kubernetes
Kubernetes
![]() Logs
Logs
![]() Synthetics
Synthetics
![]() RUM
RUM
![]() Serverless
Serverless
![]() Security
Security
![]() More
More