Why Application Performance Monitoring (APM) Tool Is Important?
Modern applications must deliver not only value but also round-the-clock availability, quick replies, and real-time problem-solving in today's digital economy. Since all businesses rely on software applications, their performance is one of their primary worries and frustrations, especially if their applications are the business itself. This is where Application Performance Monitoring Tool enters the scene.
This article digs into what an APM tool is, types of APM tools, common APM features, and why and how to utilize it to help you troubleshoot performance issues quickly and assure a flawless user experience.
We will cover the following:
- What is Application Performance Monitoring?
- Types of APM Tool
- Features of APM
- How does APM Work?
- Components of APM
- Why Do You Need Application Performance Monitoring?
- What will be Important in the World of APM in the Future?
- Use Cases for Application Performance Monitoring
- Why Should You Use Atatus for APM?
What is Application Performance Monitoring?
Application performance monitoring (APM) is a set of tools and processes that help IT professionals ensure that the applications they use meet performance requirements and provide a favorable user experience (UX). It is a subset of application performance management, which is a more generic phrase.
While application performance monitoring is limited to measuring an application's performance, application performance management includes the broader idea of controlling an application's performance levels, which includes monitoring.

An effective application performance monitoring system must include infrastructure monitoring, as well as tracking the user experience, application dependencies, and business transactions. Administrators can use APM tools to quickly discover, isolate, and rectify issues that can degrade an application's performance.
IT professionals can use performance metrics collected by an APM tool from a single application or multiple applications on the same network to locate the source of a problem. Client CPU utilization, memory demands, data throughput, and bandwidth use are among the data collected by APM tools.
Types of APM Tool
APM tools can be categorized in a variety of ways depending on what they perform.
- Application Metrics-based APM Tools
Many application and server-related metrics are collected by these APM solutions. The APM tool then uses this information to figure out which of your application's URL requests are taking too long. Since they don't profile the application's code, they can't tell you what's causing the slowdown. Popular APM tools don't usually track just application metrics. - Code Profiling-based APM Tools
These APM tools can help you discover the source of a performance problem by using code profiling and transaction tracing. Many popular APM solutions profile various code types using domain-specific artificial intelligence and machine learning approaches. It assists them in finding the root cause of any performance issue when combined with application analytics. - Network-based APM Tools
These APM solutions focus on network traffic to monitor application performance. Only a few APM tools can handle it because it requires very specific methodologies. As a result, Network Performance Monitoring has evolved as a new product category.
Features of APM
Some of the most useful features enabled by APM software are listed below.
- Application Dependencies Performance
An issue with one of your application's dependencies, such as the database, caching, web server, or a third-party service, can cause it to be slow. A slow database query or server, for example, can degrade the overall performance of your application. External HTTP web services and cache issues can also result in the same outcome. As a result, it's crucial to keep track of not only the application but also all of its dependencies. - Application Errors
For locating application issues, errors are the first line of defense. We want to detect and repair the errors, or at the very least understand them, before our customers tell us about them. In an application performance management system, developers require excellent error tracking, reporting, and alerting. We recommend that you fix alerts for brand new exceptions and monitor general error rates. When you're getting ready for production, monitor your error dashboards to see if any new issues have surfaced. You’ll likely discover a new error, which you'll swiftly correct. - Application Log Data
The first thing a developer will say when anything goes wrong in production is "give me the logs." Developers' eyes and ears are often logged information once their applications are deployed. Developers seek a centralized logging solution, such as a log management platform, to give them access to their logs. - Basic Server Monitoring and Metrics
Issues with applications might arise for a variety of reasons. A server falling isn't as common as it once was due to virtualization and the cloud. However, it will still happen, and it is something you should monitor. It's also critical to monitor things like the server's CPU and memory. Although many recent web applications are not CPU-bound, they will still consume a significant amount of CPU, which is a useful indicator for auto-scaling your application in the cloud. - Code-Level Performance Profiling
You must dig right down to the code level if you want to figure out why your application is slow, generating errors, or has issues. It's critical to understand why an explicit request doesn't work, and it's rather simple to do so. It's difficult and exhausting to figure out why something doesn't function. - Real User Monitoring (RUM)
Another important component of APM that developers use to monitor their applications is real user monitoring (RUM). It's critical to understand how your applications function on the server-side. On the other hand, today’s applications use JavaScript, and it's critical to keep track of how long it takes their browser to fully load and render your web content. A simple JavaScript error or a slow-loading file can completely ruin your application. - Web Requests and Transactions Performance
The ability to measure the performance of each request and transaction in your application is at the heart of APM. You'll use this to figure out which requests are the most popular, which are the slowest, and which you should prioritize by increasing your backlog. However, understanding the performance of each request is only the beginning. A server access log could provide this information. Understanding why is the actual key.
How does APM Work?
Application performance monitoring looks at how well applications perform and if they're working properly. If the applications aren't performing properly, data is collected to identify the source of the problem, the data is analyzed in light of its business impact, and the application environment is corrected to avoid complications.
When developing an APM solution, three sorts of data should be examined: metrics, traces, and log files.

A metric is a numerical value that can be used to determine a process' present state. To assess the status of a system or process, metrics are frequently compared to a defined baseline. Changing measurements are a common sign of a greater issue.
A trace is a record of how a request was processed from beginning to end. A trace is a tool for visualizing and comprehending a request's entire path via all of the network's components and services. A trace contains hundreds of data points that can be used to discover and isolate network issues, diagnose security concerns, and indicate errors.
Log files are created by an application or operating system and contain information about user behavior and events that occurred on the application. Log files are used for root cause analysis, understanding why a metric changed, and establishing where an incident began.
Some of the most critical application monitoring metrics are as follows:
- Application Availability and Uptime
It determines whether the application is online and accessible to users; it's typically used to determine if an organization's SLA is being met. - CPU Usage
It keeps track of CPU utilization, disk read/write speeds, and memory demands to see if they're affecting application performance. - Customer Satisfaction
It indicates how clients feel about the application in comparison to a pre-determined benchmark. - Error Rates
It keeps track of how the application deteriorates or fails at the software level. - Number of Instances
It keeps track of how many server or application instances are active at any given time. This is especially true in the case of cloud-based applications. - Request Rates
It monitors the amount of traffic that the application receives to spot any notable increases, declines, or concurrent users. - Web Performance Monitoring
It measures the average response time for end-user interactions to assess if speed has an impact on application performance.
Components of APM
Application performance monitoring monitors five major components of an application's performance:
- Analytics and Reporting
It entails converting the information acquired from the preceding steps into a performance baseline that can be used to set an expectation for regular application performance using historical and current data. It compares infrastructure changes to performance changes to discover possible areas for improvement. Using historical and baseline data, can also quickly identify, locate, and rectify performance issues. The analytics and reporting components are critical to achieving a positive return on investment (ROI) for the organization. - Business Transactions
It focuses on studying specific user interactions and replicating them to test and understand the variables that contribute to a performance problem, also known as user-defined transaction profiling. This procedure will help businesses in tracing events as they flow through the application's many components, as well as revealing when and where events occur — and whether or not performance efficiency is optimized. - Component Monitoring
It entails tracking all IT infrastructure components and is also known as an application component deep dive. All used resources and experienced events within the application performance infrastructure are subjected to extensive, in-depth monitoring, which includes an examination of all servers, operating systems, middleware, application components, and network components. Component monitoring provides a deeper understanding of the many elements and pathways uncovered during the preceding methods. - Real User Monitoring
It captures user-based performance data to assess how well the application is running for users and to gauge potential performance concerns, also known as end-user experience monitoring. Real-time user monitoring allows a company to quickly respond to issues and understand their consequences. - Runtime Application Architecture
It looks at the hardware and software components that go into running the application, as well as the portions that they communicate with. By observing patterns and diagnosing performance issues before they arise, IT experts can foresee future problems.
Why Do You Need Application Performance Monitoring?
Avoiding downtime and monitoring the availability, response time, and behavior of every business transaction is critical in the digital economy.
Detect Applications Slow Down
When your application is slow, you need to figure out why it's slow, how long it's been slow, and what's causing it. That would be simple if modern software applications didn't have such complex structures as highly distributed, multi-tier, multi-element architectures based on application development frameworks.
While this helps in the development of better software applications, it makes performance management and monitoring more challenging if you rely on traditional monitoring approaches like ping tests or server-level data (network activity, memory, CPU, disk usage, etc.).
When working with a distributed application, these techniques can't help you examine the interdependencies between components. Logs, metrics, and events are all over the place – in the cloud, across clouds, and in hybrid clouds – and can be difficult to identify and manage, making it difficult to figure out why your application is slow.
Ensure End-to-End Visibility of Your Application
Synthetic transactions, manual instrumentation of the code, and client feedback are all options for avoiding application monitoring. While these are important for monitoring, they require more configuration to deliver the same benefits as an APM solution.
This would require a significant amount of effort and money. A comprehensive APM solution, on the other hand, gives you end-to-end visibility into how your application works without requiring you to put in any more effort.
What will be Important in the World of APM in the Future?
APM solutions are always developing to keep up with the demands of the fast-changing technologies we use to construct applications. We're on the verge of a huge shift that will propel APM forward to the next stage of its evolution at the time of writing.
Observability and OpenTelemetry are the two driving forces behind this transition, which can be considered to go hand in hand at a high level.
Observability has a fuzzy definition, but it's roughly equivalent to APM on steroids. Observability, which is driven by the advanced needs of DevOps and SRE teams, delivers the raw, granular data required to acquire a thorough knowledge of complex and highly distributed systems (usually characterized as M.E.L.T (metrics, events, logs, and traces)). When issues develop, you'll be able to cut MTTR even more with this fine-grained understanding of how applications and systems should perform.
Isn't that fantastic?

However, obtaining the associated M.E.L.T data required to make this a reality is incredibly difficult. This is where OpenTelemetry comes in.
OpenTelemetry is a vendor-agnostic telemetry data collection standard for applications, their supporting infrastructures, and services. It provides a consistent collection technique and format for understanding and validating performance across even the most complex distributed systems.
While observability and OpenTelemetry are still in their early stages, they are both examples of the industry's continual efforts to reduce complexity and ensure that applications are always providing better digital experiences and business outcomes.
Use Cases for Application Performance Monitoring
Here are some actual instances of how application performance monitoring can benefit different websites.
SaaS
Software as a Service (SaaS) is a method of delivering software to users directly through browsers or applications. It's becoming the preferred delivery method for many popular applications, particularly those offered by large companies.
Since SaaS users often spend a lot of time with the application, they want it to constantly work effectively. Users can quickly move to another SaaS provider if they are unhappy with your SaaS software. As a result, SaaS applications must sustain their performance under any load to succeed.
SaaS applications must additionally draw in dozens of assets from various third-party domains due to the highly dynamic and interactive web pages demand. As a result, in terms of server-side code and the network infrastructure utilized to provide them, they're more difficult to manage.
Business and Enterprise Websites
A website can be used by large organizations and enterprises to exhibit their products and services to millions of potential clients throughout the world. Using blogs to publish relevant information can also help you gain public attention and build brand loyalty.
Localization, multilingual content, and a network of smaller microsites are popular characteristics of company websites. They frequently demand elaborate role-based access requirements as well, all of which can make the website's technological architecture more complicated.
Serving such a website in many languages to millions of foreign consumers is a significant undertaking. Even more difficult is doing it efficiently without jeopardizing the company's workflow and business goals.
First and foremost, it requires an enterprise-grade hosting infrastructure backed by a world-class technical support team. Second, to ensure that website visitors have the best possible experience, businesses must closely monitor every user interaction on their website. Last but not least, it must be safe, scalable, and dependable.
Why Should You Use Atatus for APM?

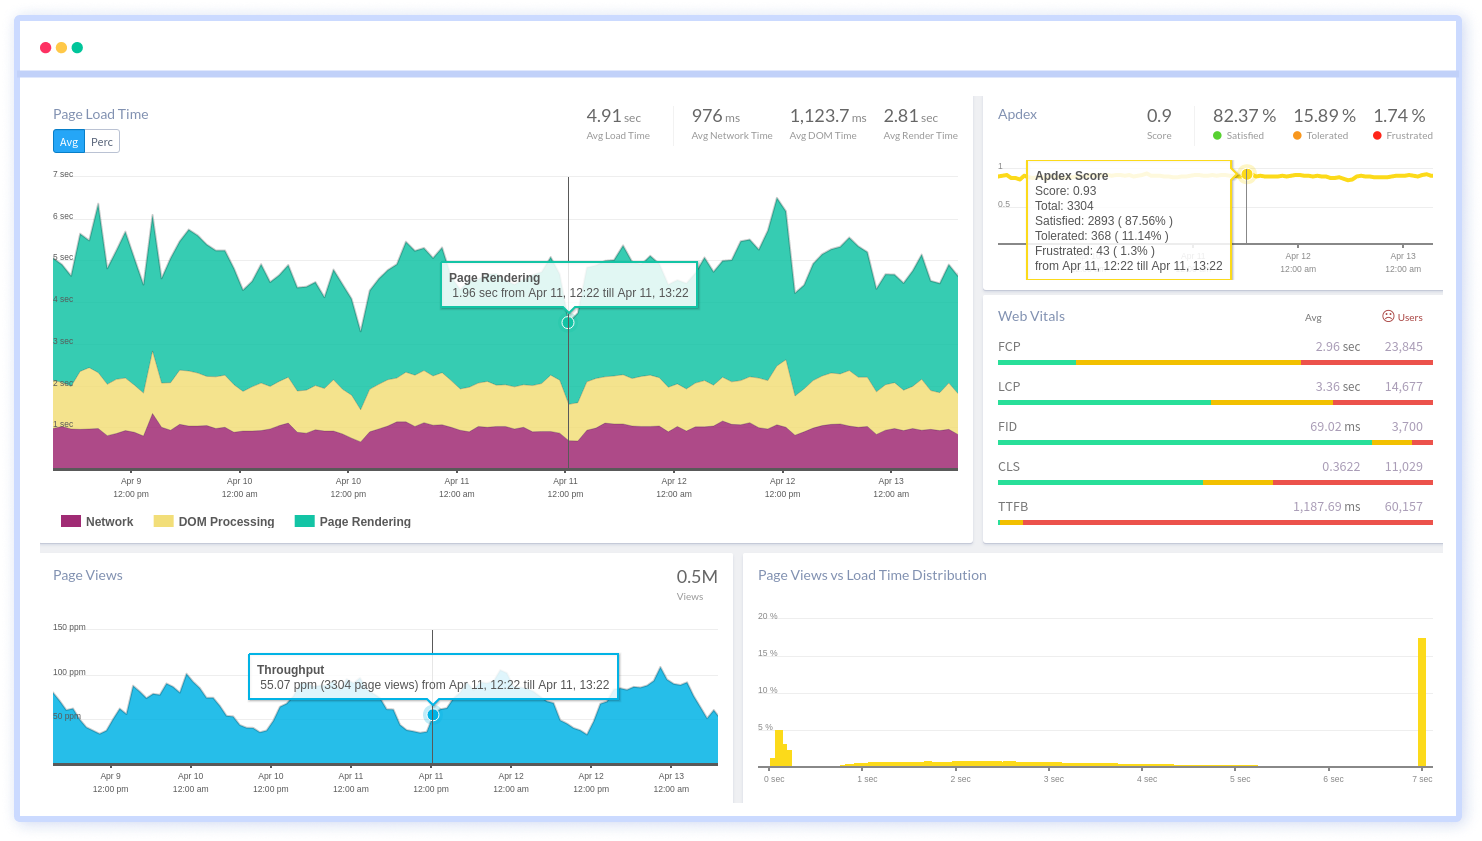
Atatus is a Full Stack Observability Platform. With application performance monitoring, you can diagnose, troubleshoot, and fix your application while improving dependability and time to market. The Atatus APM tool allows you to spot issues at the appropriate moment.
Using Real User Monitoring, you can obtain end-to-end insight on your end-experience, user's including Core Web Vitals, and see how the web performs across devices, countries, applications, and more to resolve issues.

You'll be able to see how your system operates in real-time and receive a detailed picture of the health and utilization of your servers and hosts. You can get server infrastructure monitoring metrics and fix issues before they affect your servers.

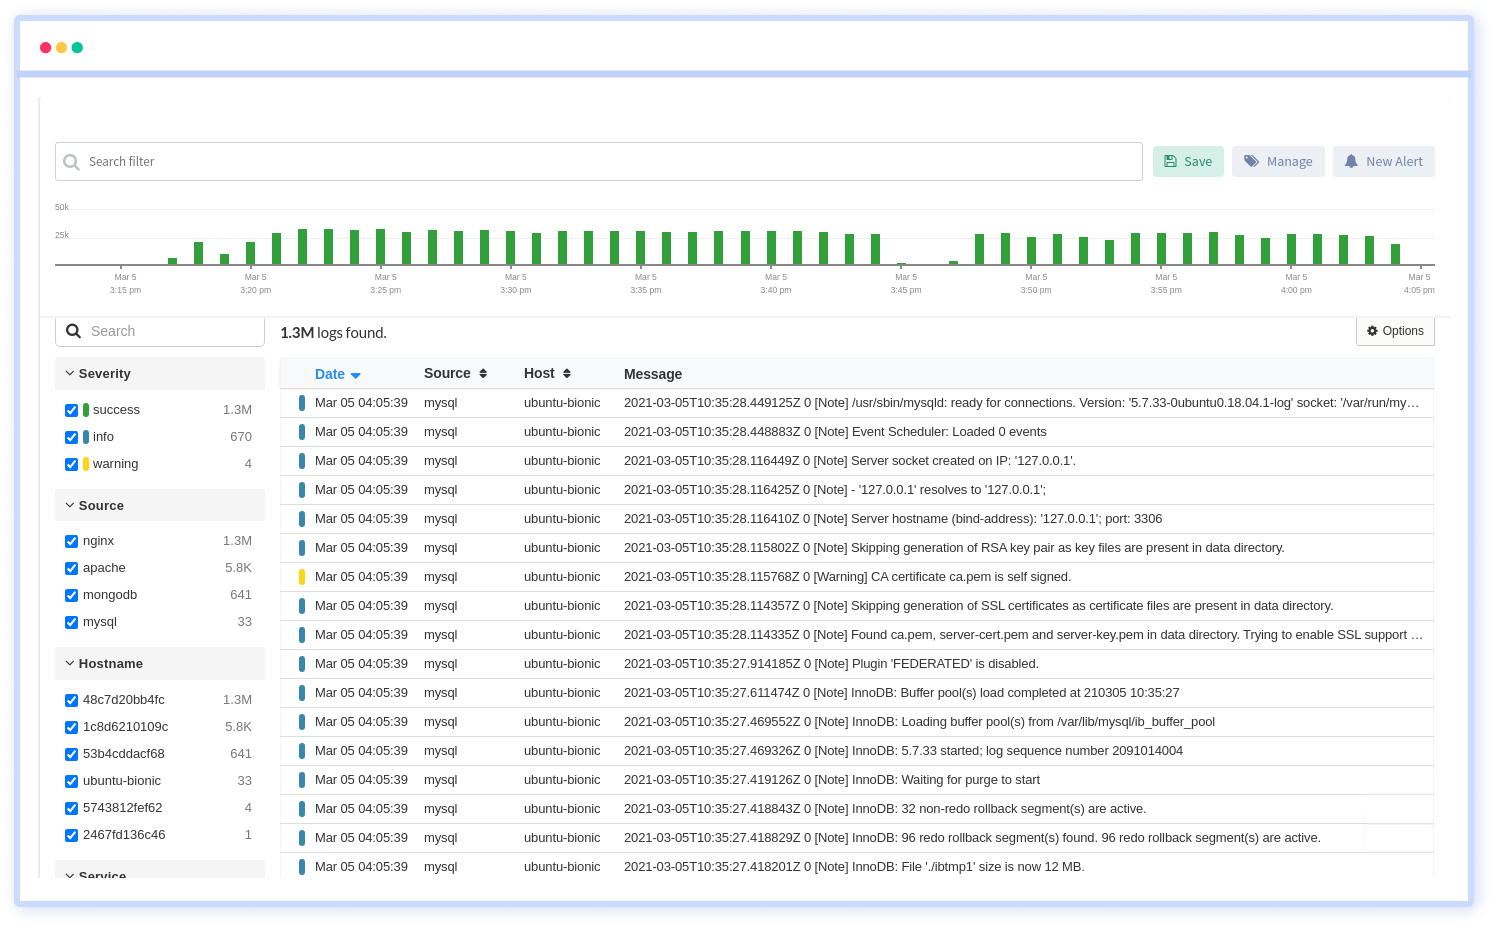
You can detect and fix issues with Log Monitoring by analyzing log analytics with a fast and simple search. You can able to monitor all of your log files data that is dispersed across multiple platforms.

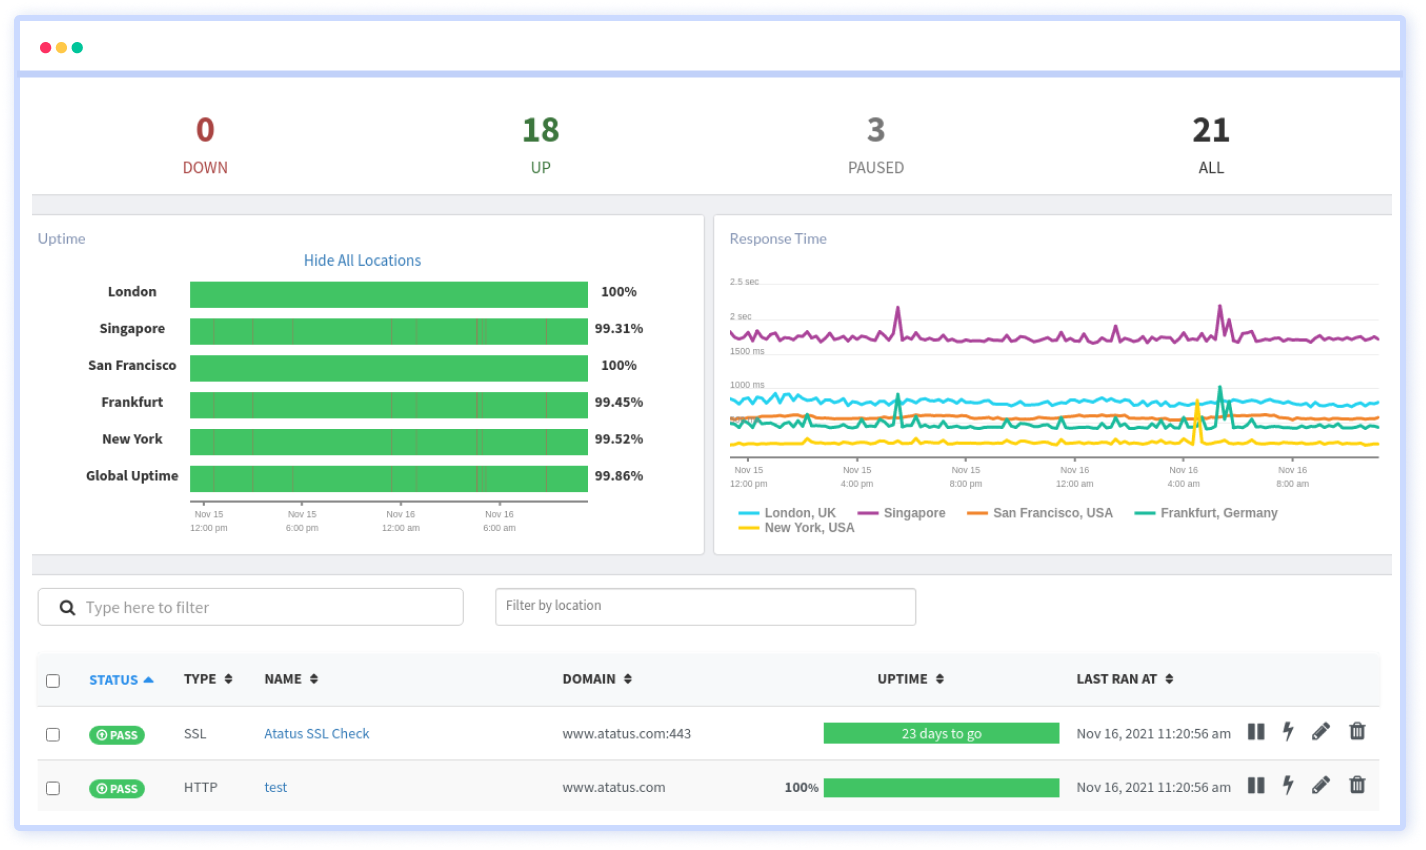
Use Atatus Synthetic Monitoring to ping your website to see if it's up, slow, or experiencing downtime before your end-users do. With in-depth actionable API data, you can monitor how your APIs are working and how your customers are utilizing them.
Conclusion
The risk of application downtime increases as businesses undergo digital transformations such as cloud migration and container orchestration, making application performance management and monitoring more crucial than ever.
When it comes to troubleshooting application performance issues, the APM tool makes it simple to discover the needle in the haystack. Furthermore, the APM tool will proactively monitor your applications' code, requests, responses, user experiences, and other aspects.
If you run a SaaS business, APM is a must to assure the availability of software applications. APM tools can help DevOps understand how application releases impact service performance, security, and dependability. They enable teams to set up alerts to detect and rectify issues before they negatively impact the user experience, as well as automate actions based on certain events, patterns, and trends.
If you are not yet an Atatus customer, you can sign up for a 14-day free trial.
#1 Solution for Logs, Traces & Metrics
APM
Kubernetes
Logs
Synthetics
RUM
Serverless
Security
More


![New Relic vs Splunk - In-depth Comparison [2025]](/blog/content/images/size/w960/2024/10/Datadog-vs-sentry--19-.png)
![New Relic vs Sentry - Which Monitoring Tool to Choose? [2025]](/blog/content/images/size/w960/2024/10/VS--1-.png)
