What is Real User Monitoring?
Choosing the appropriate tools and approaches to utilize for application performance management can quickly become confusing. That's why it's important to remember that the ultimate goal of monitoring is to figure out two things:
- How your website or mobile application is being used by your end-users?
- How can such data be turned into meaningful insights in order to meet DevOps and business objectives?
And there may be no better beginning point than incorporating real-user monitoring (RUM) using a performance monitoring solution to get as close as feasible to meet both objectives.
Here we will cover the following:
- What is Real User Monitoring?
- Steps In Real User Monitoring
- How Real User Monitoring Works?
- Real User Monitoring Vs Synthetic Monitoring
- Benefits Of Real User Monitoring
- Limitations Of Real User Monitoring
- Atatus Real User Monitoring
- Practices For Real User Monitoring
What is Real User Monitoring?
Real User Monitoring (RUM) is a passive technique to website performance monitoring that collects and reports data from the site's actual users. It is a service that collects performance data passively from end-user browsers when they connect to a website or web service and creates reports based on the visitors' interactions with the page.
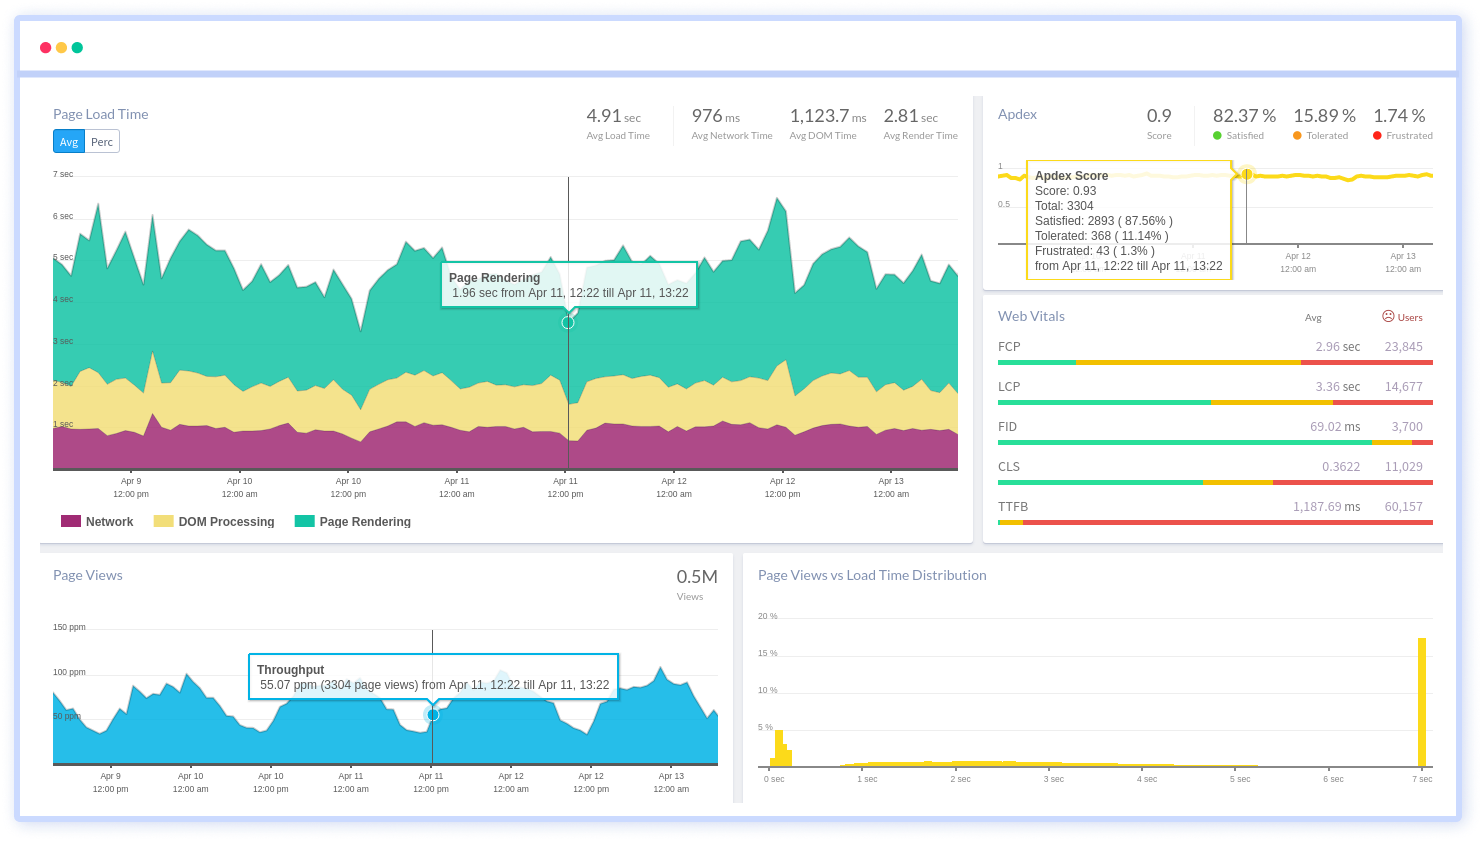
The reports provide DevOps with information about the performance of the webpage depending on end-user environment variables including location, device, operating system, and browser. Real User Monitoring is particularly useful for detecting issues caused by site updates and upgrades early on. The following information was gathered:
- Loading time to the first byte and page ready time
- Redirects, DNS, and the time it takes to connect
- Send and receive times on the backend
- Frontend Document Object Model (DOM) and Render Time
It's a type of passive monitoring that relies on Web-monitoring services to continuously observe your system in operation, measuring availability, functionality, and responsiveness. It's also known as end-user experience monitoring (EUM), real-user measurement, or real-user metrics.
Steps In Real User Monitoring?
RUM looks at how easy it is for users to interact with the cloud, mobile, and web-based applications. It then generates a performance report that may be used to troubleshoot and resolve any infrastructure or user issues that have been found.
It enables the recording of live sessions as well as the monitoring of user experience at several levels. We may use it to track which pages a consumer visits, look at response times, and identify when and where certain pages go down.
Step 1: Data Capture
Even when the requested content is housed on other sites, it gathers details about requests for pages, JSON, and other resources from the browser to web servers.
Step 2: Sessionization
Sessionization is a term that refers to the process of separating each visit's data and is reassembled into a record that includes pages, components, and timing information.
Step 3: Detection of a Problem
For different sites, pages, and visits, any odd behaviour such as delayed response times, system difficulties, web navigation issues, and other malfunctions are investigated.
Step 4: Reporting on Individual Visits
Individual visits are recreated using the data collected. We can view exactly what the user viewed in some programs. We see a summary of the data with others.
Step 5: Reporting and Segmentation are Two Important Aspects of Every Business
Page availability and performance can be identified using aggregated data across multiple browsers and user segments.
Step 6: Alert
When a major problem is detected, the system triggers an alarm mechanism.
How Real User Monitoring Works?
Because the service must wait for page visits before collecting any data, real user monitoring is considered a passive sort of monitoring, whereas active monitoring, also known as Synthetic Monitoring, simulates the user and starts page interactions on a frequent basis.
Real User Monitoring can be done in a variety of ways, including server-side collection (which usually employs cookies), browser-side collection (JavaScript or agents), or a combination of server-side and browser-side methods. The RUM solution employed is usually dictated by what needs to be measured. Because the browser initiates the request, a JavaScript file loaded on the visitor's browser makes the most sense for assessing page load performance.
The process of acquiring and presenting data is divided into five steps:
- Load: Asynchronous loading of the little script file found in the tags of the monitored pages.
- Record: As the page loads, the script file collects performance data.
- Send: After the page has finished loading, the script file uses a secure connection to send the data back to the monitoring service's servers.
- Process: The data is queued for processing by the servers. At peak times, the servers pull performance data, user environment information, and other meta-data from the databases in seconds or minutes.
- Aggregation: When data is retrieved for reporting, the servers categorize the results by page visited, location, browser (type and version), operating system (type and version), and device type.
While certain "bottom-up" versions of RUM rely on recording server-side data to reconstruct end-user experience, "top-down" client-side RUM may directly observe how real people interact with your app and what their experience is like. Top-down RUM focuses on the direct relationship between site speed and user satisfaction by employing local agents or small bits of JavaScript to evaluate site performance and dependability from the perspective of client apps and browsers. This provides vital information into ways you may optimize your application's components and enhance overall performance.
Real User Monitoring Vs Synthetic Monitoring
Synthetic Monitoring is a type of online monitoring that is done invisibly. We call it "passive" because it relies on background services that monitor the system's availability, functioning, and responsiveness.
Real User Monitoring, on the other hand, is active web monitoring. Behavioural scripts are deployed in a browser to replicate the path an end-user takes through a website in synthetic monitoring.
This passive monitoring also allows webmasters to test the application before it goes live as well as how it behaves from different locations without a real user testing it. As a result, it's a must-have feature for sites with a lot of visitors. RUM, unlike synthetic monitoring, does not take a break. It gathers information from real users who makes a request using any browser
Unlike passive or synthetic monitoring, which tries to acquire Web performance insights by testing simulated interactions on a regular basis, RUM eliminates the guesswork by observing how your users engage with or are stopped from interacting with your website or application. RUM provides a deep, top-down view of a wide range of front-end browser, backend database, and server-level issues as they are actually experienced by all of your end-users, everywhere, from page load times to traffic bottlenecks to worldwide DNS resolution delays.
Benefits Of Real User Monitoring
RUM can assist in determining how visitors use a website or app. It also provides page metrics like load time for the page, object, and even individual visit analysis.
- Targets for Service Levels can be Easily Measured
By tracking actual visitors and supplying top-level statistics on actual use cases, it provides a real-world measurement of critical targets. - Problems will be Identify Easily and Issues will be Prioritized More Effectively
It has the ability to replay user sessions and monitor transaction pathways in order to uncover hidden issues. - Determine Network and Page-level Hiccups
Problems with a website's lower layers can be difficult to spot, like needles in a haystack. It can bring these issues to light, even if they're infrequent or caused by unusual circumstances. - Segmentation of Data
Because not everyone uses the same browsers, connection types, and other factors, limiting your speed enhancements or testing to a single operating system, browser, location, or other factor doesn't cover the majority of users who will interact with your website or Webapp.
Limitations of Real User Monitoring
RUM does have certain drawbacks, despite its many advantages. When the procedure is combined with synthetic monitoring, the gaps are nicely filled.
- There is no benchmarking. RUM is unable to investigate the websites of your competitors. As a result, comparing your site's performance against that of others is challenging.
- In pre-production circumstances, effectiveness is restricted. It's not that RUM doesn't work in pre-production environments (it does), but most clients don't have a lot of traffic there.
- There is an excessive amount of data. Even with some of the better-prepackaged solutions on the market, some users complain that combing through the sheer number of data supplied can be difficult.
Atatus Real User Monitoring

RUM is supported by a number of different tools. Atatus delivers real-time monitoring solution that allows you to see which areas of your website are performing poorly and affecting your end consumers. Learn about your frontend's performance and issues, as well as how to optimize the user experience.
We collect crucial performance data for Google's Core Web Vitals and Other Web Vitals that can help you figure out what's causing slow performance at the user level if they're having trouble engaging with the page, experiencing unexpected changes, or loading times are slow.
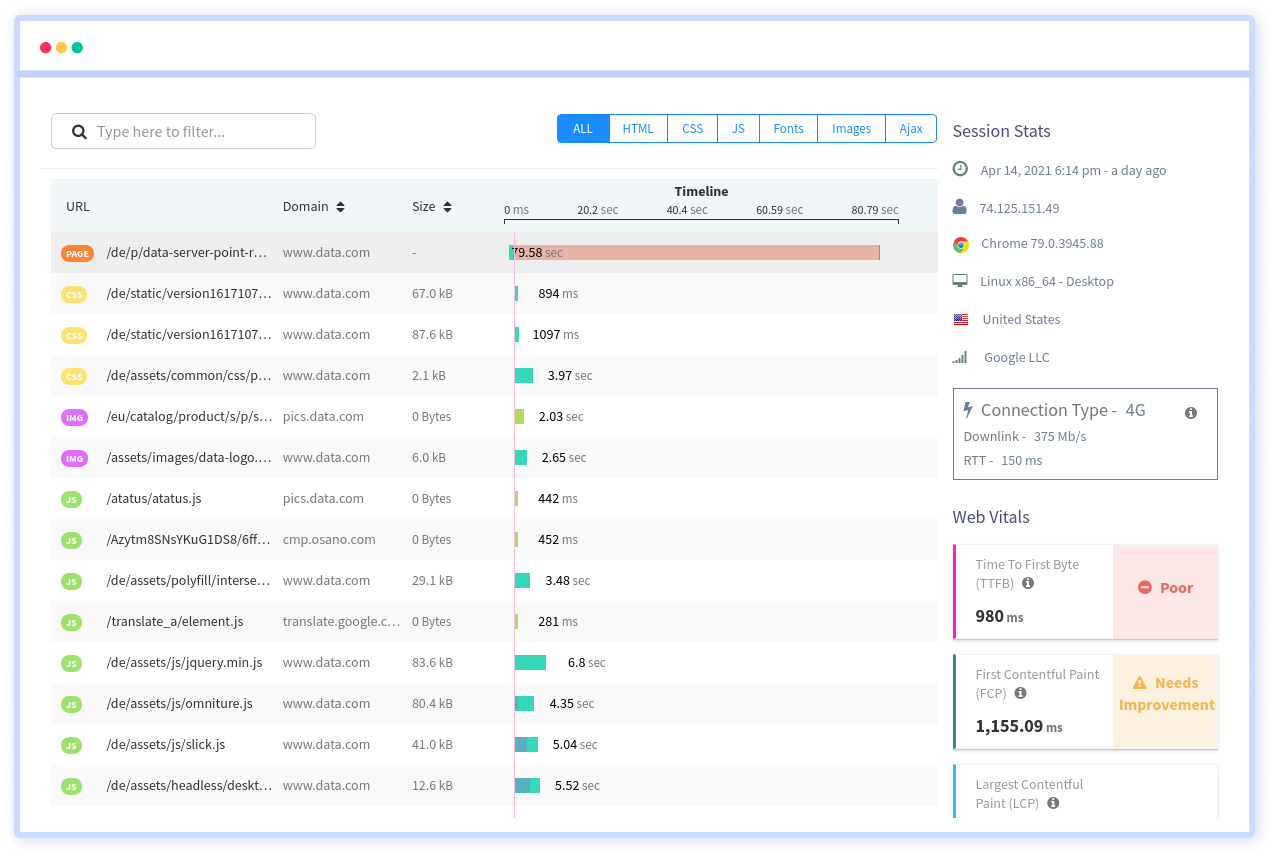
To quickly discover and repair front-end performance issues affecting real users, get a complete view of each page-load event. Filter Data by URL, connection type (2G, 3G, 4G), device, country, and more to see which assets are slowing down your websites in a detailed full resource waterfall view.

Gain insight into performance and user behaviour without having to wait for a page to load. The View Single Page Application route alters performance without relying on the JavaScript framework, demonstrating how user interactions affect the user's experience after the page loaded.
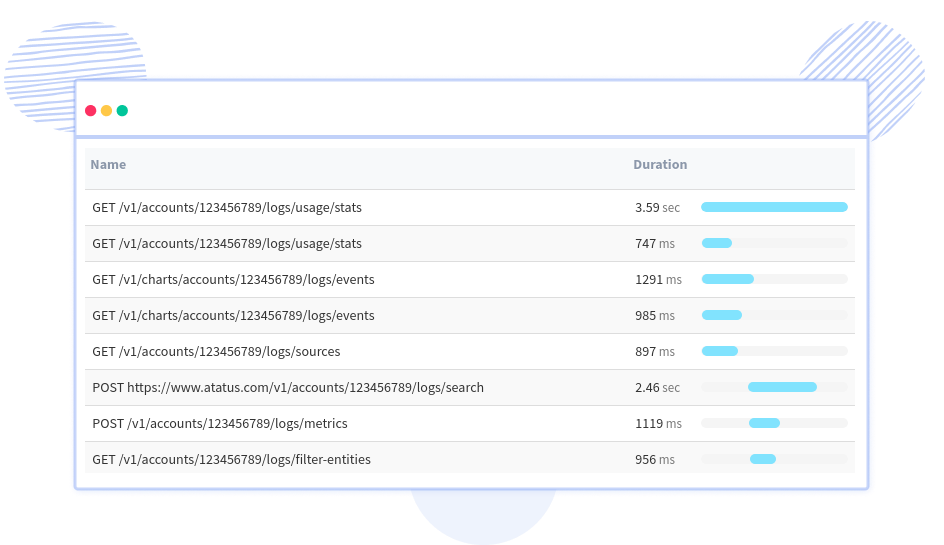
With in-depth insights on response time, call-back time, throughput, HTTP failures, data transfer size, and more, you can figure out which page visits are calling the server-side controller. Understand how these sluggish AJAX requests affect page load time and the user's digital experience.

Visualize each user's whole digital experience, including long load times, particular issues, asset performance, web vitals, DNS, SSL connection, and more. Session Traces gives your company the information it needs to understand user experiences and align business and development.
Example Of Real User Monitoring
In the real world, it's used to keep an eye on apps and websites in order to spot issues that other testing methods miss. Here are several examples:
- Continuous background monitoring of a blog to see when and where page load times increase. A developer may discover that traffic increases during peak hours resulting in an increase in timeouts, leading to unhappy consumers and poorer Google ranks.
- It may be used by an end-user portal, such as a bank software system, to detect intermittent difficulties, such as login failures that occur only in specific, unusual circumstances.
- Real-User Monitoring allows a Tech Lead to immediately examine the application's health.
- It could be used by an app developer to identify platform faults that aren't visible during pre-deployment testing.
- A development team can utilize RUM to debug difficulties generated by deployment by using filters to narrow down the surface search.
- Product managers who don't have a lot of coding experience can utilize RUM tools' dashboards to detect when high-priority pages are performing poorly and then allocate resources efficiently to fix the problem.
Practices Of Real User Monitoring
You can get the most out of real user monitoring by following a few best practices:
- Examine the Website's Current Speed
Paying attention to load time data is critical since faster websites lead to increased client engagement. - Identify and Track Specific Goals
As a result, you'll be able to connect your aims with your company's aims. - Benchmark Your Website's or Application's Performance
To get your site's or app's performance where you want it, you must first understand where it's coming from. Because speed leads to increased consumer engagement, take a baseline reading of your site's load time, bounce rate, and other real-user metrics to see where you can make improvements. - Define Your Performance Improvements
Once you've got these figures, figure out what benchmarks will identify both problems and improvements. If you discover that customers leave when a page takes three seconds to load, for example, you should try to reduce load times to two seconds or less. - Connect Performance to Business Goals
Real user monitoring should always start with a business goal, such as increasing your conversion rate from 3% to 5%. Then you may monitor your performance metrics to see how far you've come toward your objective.
Conclusion
For a positive customer experience, real-time user monitoring is essential. Every time a customer uses your service, they expect the best experience possible. Slow or incomplete page loads, transaction difficulties, and other issues aren't simply inconvenient; they can permanently stain your customers' perception of your company.
No other solution can discover the barriers to a great customer experience like real user monitoring, allowing you to maintain your site or app running at optimum performance - and keep consumers coming back.
Sign-up for a 14-day free trial with no credit card required policy to try our Real User Monitoring.
#1 Solution for Logs, Traces & Metrics
APM
Kubernetes
Logs
Synthetics
RUM
Serverless
Security
More


![Top 10 Kibana Alternatives [2025 Guide]](/blog/content/images/size/w960/2024/11/Top-Kibana-Alternatives.png)
