What is Apdex Score? Why is it Important?
In today's fast-paced and rapidly-evolving business landscape, it's more important than ever to keep track of how well your software applications are performing. That's where the Apdex score comes in.
As a metric for measuring the user experience of an application, the Apdex score provides valuable insights into how your software is performing and how it can be improved. By tracking this score, businesses can identify issues with their applications, address them quickly, and deliver a better experience to their users.
But what exactly is the Apdex score, and how is it calculated?
In this blog post, we'll explore the ins and outs of this important metric. We'll discuss what the Apdex score measures, how it's calculated, and why it's important for businesses to track it.
We'll also take a closer look at some of the key factors that can impact your Apdex score, such as response time and user satisfaction levels.
Table of Contents
- What is Apdex Score?
- How does Apdex Score works?
- Apdex Score Calculation Process
- Why should you use an Apdex Score?
- What is a Good Apdex Score?
- How to improve Apdex Score?
- Measure your application's Apdex Score with Atatus
What is Apdex score?
Apdex score means a standardized metric used to evaluate and measure user satisfaction regarding the response time of an application or service. Essentially, Apdex scores assign a numerical value to the level of user satisfaction when utilizing a service, making it easier to monitor and analyse potential fluctuations in satisfaction over a period of time.
The scores are represented on a scale from 0 to 1, with 1 indicating excellent user satisfaction and 0 representing poor user satisfaction. To effectively use the Apdex score, it is crucial to understand and establish the Apdex threshold.
What is Apdex Threshold?
Identifying an Apdex score starts with setting an Apdex threshold, which specifies a response time considered acceptable by the organization. Having a consistent threshold allows an organization to track changes over time more easily. Each organization must determine its own response time threshold, as there is no universal standard that applies to all organizations.
APM tools play a significant role in monitoring and setting these thresholds. They help organizations ensure that their applications meet the defined response times, as specified in their SLAs. By utilizing APM tools, businesses can accurately monitor the Apdex score and make data-driven decisions to enhance user satisfaction and application performance.
How does Apdex Works?
Apdex defines a specific target response time that is considered satisfactory for users. Typically, this target is set as a threshold value, such as 0.5 seconds or 1 second, depending on the specific context and user expectations. This threshold is crucial for calculating the Apdex rating.
The threshold represents the maximum time a user is willing to wait for a response before considering it unsatisfactory.

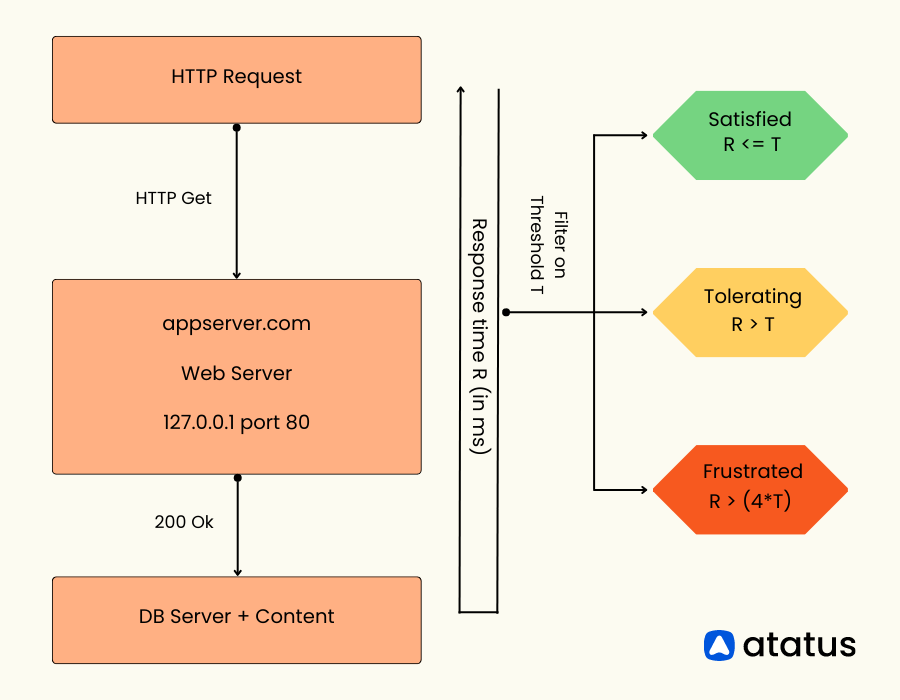
The calculation of Apdex involves three categories for classifying user experiences:
- Satisfied: If the response time of an action or transaction is less than or equal to the target threshold, the user is considered satisfied.
- Tolerating: If the response time exceeds the target threshold but is less than or equal to four times the threshold, the user is considered tolerating. Tolerating means the response time is slower than desired but still acceptable.
- Frustrated: If the response time exceeds four times the target threshold, the user is considered frustrated. Frustrated means the response time is significantly slower than desired and negatively impacts the user experience.
Apdex Score Calculation Process
The calculation process of the Apdex score involves determining the counts of satisfied, tolerating, and frustrated users, and then applying the formula to obtain the final apdex rating.
The response time experienced by individual users or transactions are measured during a specified period of time. This data will be used to categorize users into satisfied, tolerating, or frustrated categories based on the defined thresholds.

In this formula:
- Satisfied Count: The number of samples where the response time was below or equal to the satisfactory threshold.
- Tolerating Count: The number of samples where the response time was above the satisfactory threshold but below or equal to the tolerating threshold.
- Total Samples: The total number of samples or requests.
The Apdex score represents the proportion of satisfied and tolerating samples relative to the total number of samples. By considering the tolerating count as half of the satisfied count, the formula assigns a weight to responses that fall within the tolerating threshold.
The resulting Apdex score will range from 0 to 1, where 1 indicates high user satisfaction and 0 indicates low user satisfaction.

By regularly calculating the Apdex score and tracking its trends over time, organizations can monitor and improve the performance of their applications or systems to meet user expectations and deliver a satisfactory user experience.
Why Should you use an Apdex Score?
In today's digital landscape, the performance of applications and services plays a crucial role in determining user satisfaction and business success. Users have high expectations for fast and reliable experiences, and any delays or performance issues can lead to frustration and abandonment.
To effectively measure and improve application performance, businesses and organizations rely on metrics that capture user experience periodically.
The Apdex (Application Performance Index) score is a metric used to measure and quantify user satisfaction with the performance of an application or service.
It provides a standardized way to assess and compare the performance of different systems. Here are a few reasons why you should consider using an Apdex score:
1. User-centric Measurement
The Apdex score focuses on user experience and satisfaction, rather than technical performance metrics alone. It takes into account both response time and the user's tolerance for performance variations, providing a more holistic view of performance.
2. Continuous Monitoring and Improvement
By regularly measuring and tracking the Apdex score, you can identify trends, patterns, and performance bottlenecks over time. It allows you to monitor the impact of optimizations and improvements, ensuring that the application consistently meets or exceeds user expectations.
3. Balancing New Features and Performance Optimization
Knowing when to prioritize new features over performance is a critical consideration for development teams. While there may be a desire to ship quickly, this approach can lead to the introduction of bugs or suboptimal code.
However, if Apdex scores begin to decline, it becomes important to reassess priorities. Even if customers are enthusiastic about new features and the planned roadmap, it may be necessary to temporarily halt new development in order to focus on optimizing existing code and improving response times.
4. Track Application Changes and User Experience
In the software development process, various tools such as testing suites, CI/CD pipelines, and blue-green deployments are employed to mitigate the risk of deploying flawed code to production.
However, Apdex scores can also play a valuable role by providing insights into how specific deployments impact the user experience. Just as these tools help identify and address potential bugs or issues, monitoring Apdex scores allows teams to understand how a particular deployment may have influenced user satisfaction positively or negatively.
What is a Good Apdex Score?
As we discussed earlier the Apdex scale is a numerical value between 0 and 1, where 1 represents perfect performance and 0 indicates poor performance. However, the specific interpretation of a "good" Apdex score can vary depending on the context and the industry. A good Apdex score typically ranges between 0.85 and 1.0.
To achieve a "good" or "excellent" Apdex score of 0.85 or better, it requires a combination of robust software development practices and a commitment to consistently improving the user experience of your application.
It's important to recognize that attaining and maintaining such a score is a multifaceted and ongoing effort that involves various factors, including performance optimization, efficient development practices, and aligning with user expectations.
Further Apdex scores can be categorized into different performance levels:
- Excellent: An Apdex score of 0.94 to 1 indicates that users are fully productive without any significant response time hindrances.
- Good: A score of 0.85 to 0.93 suggests that users are generally productive and not significantly impeded by response time.
- Fair: Apdex scores ranging from 0.70 to 0.84 indicate that users may experience some performance issues, but they are still likely to continue using the application due to the value they receive.
- Poor: Scores between 0.50 and 0.69 imply that users encounter noticeable delays, but they are still motivated to continue using the application.
- Unacceptable: An Apdex score of 0.0 to 0.49 reflects an application that is highly unresponsive, leading users to abandon their tasks due to the frustrating experience.
These performance level categorizations help assess the user experience and provide insights into the level of satisfaction or frustration users may encounter while interacting with the application.
How to improve Apdex Score?
To improve your Apdex score, the key focus should be on enhancing the responsiveness of your application.
Further improving your Apdex score involves implementing various strategies to enhance the performance and user experience of your application. Here are some approaches to consider:
- Scale resources as needed to handle increased user demands. Ensure that your infrastructure is capable of handling increased traffic.
- Adopt efficient coding practices and adhere to coding standards. Eliminate unnecessary code, reduce dependencies, and refactor complex algorithms for improved performance.
- Regularly maintain and update your application to ensure optimal performance.
- Integrate Apdex scores as Key Performance Indicators (KPIs) for your development teams, aligning them with the goal of shipping functional features.
- Deploy performance monitoring and analytics tools to gain insights into your application's performance in real-time. Monitor key performance metrics, track trends, and receive alerts for potential performance issues.
How to Measure Apdex Score in Atatus?
Atatus is a comprehensive application performance monitoring (APM) solution that can help you measure and identify performance issues in your application.
- Sign in to Atatus, Navigate to Browser and Create a New Browser Project.
- Click on Browser Agent and select your frontend framework.
- Name your application and click on Continue.
- To integrate Javascript agent in your application, choose the respective package and follow the setup instructions.
- Once it is done click on "Im done" button.
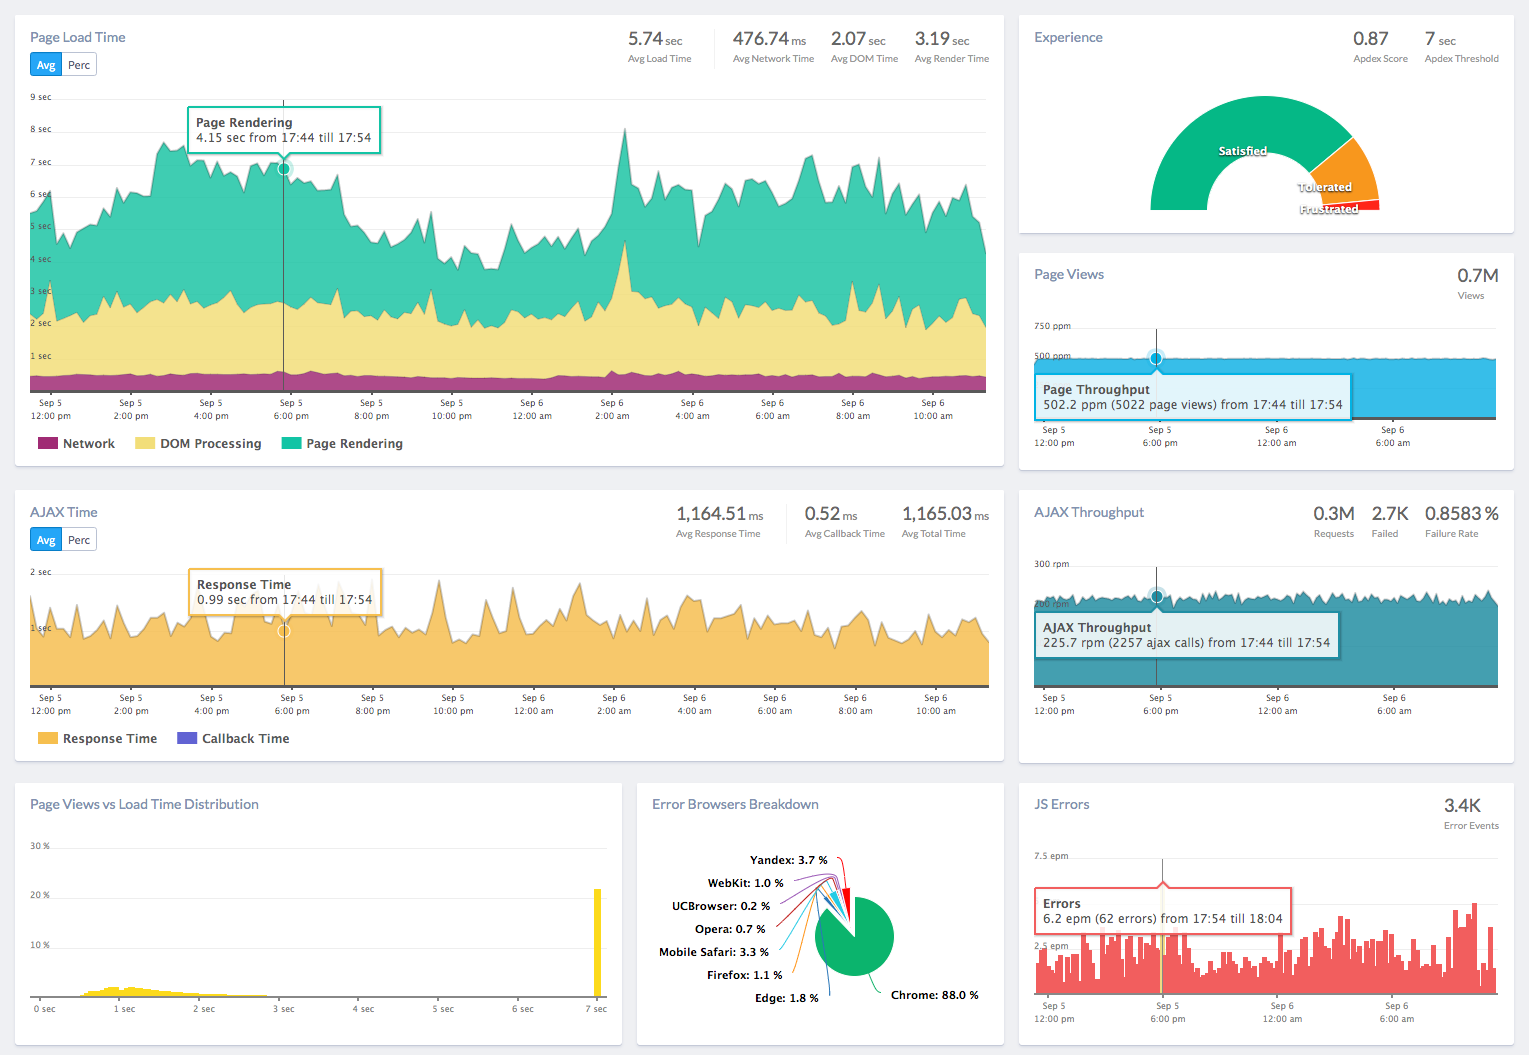
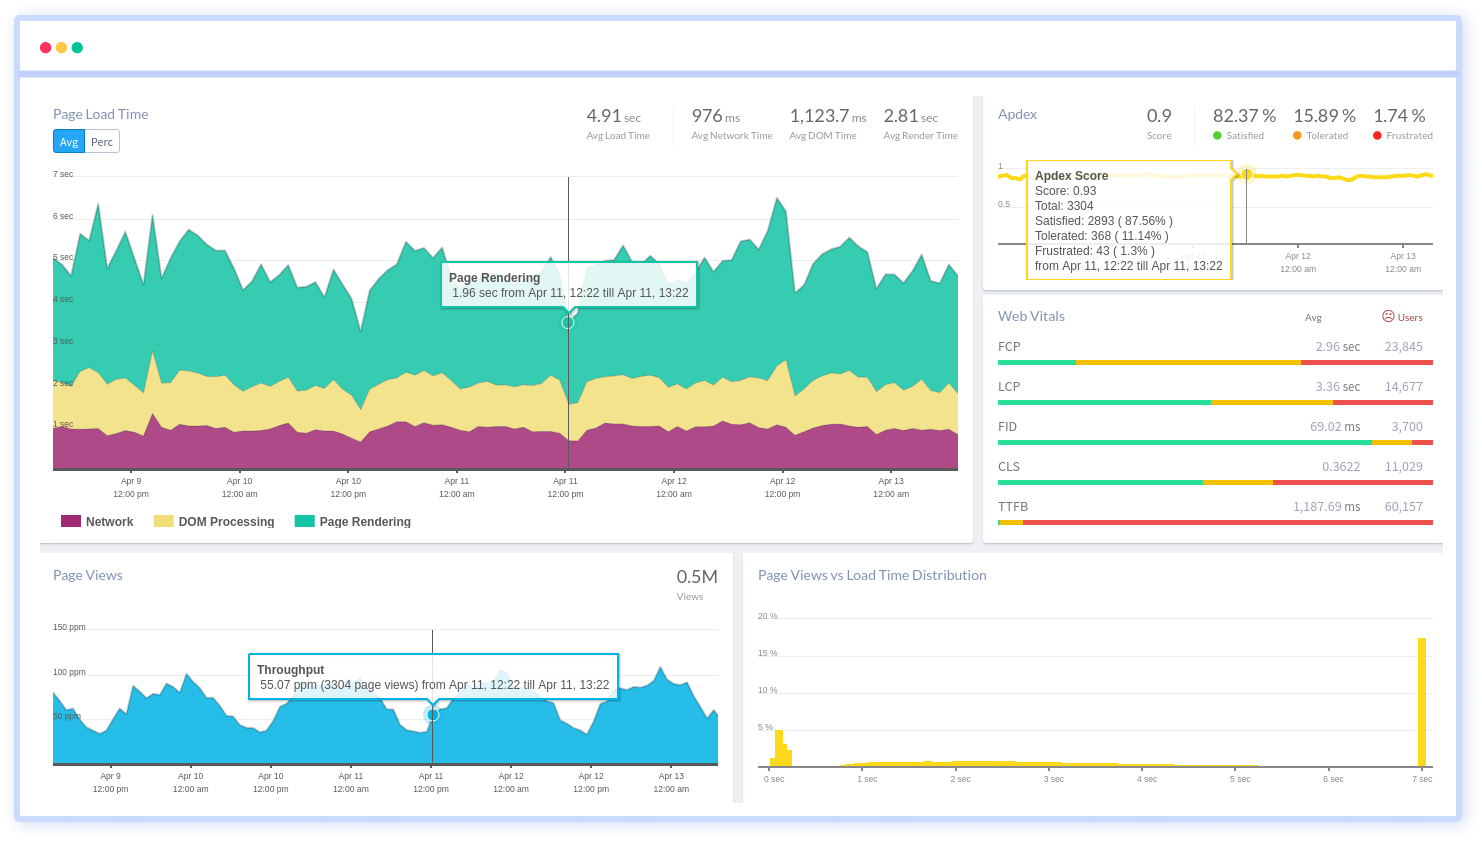
- After setting up, your page will look like below.

Conclusion
In summary, the Apdex score and apdex rating serves as a valuable metric for evaluating user satisfaction with application performance. It enables organizations to pinpoint areas for improvement and prioritize efforts to enhance performance.
To achieve a comprehensive understanding of application performance, it is beneficial to supplement the Apdex score with additional metrics such as network latency and database response times.
As technology continues to evolve, it is important for organizations to stay up-to-date with the latest tools and methodologies, including the Apdex score, to ensure their applications are meeting user expectations and driving business success.
Atatus Real User Monitoring
Atatus is a scalable end-user experience monitoring system that allows you to see which areas of your website are underperforming and affecting your users. Understand the causes of your front-end performance issues and how to improve the user experience.

By understanding the complicated frontend performance issues that develop due to slow page loads, route modifications, delayed static assets, poor XMLHttpRequest, JS errors, core web vitals and more, you can discover and fix poor end-user performance with Real User Monitoring (RUM).
You can get a detailed view of each page-load event to quickly detect and fix frontend performance issues affecting actual users. With filterable data by URL, connection type, device, country, and more, you examine a detailed complete resource waterfall view to see which assets are slowing down your pages.
#1 Solution for Logs, Traces & Metrics
APM
Kubernetes
Logs
Synthetics
RUM
Serverless
Security
More


