Traceparent and Tracestate Explained: A Guide to Distributed Tracing with Atatus
In modern microservice architectures, requests often span multiple services, making it challenging to monitor and debug performance issues. Distributed tracing provides the ability to follow a request’s journey through these services, identifying performance bottlenecks and dependencies.
The W3C trace context standard simplifies this process by introducing two critical headers: traceparent and tracestate. These headers help maintain consistent tracing across systems, making tools like Atatus essential for smooth observability.
Table of Contents:
- Traceparent header
- Tracestate header
- How traceparent and tracestate work together?
- How Atatus utilizes these headers?
- Benefits of using Atatus for distributed tracing
Traceparent header
The traceparent header is a key part of distributed tracing in modern applications. It is used to propagate trace context information across different components of a distributed system.
Traceparent header primary purposes are:
- Identifying traces: Links all the activities (or spans) in a single trace to provide a view of the request.
- Defining relationships: Tracks parent-child relationships between spans, helping visualize the flow of requests across services.
- Signaling sampling preferences: Indicates whether the current request should be traced or ignored, ensuring efficiency.
Example Format:
traceparent: version-trace-id-parent-id-trace-flags
Example Value:
traceparent: 00-4bf92f3577b34da6a3ce929d0e0e4736-00f067aa0ba902b7-01
Tracestate header
The tracestate header is an optional part of distributed tracing that carries extra information about a trace, often specific to a tracing vendor. It works alongside the traceparent header to include custom details in a standardized way.
Tracestate header key purposes include:
- Adding custom metadata: Vendors like Atatus can include data like sampling rates or trace priorities.
- Supporting multiple systems: Allows interoperability by combining metadata from multiple tracing vendors.
Example format:
tracestate: key1=value1,key2=value2,...
Example value:
tracestate: atatus=trace123,samplingRate=1
How traceparent and tracestate work together?
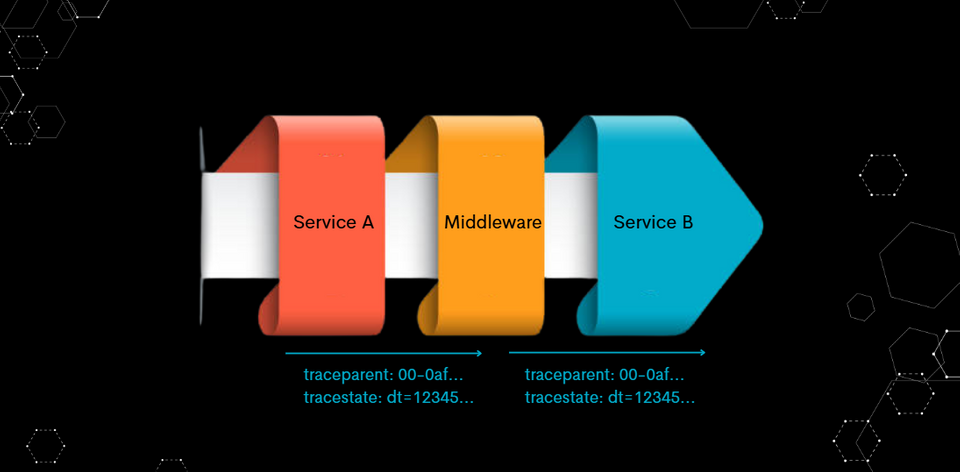
The traceparent and tracestate headers work together to track a request across different services. The traceparent header gives basic trace information, while tracestate adds extra details, like vendor-specific data. Together, they help track a request’s journey, identifying delays, failures, and service dependencies.
In a distributed system like an e-commerce application, a request often travels through multiple services. Each service in the process adds information to track the request’s journey.
Here is how the tracing headers work in detail, using the example of a customer’s request flowing through three services: frontend-service, inventory-service, and payment-service.
frontend-service processes the customer’s request. The request moves to inventory-service to check stock. Finally, it is forwarded to payment-service to process the payment.
Example headers at each stage:
frontend-service Response:
traceparent: 00-abcdef1234567890abcdef1234567890-1234567890abcdef-01
tracestate: atatus=frontend123,samplingRate=1
inventory-service Request:
traceparent: 00-abcdef1234567890abcdef1234567890-9876543210fedcba-01
tracestate: atatus=inventory567,samplingRate=1
payment-service Request:
traceparent: 00-abcdef1234567890abcdef1234567890-1122334455667788-01
tracestate: atatus=payment890,samplingRate=1
By connecting these headers, an end-to-end view of the request is created, showing delays and potential failure points in real time.
How Atatus utilizes these headers?
Atatus uses traceparent and tracestate to provide:
- Complete trace visibility: Track requests across all microservices in your application.
- Precise diagnostics: Pinpoint performance bottlenecks and problematic services.
- Enhanced metadata: Use
tracestateto configure sampling or add vendor-specific insights.
Benefits of using Atatus for distributed tracing
- Unified observability: Gain a single pane of glass for your distributed systems.
- Real-time insights: Diagnose latency, errors, and failures as they happen.
- Ease of integration: Automatically propagate headers across services without custom implementations.
Conclusion
The traceparent and tracestate headers are essential components of distributed tracing, ensuring trace continuity and enriching trace data. With tools like Atatus, these headers unlock the full potential of observability, helping you monitor and optimize your application’s performance.
#1 Solution for Logs, Traces & Metrics
APM
Kubernetes
Logs
Synthetics
RUM
Serverless
Security
More


![New Relic vs Splunk - In-depth Comparison [2025]](/blog/content/images/size/w960/2024/10/Datadog-vs-sentry--19-.png)
![New Relic vs Sentry - Which Monitoring Tool to Choose? [2025]](/blog/content/images/size/w960/2024/10/VS--1-.png)
![Splunk vs Prometheus: A Side-by-Side Comparison [2025 Guide]](/blog/content/images/size/w960/2024/08/Datadog-vs-sentry--13-.png)