Top 10 APM Tools [2026 Guide]
![Top 10 APM Tools [2026 Guide]](/blog/content/images/size/w960/2025/11/apm-tools-2026.png)
In 2026, application performance isn’t just a technical metric, it’s a business-critical factor. As organizations move deeper into cloud-native architectures, distributed systems, and AI-driven workflows, ensuring speed, reliability, and uptime has become non-negotiable.
According to Gartner, by 2026 more than 70% of new APM implementations will be cloud-native, and businesses that leverage advanced observability platforms are expected to reduce downtime by up to 60%. With end-users expecting instant response times and seamless digital experiences, a single second of delay can translate into 7% loss in conversions and 16% drop in user satisfaction.
APM tools give teams the visibility they need, tracking every transaction, dependency, and error in real time to ensure systems run smoothly across microservices, APIs, and global infrastructures.
In this guide, we will look at the top APM tools shaping 2026, from end-to-end observability platforms like Atatus to enterprise-grade solutions such as Dynatrace, Datadog, and New Relic.
Table Of Contents:
- What is APM?
- Top APM Tools at a Glance
- Atatus: End-to-End Application Observability and Performance Insights
- Dynatrace: AI-Driven Root Cause Analysis and Auto-Instrumentation
- New Relic: Full-Stack Observability with Custom Query Analytics (NRQL)
- AppDynamics: Business Transaction Monitoring and KPI Correlation
- Tsuga: BYOC Application Performance Monitoring with Full Data Control
- Datadog: Distributed Tracing and Real-Time Cloud Monitoring
- Splunk APM: Full-Fidelity Tracing and Advanced Analytics at Scale
- Elastic APM: Unified Monitoring for Logs, Metrics, and Traces
- Instana: Real-Time Microservices Monitoring and Dependency Mapping
- Sentry: Application Error Tracking and Performance Profiling
- Prometheus: Open-Source Metrics Collection and Alerting System
- How to select the best APM tool?
What is APM?
APM stands for Application Performance Monitoring, is the practice of tracking, analyzing, and optimizing the performance and availability of software applications. It helps developers, DevOps engineers, and SREs understand how applications behave in real time, detect bottlenecks or errors, and ensure a smooth user experience.
An APM tool collects data from your applications and infrastructure, such as response times, throughput, error rates, and resource usage and presents it through dashboards and alerts. This enables teams to:
- Detect and fix performance issues before users are affected
- Trace requests across microservices and APIs
- Monitor database and external service dependencies
- Correlate performance data with code-level insights
- While we focused on Application Performance Monitoring in the previous section, it can be referred to by several related names, including performance monitoring and application monitoring.
- Although Application Monitoring and Management are used by many interchangeably, they are distinct for these very reasons;
- Application Performance Monitoring focuses on tracking specific metrics like response times and error rates to detect and address performance issues in real-time.
- Application Performance Management is a broader discipline that includes strategic planning and proactive management to optimize application performance across its lifecycle and align with business objectives.
Top APM Tools at a Glance
- Atatus: A complete observability platform that brings together application performance monitoring, logs, metrics, and real-user insights in one unified dashboard. Ideal for teams that want deep visibility without switching between multiple tools.
- Dynatrace: An AI-powered observability platform offering application performance monitoring, infrastructure monitoring, and digital experience management to help large enterprises simplify cloud complexity.
- New Relic: A cloud-based observability platform that helps engineering teams visualize, analyze, and troubleshoot their software by combining data from application performance, infrastructure, and user experience.
- AppDynamics: An application performance management (APM) and IT operations analytics solution that provides real-time visibility into complex application environments, offering deep diagnostics and business context.
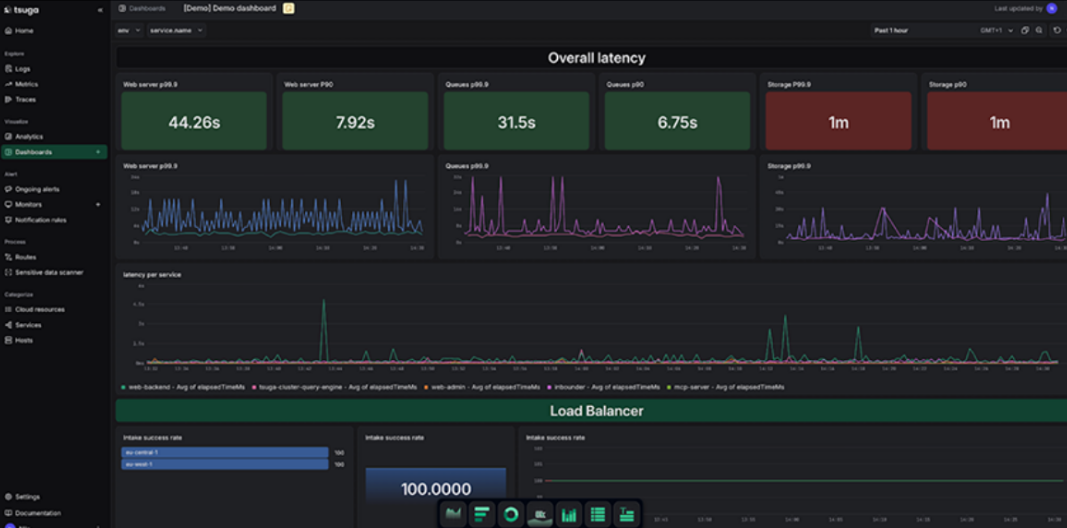
- Tsuga: A bring-your-own-cloud (BYOC) observability platform that delivers application performance monitoring, logs, metrics, and traces while keeping all telemetry inside your own cloud environment for greater security, governance, and predictable costs.
- Datadog: A monitoring and analytics platform that provides full-stack observability by combining real-time metrics, logs, and traces from servers, containers, and applications.
- Splunk APM: An application performance monitoring tool within the Splunk Observability Cloud that provides end-to-end visibility into application health and distributed traces.
- Elastic APM: An application performance monitoring system built on the Elastic Stack that monitors software services in real time, collecting performance metrics and errors for analysis in Kibana.
- Instana: A fully automated APM solution, now part of IBM, that delivers real-time, high-fidelity observability and AI-powered root cause analysis for modern, cloud-native applications.
- Sentry: A developer-focused, open-source error monitoring and performance tracking tool that helps identify, diagnose, and resolve application issues in real time.
- Prometheus: An open-source systems monitoring and alerting toolkit that collects and stores metrics as time-series data, popular for monitoring cloud-native environments like Kubernetes.
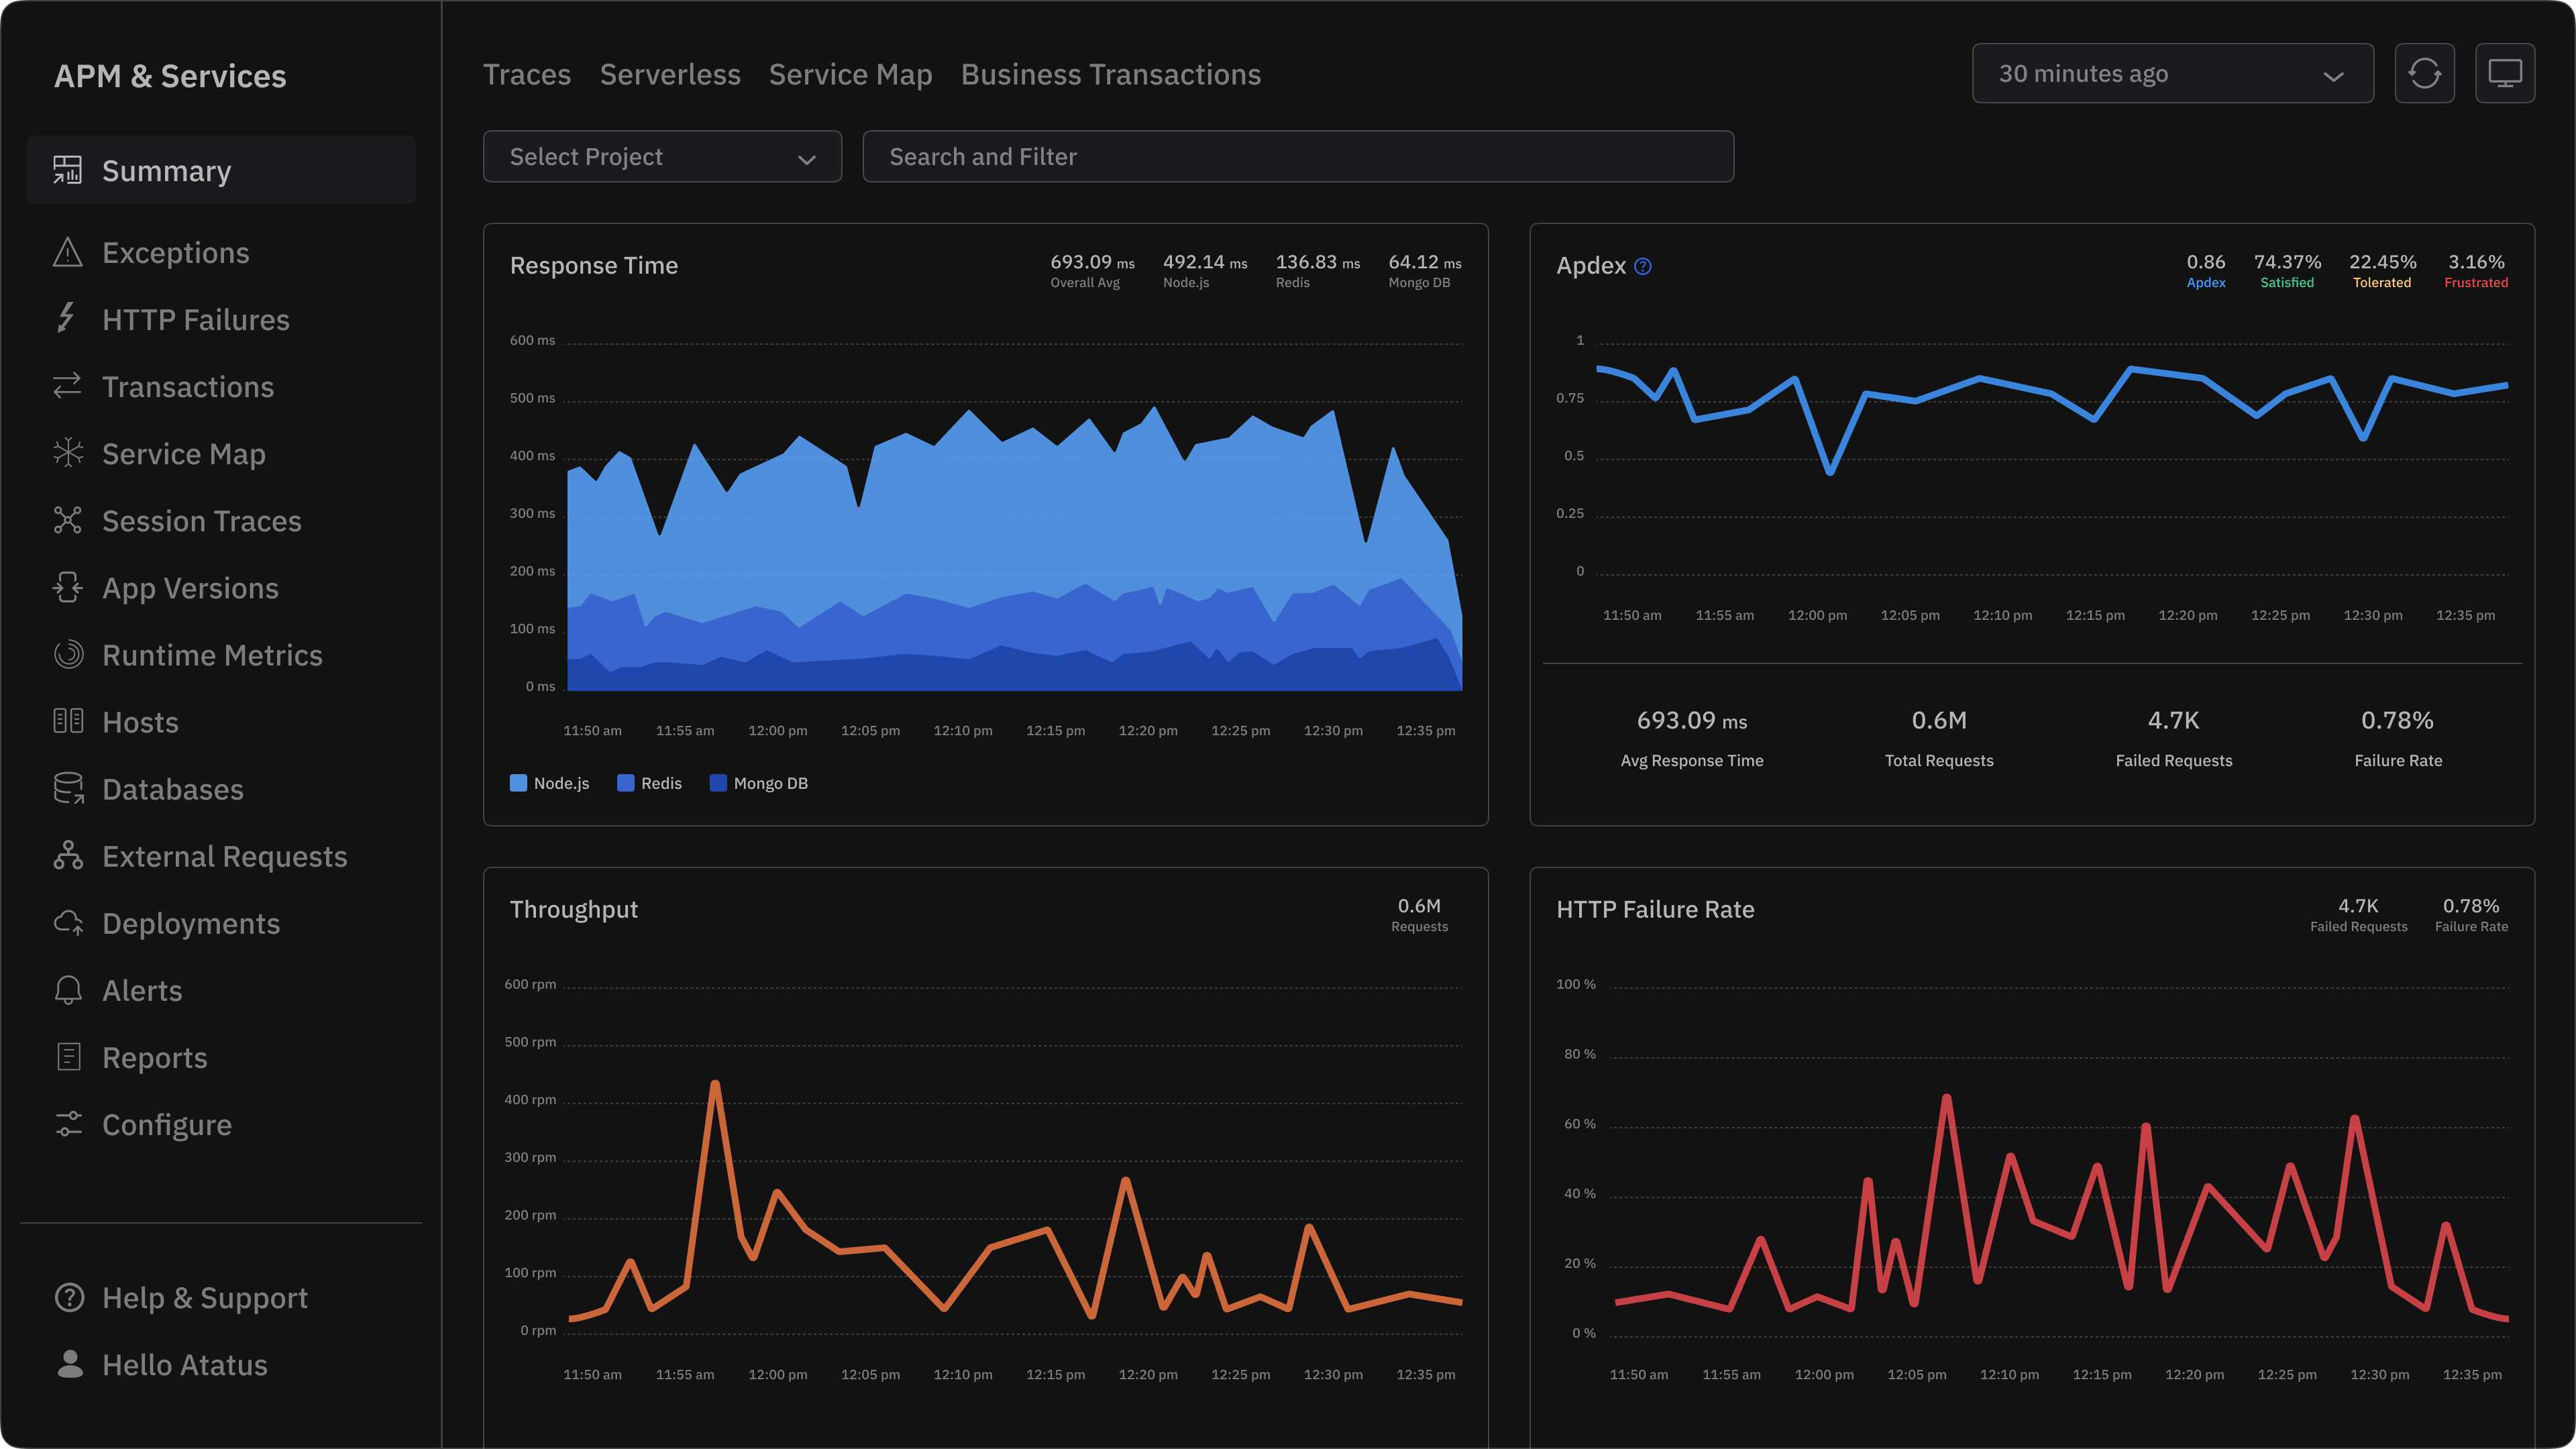
Atatus: End-to-End Application Observability and Performance Insights
Atatus is a comprehensive observability platform designed for developers, DevOps engineers, and SREs to monitor application health, performance, and user experience from a single dashboard.
It provides full visibility across your stack covering APM, infrastructure, logs, and front-end monitoring, helping teams detect bottlenecks, analyze root causes, and ensure optimal reliability.
Its lightweight agent and intuitive UI make it easy to set up, while its real-time insights empower faster troubleshooting and performance optimisation across distributed systems.
Key Features:
- Full-stack observability for applications, servers, and end-users
- Real User Monitoring (RUM) for front-end performance tracking
- Error tracking with intelligent alerts
- Distributed tracing for microservices visibility
- Log management and correlation with APM data
- Seamless integrations with cloud platforms and DevOps tools
- Team collaboration and alert automation through Slack, PagerDuty, etc.
Fix Performance Issues Before Your Users Notice
Tired of chasing slowdowns and hidden errors across your stack? Atatus gives you a unified view of your entire application — from backend to frontend — so you can find root causes instantly and deliver flawless performance every time.
👉 Try Solving It NowDynatrace: AI-Driven Root Cause Analysis and Auto-Instrumentation
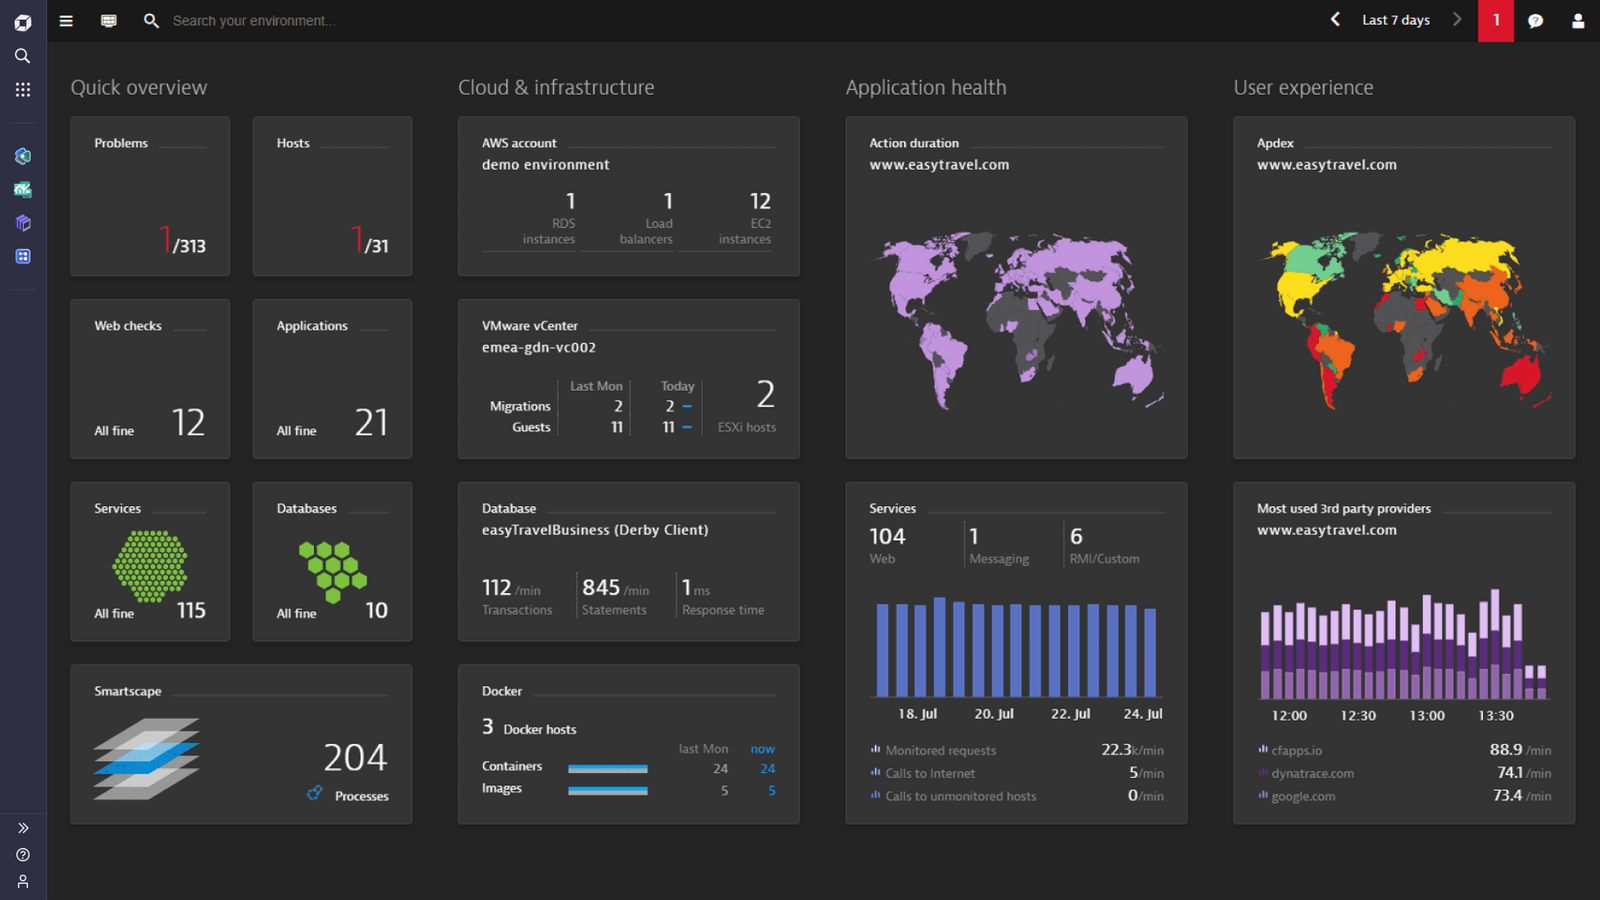
Dynatrace leverages its proprietary Davis AI engine and OneAgent for automatic discovery, instrumentation, and dependency mapping. It helps enterprises monitor complex, hybrid, and cloud-native environments with minimal manual setup. The platform’s AI-assisted insights help pinpoint root causes instantly, enabling proactive problem resolution and performance optimisation at scale.
Key Features:
- AI-powered Davis engine for anomaly detection and RCA
- OneAgent for automated instrumentation across tech stacks
- End-to-end visibility for hybrid and multi-cloud environments
- Smart baselining for adaptive anomaly detection
- Built-in support for Kubernetes, AWS, Azure, and GCP
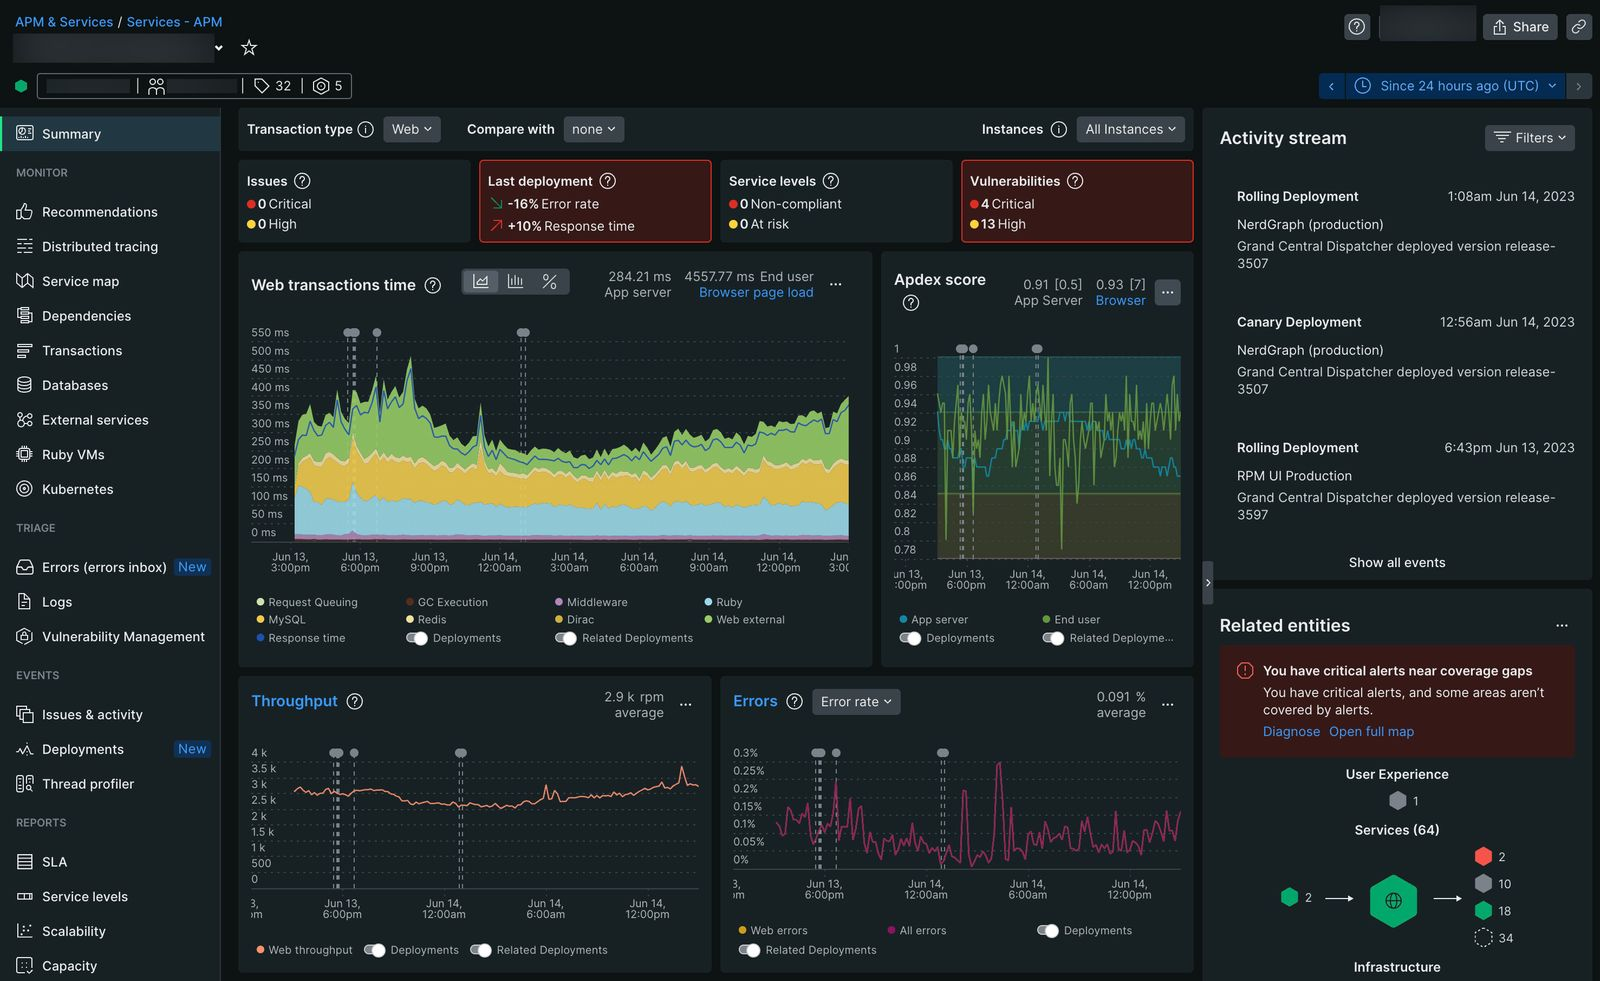
New Relic: Full-Stack Observability with Custom Query Analytics (NRQL)
New Relic unifies application, infrastructure, and digital experience monitoring under one platform. Its powerful New Relic Query Language (NRQL) allows users to create custom dashboards and analyze performance data in real time. It’s especially favored by DevOps teams for its flexibility, scalability, and visualization options across distributed systems.
Key Features:
- NRQL-based analytics for deep data exploration
- Application and infrastructure monitoring in one platform
- Browser and mobile performance tracking
- Distributed tracing for microservices
- Alerts and AI-assisted anomaly detection
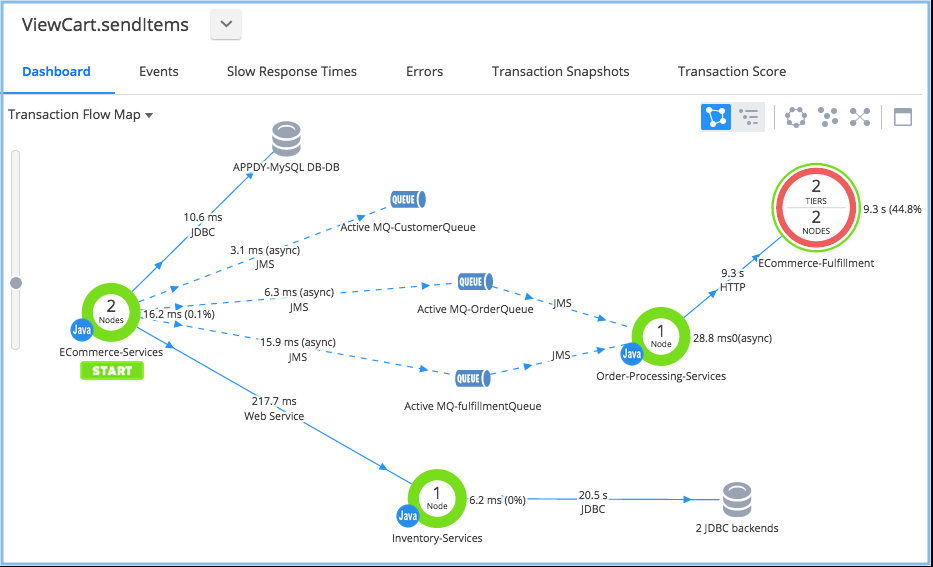
AppDynamics: Business Transaction Monitoring and KPI Correlation
AppDynamics focuses on business transaction monitoring, giving enterprises the ability to connect application performance metrics directly to business KPIs. It provides a clear path from code-level insights to revenue impact, helping teams prioritize fixes that matter most to end-users and the business.
Key Features:
- Business transaction flow mapping
- Code-level diagnostics for performance bottlenecks
- KPI correlation for business impact assessment
- Cloud and on-premise deployment flexibility
- Integration with Cisco ecosystem and enterprise platforms
Tsuga: Enterprise Observability That Runs in Your Cloud
Tsuga is a BYOC (Bring Your Own Cloud) observability platform that gives organizations full control over their telemetry data while eliminating the operational burden of managing observability infrastructure. Unlike traditional SaaS monitoring tools, Tsuga stores logs, metrics, and traces inside your own cloud environment, while providing a fully managed experience. Its AI-powered workflows help teams accelerate troubleshooting, uncover root causes faster, and maintain visibility across complex cloud-native systems without sacrificing security, compliance, or data sovereignty.
Key Features:
- BYOC architecture with telemetry stored in your cloud environment
- Unified observability for logs, metrics, traces, and APM
- AI-assisted incident investigation and root cause analysis
- OpenTelemetry-native instrumentation with no proprietary agents
- Built-in compliance, governance, SSO, RBAC, and audit logging
- Predictable, usage-based pricing without per-host or per-container fees
Datadog: Distributed Tracing and Real-Time Cloud Monitoring
Datadog is a cloud-native observability solution that combines logs, metrics, traces, and security data into a unified interface. It’s built for DevOps teams managing dynamic and containerized infrastructures. Its distributed tracing and live dashboards make it a go-to choice for real-time performance monitoring and incident management.
Key Features:
- Unified monitoring for applications, logs, and infrastructure
- Distributed tracing and service dependency mapping
- Cloud security posture management (CSPM)
- Advanced dashboards with live metrics
- 500+ integrations with cloud services and tools
Splunk APM: Tracing and Advanced Analytics at Scale
Splunk APM is engineered for enterprise-scale observability. It uses no-sampling tracing, ensuring that every transaction is captured for complete visibility. Combined with its robust analytics engine, Splunk helps large organizations identify performance issues, reduce mean time to resolution (MTTR), and maintain system reliability under heavy load.
Key Features:
- No-sampling, full-fidelity distributed tracing
- Advanced analytics and anomaly detection
- Seamless integration with Splunk Enterprise and ITSI
- AI-driven insights for proactive performance tuning
- Large-scale data ingestion and visualisation
Elastic APM: Unified Monitoring for Logs, Metrics, and Traces
Part of the Elastic Stack (ELK), Elastic APM provides developers with a unified observability framework that integrates APM, logging, and metrics. Its open-source foundation allows flexibility in deployment and customization, making it a strong choice for teams already using Elasticsearch or Kibana.
Key Features:
- Unified data correlation across logs, metrics, and traces
- Open-source and self-hosted flexibility
- Distributed tracing for microservices
- Seamless integration with Elasticsearch and Kibana
- Machine learning for anomaly detection
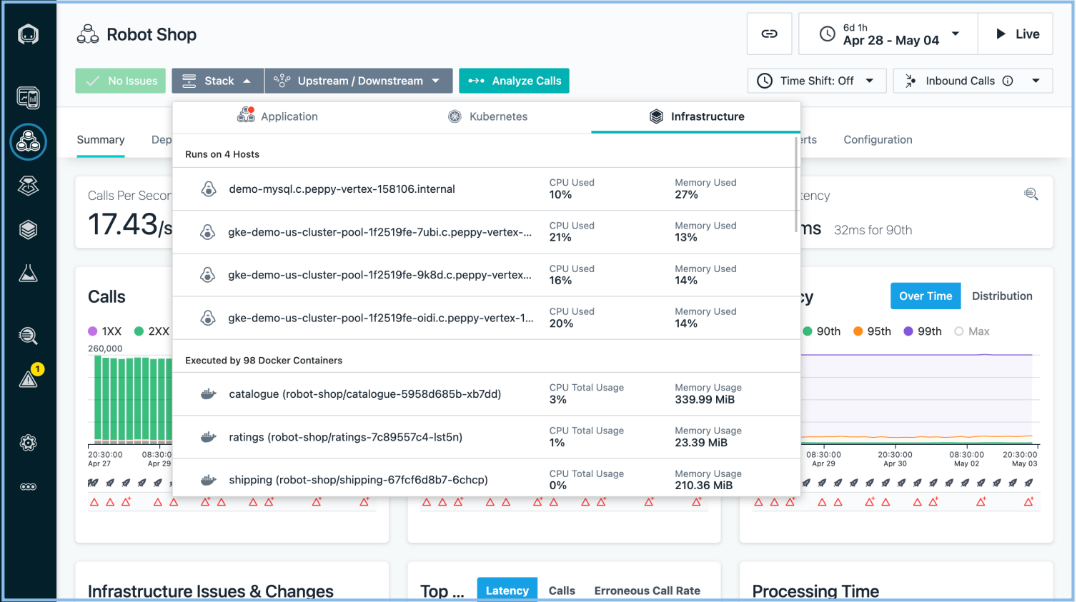
Instana: Real-Time Microservices Monitoring and Dependency Mapping
Instana, now part of IBM, focuses on providing real-time visibility into complex, containerized microservices architectures. It continuously discovers applications, visualizes dependencies, and delivers instant insights for faster troubleshooting. Ideal for DevOps and SRE teams managing Kubernetes or dynamic workloads.
Key Features:
- Continuous discovery of services and dependencies
- Real-time tracing and performance visualisation
- Automatic root cause detection with AI assistance
- Integration with Kubernetes and OpenTelemetry
- Real-time health and SLA monitoring
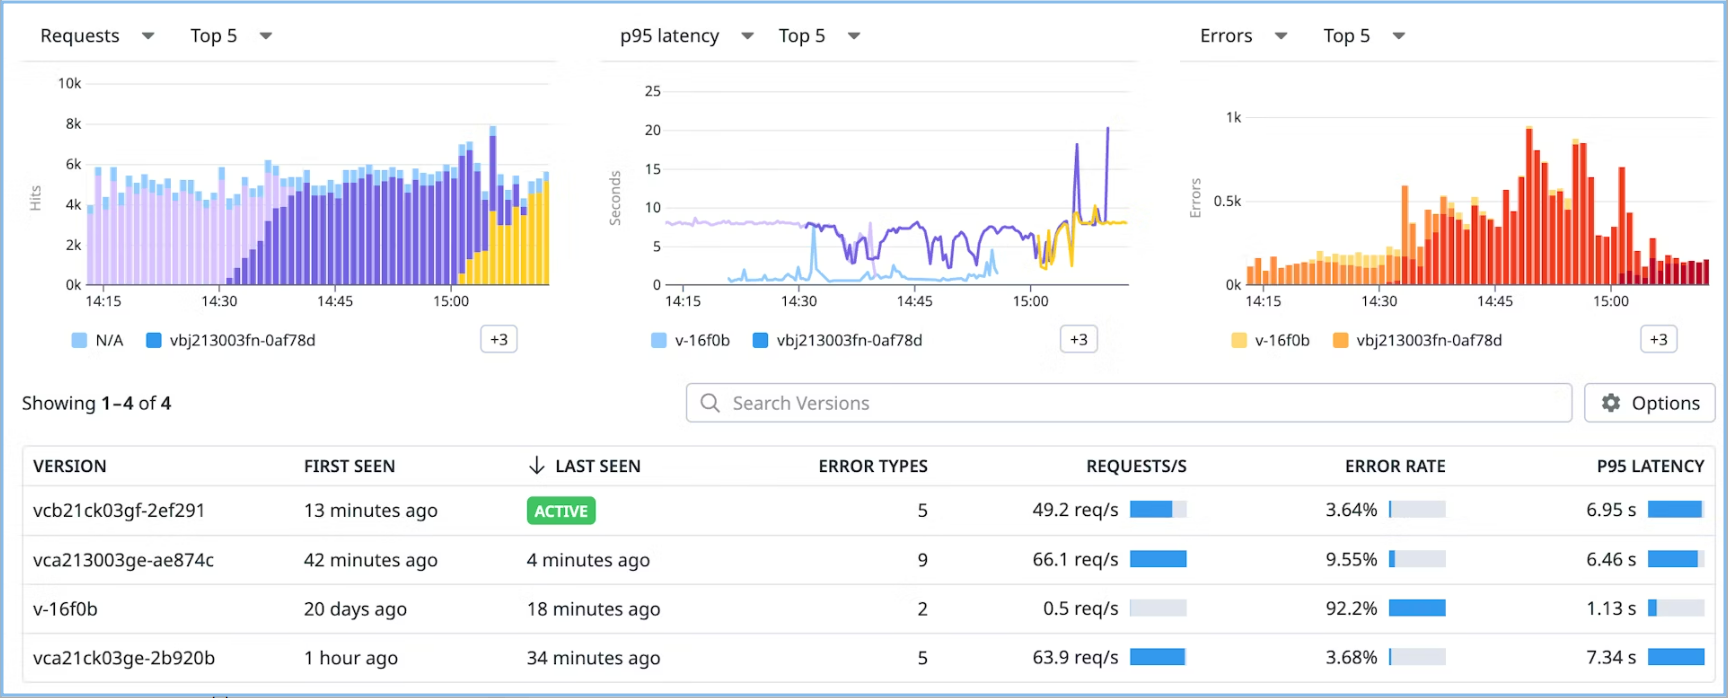
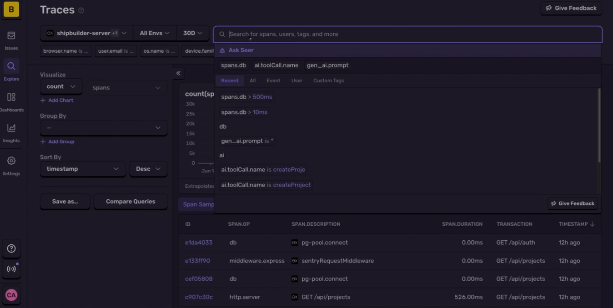
Sentry: Application Error Tracking and Performance Profiling
Sentry began as an error-tracking tool but has evolved into a strong APM solution for developers. It provides real-time error detection, performance tracing, and profiling to identify slow transactions and problematic code paths. It’s especially valuable for engineering teams that want performance insights directly linked to code-level visibility.
Key Features:
- Error tracking with detailed stack traces
- Performance monitoring for front-end and back-end
- Code profiling and slow transaction detection
- Version and release tracking
- Integration with GitHub, Jira, Slack, and CI/CD pipelines
Prometheus: Open-Source Metrics Collection and Alerting System
Prometheus is a widely adopted open-source monitoring and alerting toolkit designed for reliability and scalability. It’s often used alongside Grafana for visualization. With its flexible query language (PromQL), Prometheus is highly customizable for cloud-native and Kubernetes environments.
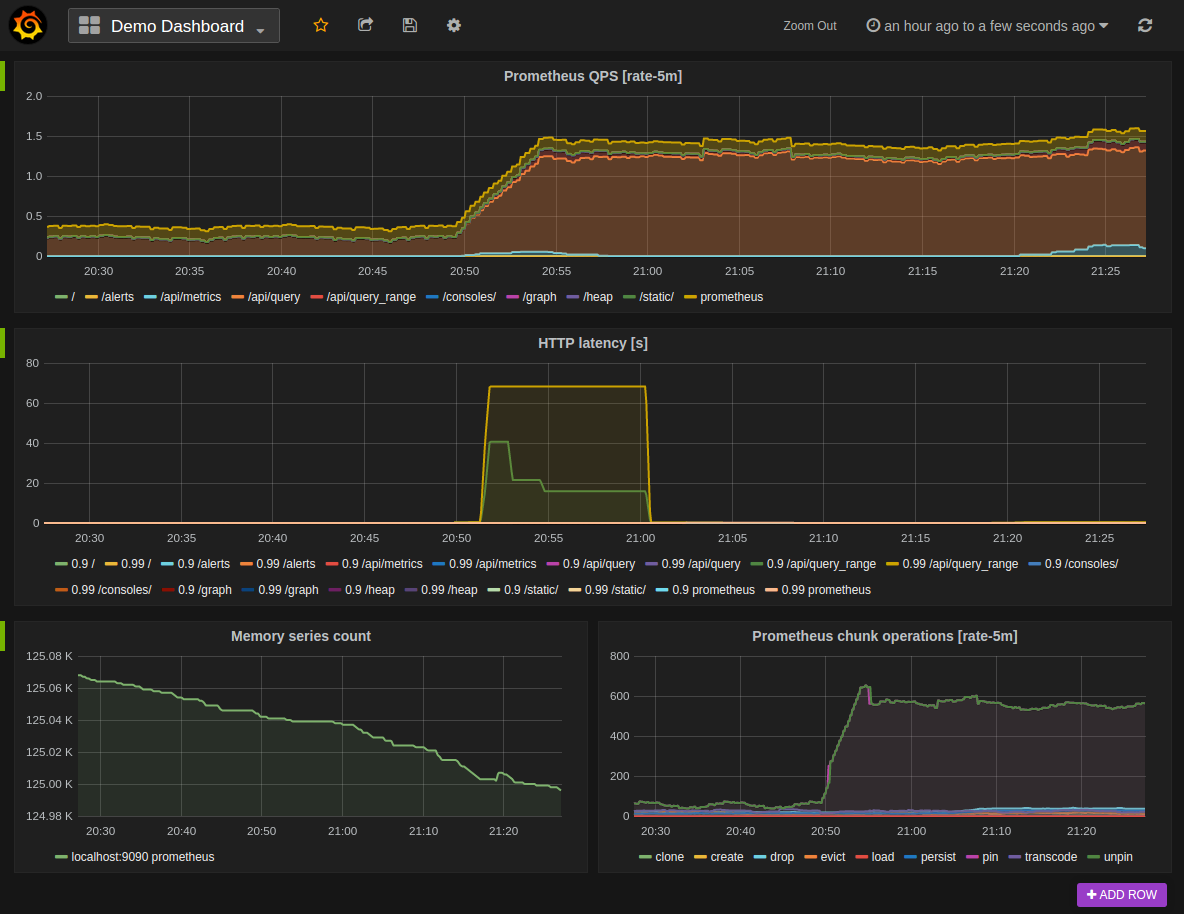
Key Features:
- Time-series metrics collection and querying with PromQL
- Pull-based model for efficient metric scraping
- Built-in alerting and rule evaluation engine
- Native integration with Kubernetes and Grafana
- Open-source ecosystem with extensive community support
How to select the best APM Tool?
Selecting the best APM tool involves not just the cost, but also how well it performs and if it aligns with your business goals.
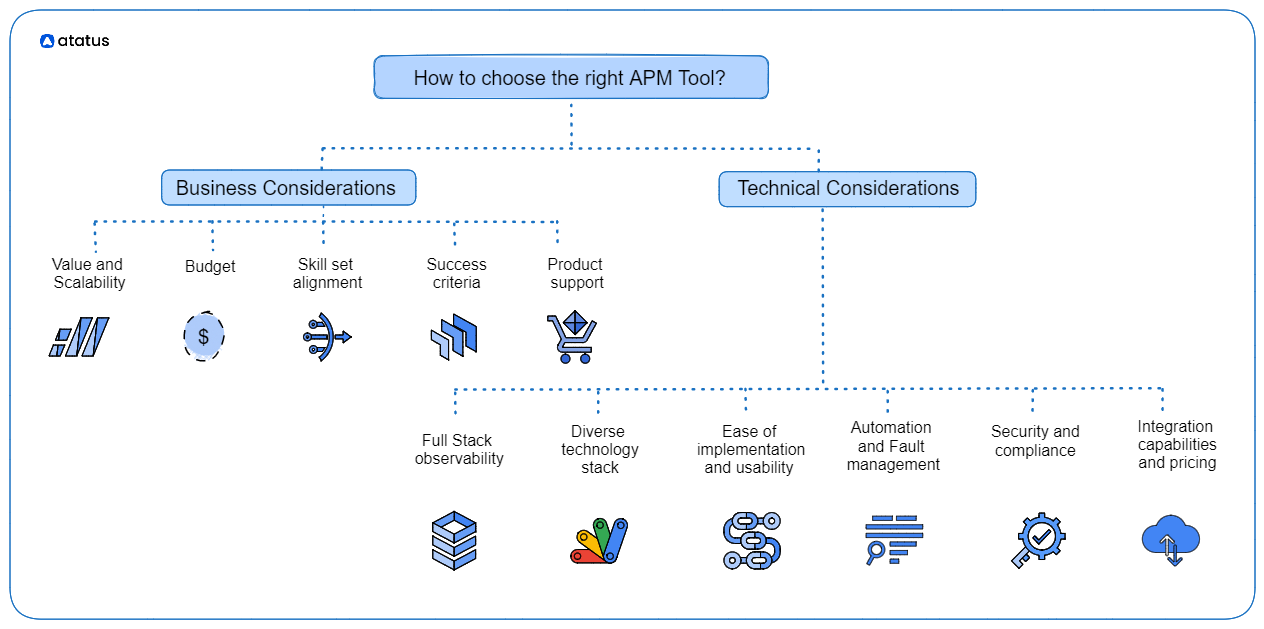
Key factors to consider:
- Technology stack: Ensure the tool supports the languages, frameworks, and databases your applications use.
- Budget: Compare pricing models, as costs can vary significantly between vendors. Some offer free tiers or trials to help you get started.
- Scalability: Choose a tool that can handle your current and future workload, especially as your application and user base grow.
- Ease of use and team comfort: Consider the learning curve and how well the tool's interface fits your team's existing processes. Some tools are designed for simplicity, while others offer deeper, more complex features.
- Integration: Check if the APM tool can integrate with your existing CI/CD pipelines, logging, and other monitoring tools.
- Key features: Look for specific capabilities that are important to your team, such as:
- Real-time monitoring: Provides insights into response times, transaction throughput, and error rates.
- End-to-end tracing: Helps visualize and diagnose performance issues across complex distributed systems.
- Real user monitoring (RUM): Offers visibility into the actual user experience.
- Business transaction monitoring: Correlates application performance with business outcomes.
- Automated discovery and visualisation: Creates automatic dependency maps and topology visualisations.
- Security and threat: Includes features for application security and threat detection.
Take advantage of free trials or demo versions to test the tool in your environment and see how well it meets your needs.
#1 Solution for Logs, Traces & Metrics
![]() APM
APM
![]() Kubernetes
Kubernetes
![]() Logs
Logs
![]() Synthetics
Synthetics
![]() RUM
RUM
![]() Serverless
Serverless
![]() Security
Security
![]() More
More

![New Relic vs Splunk - In-depth Comparison [2026]](/blog/content/images/size/w960/2024/10/Datadog-vs-sentry--19-.png)