Performance Testing: Everything You Need to Know
The main goal of performance testing is to measure the application's response time, throughput, resource utilization, and other relevant metrics under different loads and stress levels. It can be regarded as a kind of software testing that varies between different user loads.
Performance testing can be used to identify and isolate performance bottlenecks, optimize system performance, and ensure that an application or system meets its performance requirements. Performance testing typically involves simulating realistic user loads and measuring the response times and resource utilization of the system under test.
According to estimates, Google lost $545,000.000 in only five minutes of downtime. A recent Amazon Web Service outage caused companies to lose sales worth $1100 per second.
In light of this, it is needless to say that performance testing is crucial.
There are several types of performance testing, including load testing, stress testing, endurance testing, and scalability testing. Load testing involves simulating a realistic user load on the system, while stress testing involves pushing the system beyond its limits to determine how it behaves under extreme conditions.
We will look at the different types of testing done for system performances and how it gets done. You will also find some common metrics on which administrators routinely conduct these performance tests. Lastly, we will also take a look at the industry's best practices for obtaining optimal results for our applications and programs.
Table Of Contents
- Why Performance Testing?
- Performance Testing Types
- Performance Testing Workflow
- Performance Test Metrics
- Tips for Efficient Performance Testing
- Popular Testing Tools
Why Performance Testing?
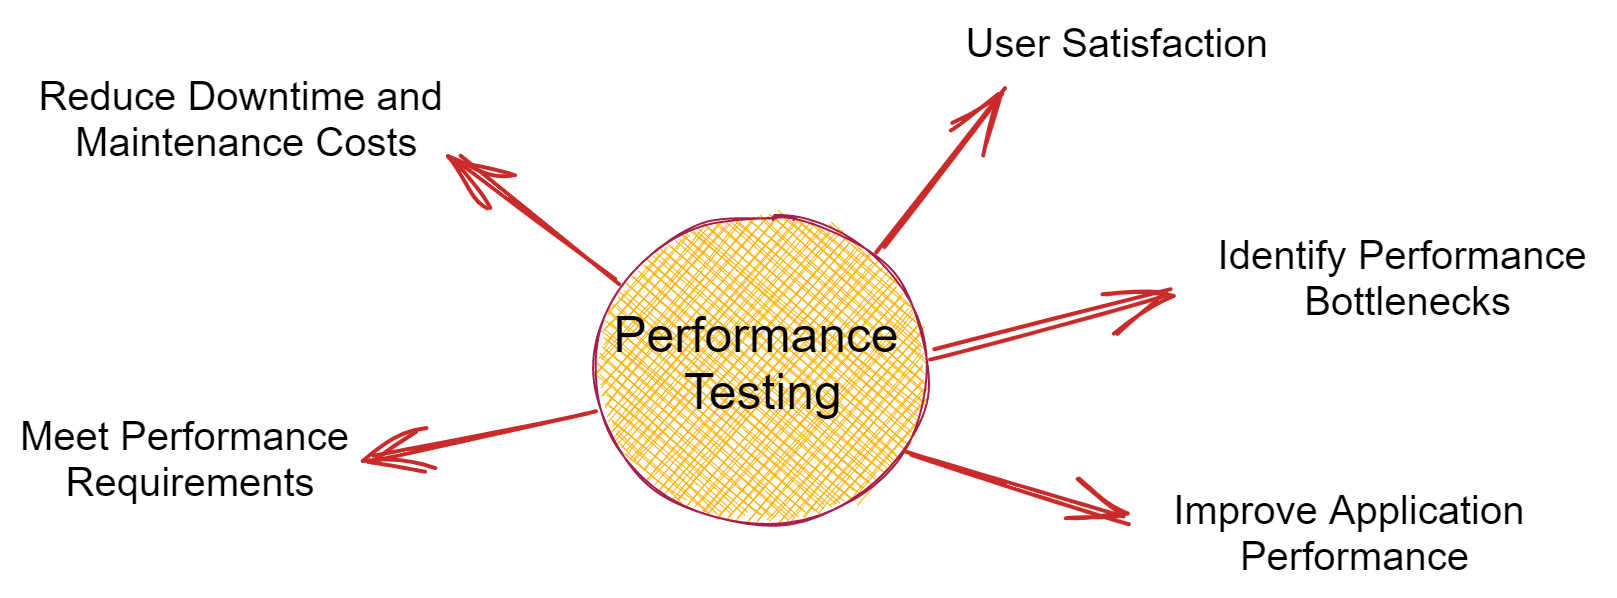
There are several reasons why performance testing is important. It is not only an analysis chart giving out the health metrics of your application, like the response time, errors, resource usage, and ability to scale. It gives us valuable insights into what needs urgent attention and which part of our program is the most likely to fail.
Performance testing helps us assure:-

- User Satisfaction: Performance testing helps to ensure that an application or system is capable of meeting its performance goals and providing a good user experience. If an application performs poorly or is slow, it can negatively impact user satisfaction and result in lost revenue.
- Identify Performance Bottlenecks: Performance testing can help to identify performance bottlenecks, such as slow database queries, inefficient code, or network issues. By identifying these bottlenecks, developers can make the necessary optimizations to improve performance.
- Improve Application Performance: It can help developers to identify areas where application performance can be improved. Developers can improve application performance and provide a better user experience by optimizing code, database queries, or network configurations.
- Reduce Downtime and Maintenance Costs: Performance testing can help developers to identify potential issues before they become major problems. Developers can reduce downtime and maintenance costs by identifying and addressing performance issues early.
- Meet Performance Requirements: Performance testing is often required to meet performance requirements specified in Service Level Agreements (SLAs) or regulatory requirements. By testing the application or system under realistic load conditions, developers can ensure that it meets these requirements.
Common problems encountered
Some common problems that affect the performance of our application adversely include:-
- Longer load time
- Poor response time
- Decrease in throughput
- Feeble scalability
- Coding errors
- CPU utilization
- Memory utilization
- Network latency
- Disk usage
- Configuration glitches

Performance Testing Types
There are several types of performance testing, each with a specific objective. Some common types of performance testing include:
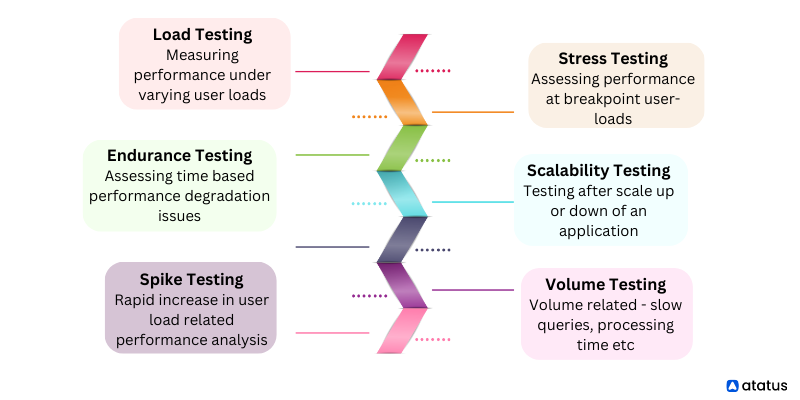
- Load Testing: Load testing is used to measure how an application performs under expected user loads. It involves simulating a realistic user load on the system and measuring the response time, throughput, and resource utilization.
- Stress Testing: Stress testing measures how an application performs under extreme user loads. It involves increasing the user load beyond the expected maximum to identify how the system behaves and where its breaking point is.
- Endurance Testing: Endurance testing measures how an application performs over an extended period. It involves running the application under a steady load for an extended period to identify if there are any performance degradation issues.
- Spike Testing: Spike testing is used to measure how an application performs when there is a sudden increase in user load. It involves rapidly increasing the user load to identify how the system reacts and whether it can handle the sudden increase.
- Volume Testing: Volume testing measures how an application performs when there is a large amount of data. It involves testing the system with large volumes of data to identify if there are any performance issues, such as slow queries, data processing times, and disk space issues.
- Scalability Testing: Scalability testing is used to measure how an application performs when it is scaled up or down. It involves testing the system under varying load conditions to determine whether it can handle increased or decreased user loads.

Performance Testing Workflow
The process of performance testing can vary depending on the specific application or system being tested and the type of performance testing being performed. However, the following are some general steps that are commonly followed during the performance testing process:
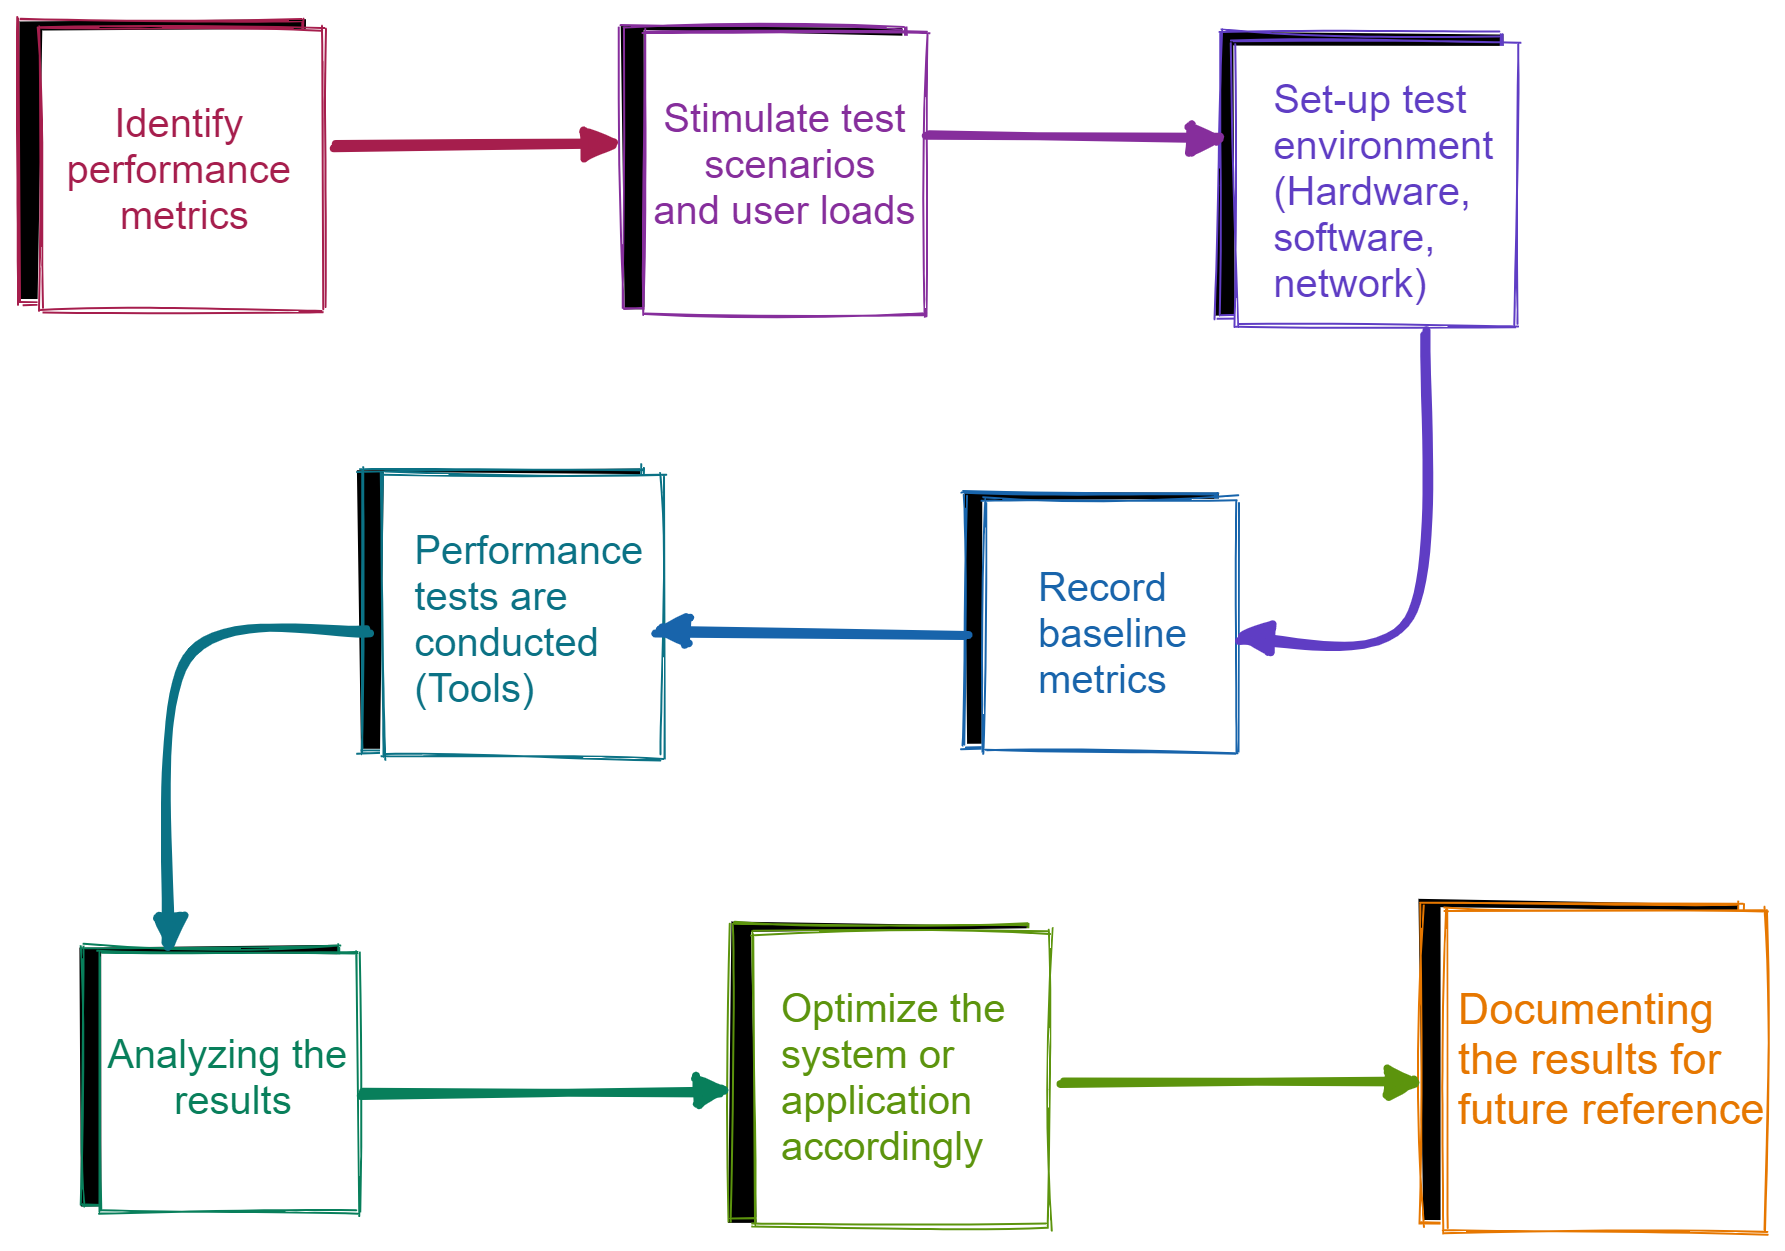
- The first step in performance testing is to identify the performance objectives for the application or system being tested. This involves identifying the performance metrics that are most important, such as response time, throughput, and resource utilization.
- Based on the identified performance objectives, the testing team will plan the performance tests to be performed. This includes identifying the test scenarios, the user load to be simulated, and the tools to be used.
- The next step is to set up the test environment, which involves creating a test environment that closely resembles the production environment. This may include configuring hardware, software, and network components as well as setting up test data.
- The baseline metrics are recorded before the performance tests are run. These metrics provide a benchmark against which the performance tests can be compared.
- The performance tests are executed using a performance testing tool, which simulates the user load on the application or system being tested. The tool measures the response time, throughput, and resource utilization during the tests.
- After the performance tests are completed, the testing team will analyze the results to identify any performance bottlenecks or issues. This may involve reviewing performance metrics, system logs, and other data to identify the root cause of performance issues.
- Based on the results of the performance tests, the testing team will work with the development team to optimize the application or system and address any performance issues. Once optimizations are made, the performance tests may be repeated to verify that the performance issues have been resolved.
- The final step is to report and document the results of the performance tests. This may include creating a report that summarizes the test results, identifying any performance issues and optimizations made, and providing recommendations for future performance testing.

Performance Test Metrics
- Response Time: This is the time it takes for the application to respond to a user request. It is often measured in milliseconds or seconds and is a critical factor in user satisfaction.
- Throughput: This is the rate at which the application can process user requests. It is often measured in requests per second or transactions per second and is important for applications with high volumes of users or transactions.
- CPU Utilization: This metric measures the percentage of CPU resources used by the application. High CPU utilization can indicate that the application is not optimized or that there are performance bottlenecks.
- Memory Utilization: This metric measures the amount of memory used by the application. High memory utilization can indicate that the application is not optimized or that there are memory leaks.
- Network Latency: This metric measures the time it takes for data to travel between the application and the user. High network latency can indicate that the application is not optimized or that there are network issues.
- Error Rate: This metric measures the percentage of errors or failures that occur during the performance test. High error rates can indicate that there are issues with the application or that the user load is too high.
- Concurrency: This metric measures the number of users or requests that can be processed simultaneously by the application. It is important for applications that have a high volume of users or transactions.
Tips for Efficient Performance Testing
Here are some tips for efficient performance testing and best practices:
- Start Early: Performance testing should be started early in the development process, ideally during the design phase. This allows for early identification and resolution of performance issues.
- Use Realistic Test Data: Test data should be as realistic as possible to simulate real-world conditions accurately. This includes data size, data type, and data distribution.
- Use Realistic User Scenarios: User scenarios should be based on realistic usage patterns and should represent the expected load on the application.
- Emulate Production Environment: The test environment should be as close as possible to the production environment to accurately simulate performance under real-world conditions.
- Monitor and Measure Performance Metrics: Monitoring and measuring performance metrics during the test allows for the identification of performance bottlenecks and issues.
- Use Automated Testing Tools: Automated testing tools can help to streamline the performance testing process and reduce the likelihood of human error.
- Test in Isolation: Testing in isolation helps to isolate performance issues and makes it easier to identify the root cause of issues.
- Test Under Various Load Conditions: Testing under various load conditions helps to identify the scalability of the application and ensures that it can handle varying user loads.
- Involve Stakeholders: Stakeholders such as developers, testers, and business analysts should be involved in the performance testing process to ensure that everyone has a clear understanding of the performance objectives and results.
- Continuously Monitor and Improve: Performance testing should be an ongoing process, with regular testing and monitoring to ensure that performance is continuously optimized and improved.
Popular Testing Tools
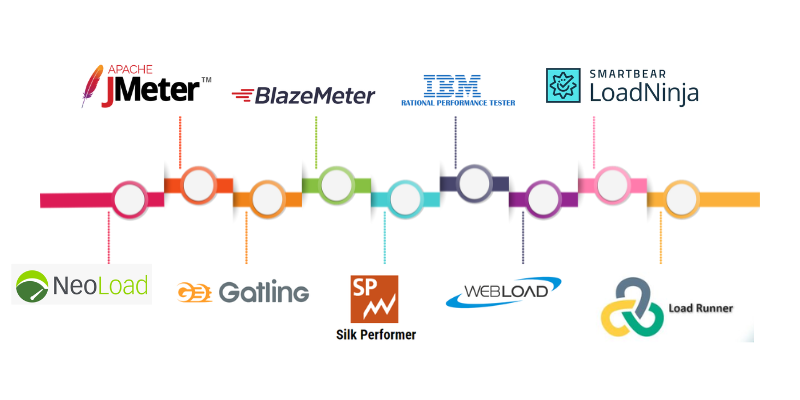
There are many performance testing tools available, both open-source and commercial, that can help organizations conduct effective performance testing. Here are some popular performance testing tools:

- Apache JMeter: Apache JMeter is a widely used open-source tool for load testing, functional testing, and performance testing of web applications
- LoadRunner: LoadRunner is a commercial tool for performance testing, load testing, and stress testing of web and mobile applications.
- k6: k6 is an open-source performance testing tool designed to test the performance of APIs, microservices, and websites. k6 supports HTTP/1.1, HTTP/2, and WebSocket protocols, and it can generate a high load of virtual users to simulate real-world traffic.
- Gatling: Gatling is an open-source load testing tool designed for high-performance testing of web applications.
- NeoLoad: NeoLoad is a commercial tool for performance testing and load testing of web, mobile, and enterprise applications.
- BlazeMeter: BlazeMeter is a cloud-based performance testing tool that enables teams to conduct performance testing and load testing of web and mobile applications.
- Apache Bench (AB): Apache Bench is a simple command-line tool for benchmarking and load testing web servers.
- WebLOAD: WebLOAD is a commercial load testing tool that supports a variety of web protocols and technologies.
- LoadNinja: LoadNinja is a cloud-based performance testing tool that enables teams to test web applications at scale and from real browsers.
- Silk Performer: Silk Performer is a commercial tool for performance testing and load testing of web, mobile, and enterprise applications.
- Rational Performance Tester: Rational Performance Tester is a commercial tool for performance testing, load testing, and stress testing of web and enterprise applications.
Choosing the right performance testing tool depends on the specific requirements of the organization and the application being tested.
Wrapping Up!
Performance testing is basically meant to gauge the current performance trends of your application program. You may consider it as a load-based assessment for your application.
To meet the demands of rapid application delivery, modern software teams need a more evolved approach that goes beyond traditional performance testing and includes end-to-end, integrated performance engineering. (But that’s reserved for another blog! 😉)
Monitor Your Entire Application with Atatus
Atatus is a Full Stack Observability Platform that lets you review problems as if they happened in your application. Instead of guessing why errors happen or asking users for screenshots and log dumps, Atatus lets you replay the session to quickly understand what went wrong.
We offer Application Performance Monitoring, Real User Monitoring, Server Monitoring, Logs Monitoring, Synthetic Monitoring, Uptime Monitoring, and API Analytics. It works perfectly with any application, regardless of framework, and has plugins.

Atatus can be beneficial to your business, which provides a comprehensive view of your application, including how it works, where performance bottlenecks exist, which users are most impacted, and which errors break your code for your frontend, backend, and infrastructure.
If you are not yet an Atatus customer, you can sign up for a 14-day free trial.
#1 Solution for Logs, Traces & Metrics
APM
Kubernetes
Logs
Synthetics
RUM
Serverless
Security
More


