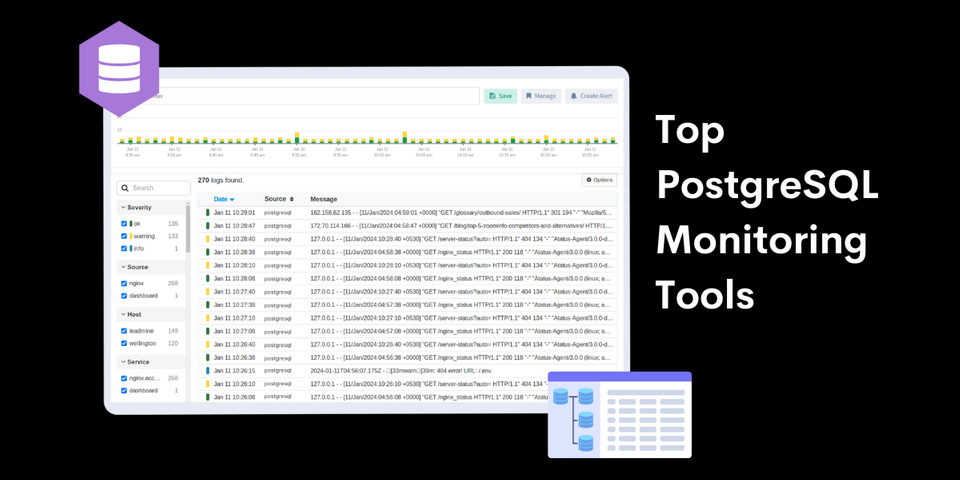
Here are the top PostgreSQL monitoring tools: Atatus, pganalyze, Datadog, Nagios Core, pgDash, Sematext, AppDynamics, pgAdmin, pgBadger, Percona Monitoring and Management, Prometheus, Zabbix
Discover the top 5 database monitoring tools for 2024. Learn why database monitoring is essential, how to choose the right tool, and explore top solutions like SolarWinds, Datadog, and Atatus.
Learn how to detect, optimize, and manage long-running queries in MySQL. This guide covers tools like slow query logs, performance schema, query optimization techniques, and preventive measures to ensure your database runs efficiently.
Learn how to effectively find and optimize slow and top queries in MySQL to improve database performance. This blog covers key strategies and explores how Atatus advanced DB monitoring streamlines query optimization for efficient database management.
Unlock ClickHouse's potential with this guide to fixing performance bottlenecks. Learn to resolve slow queries, long merges, CPU/memory issues, and more with actionable steps and a Python script.
Learn how Atatus uses MurmurHash to create query signatures for effective database monitoring. Explore Atatus tools for tracking query performance, analyzing EXPLAIN plans, and improving database efficiency. Find slow queries, minimize resource usage, and boost performance in real time.
Monitor your entire software stack
Gain end-to-end visibility of every business transaction and see how each layer of your software stack affects your customer experience.