Top 9 Synthetic Monitoring Tools in 2024
In both the corporate and personal areas, a significant portion of daily life is spent glued to screens in an era where digital transformation is widespread. We engage with many digital services, apps, and websites daily.
During these digital encounters, we occasionally encounter websites with slow-loading pages or 404/server error messages. Not only are such pages annoying, but they can also significantly cost businesses that control web properties in terms of opportunities, reputation, and revenue.
Effective website performance and availability monitoring are therefore essential for businesses. Synthetic monitoring tools make this monitoring easier by assisting IT teams in simulating website visitor requests to test features, the availability of their applications, websites, and API services, and their performance.
This article will discuss the top six synthetic monitoring tools.
We will go over the following:
The proactive monitoring of user experience is made easier and more effective with the use of synthetic monitoring tools and services. These tools will track crucial business transactions and user journeys.
#1 Atatus
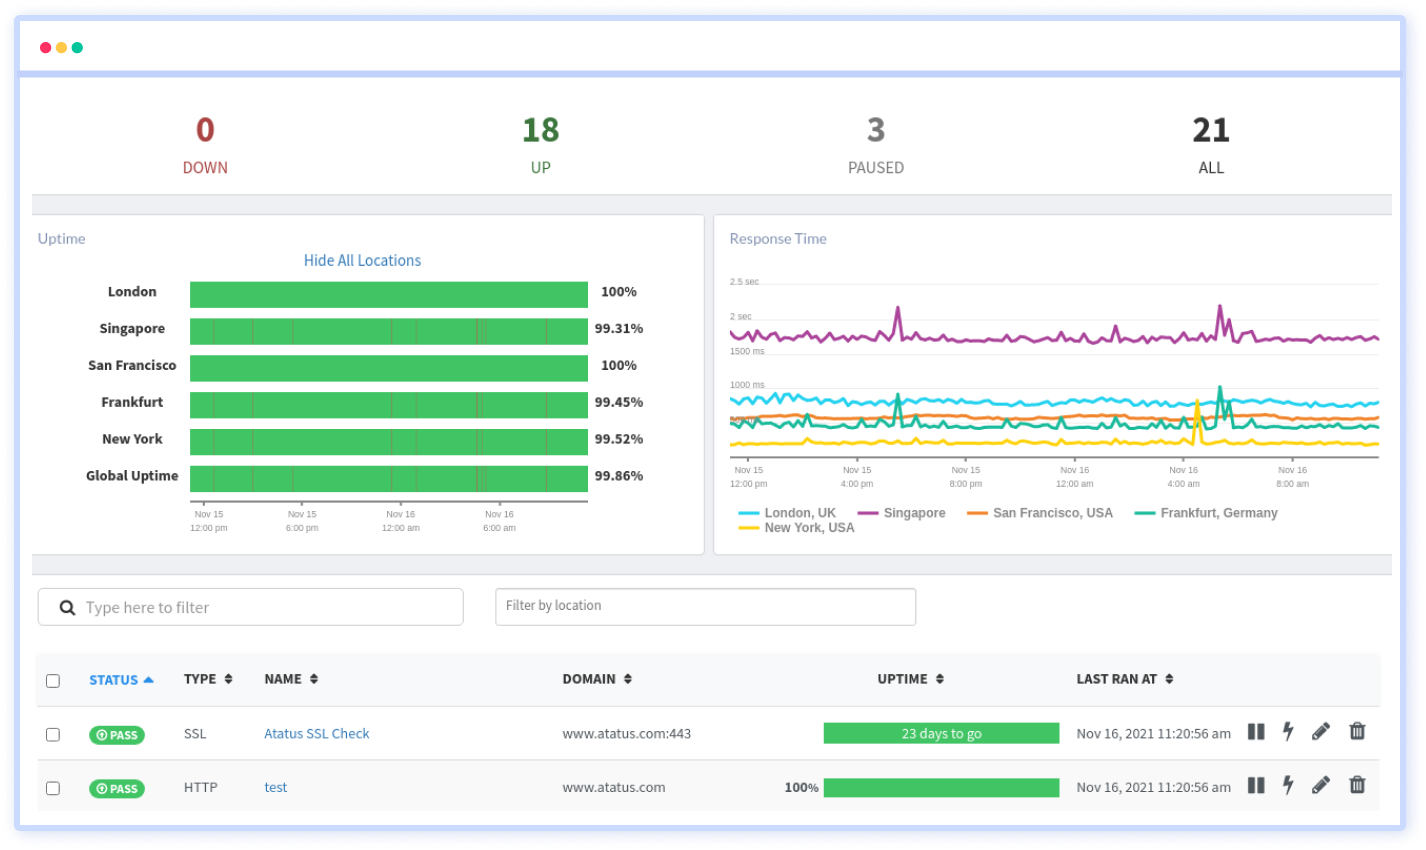
Atatus Synthetic Monitoring simulates user interaction to check the accessibility of your website or application. An easy-to-use dashboard allows you to assess the speed and operation of your application and obtain precise and useful insights.
You can evaluate each API endpoint in your application using the multistep API test, which also identifies any potential performance issues. At any phase or scenario, you can add new variables, access variables that have already been stored, and use data that has already been collected.
You can monitor your HTTPs, DNS, servers, SSL certificates, TCP, and many other things to catch errors before your customers do. You can ensure your website is accessible to users 24x7 by keeping track of errors and fixing them.
You can perform various tests using various browsers worldwide and at the specified location using Atatus Synthetic Monitoring. You can measure the actual end-user experience of your website or application at the level of the real browser.
Synthetic monitoring enables you to simply guarantee the performance, functionality, and availability of your website or service by simulating traffic in a particular location. You can actually test your application's functionality before releasing your product in a new location or having your end users interact with it.
You can create alert criteria based on the number of unsuccessful locations and retries to warn your team of critical problems. By integrating with your favorite channels, including Slack, Teams, VictorOps, OpsGenie, and many more, you can receive notifications from them.
Features:
- Customization
- Easy Setup
- Intuitive dashboard
- Keyword Monitoring
- MicroServices Monitoring
- Multiple Locations Checks
- Multiple Protocol Monitoring
- Set Assertions and Test Frequency
- Simple UI
Atatus offers a free 14-day trial period during which users have unlimited access to all functions and no credit card is necessary. We charge $0.07/month for APM, $1.96/month for RUM, $0.014/month for Infra, $2/month for Log, $1.5/month for Synthetic, and $1/month for Analytics. You can get in touch with us if you'd like a unique plan with premium support.
#2 Pingdom
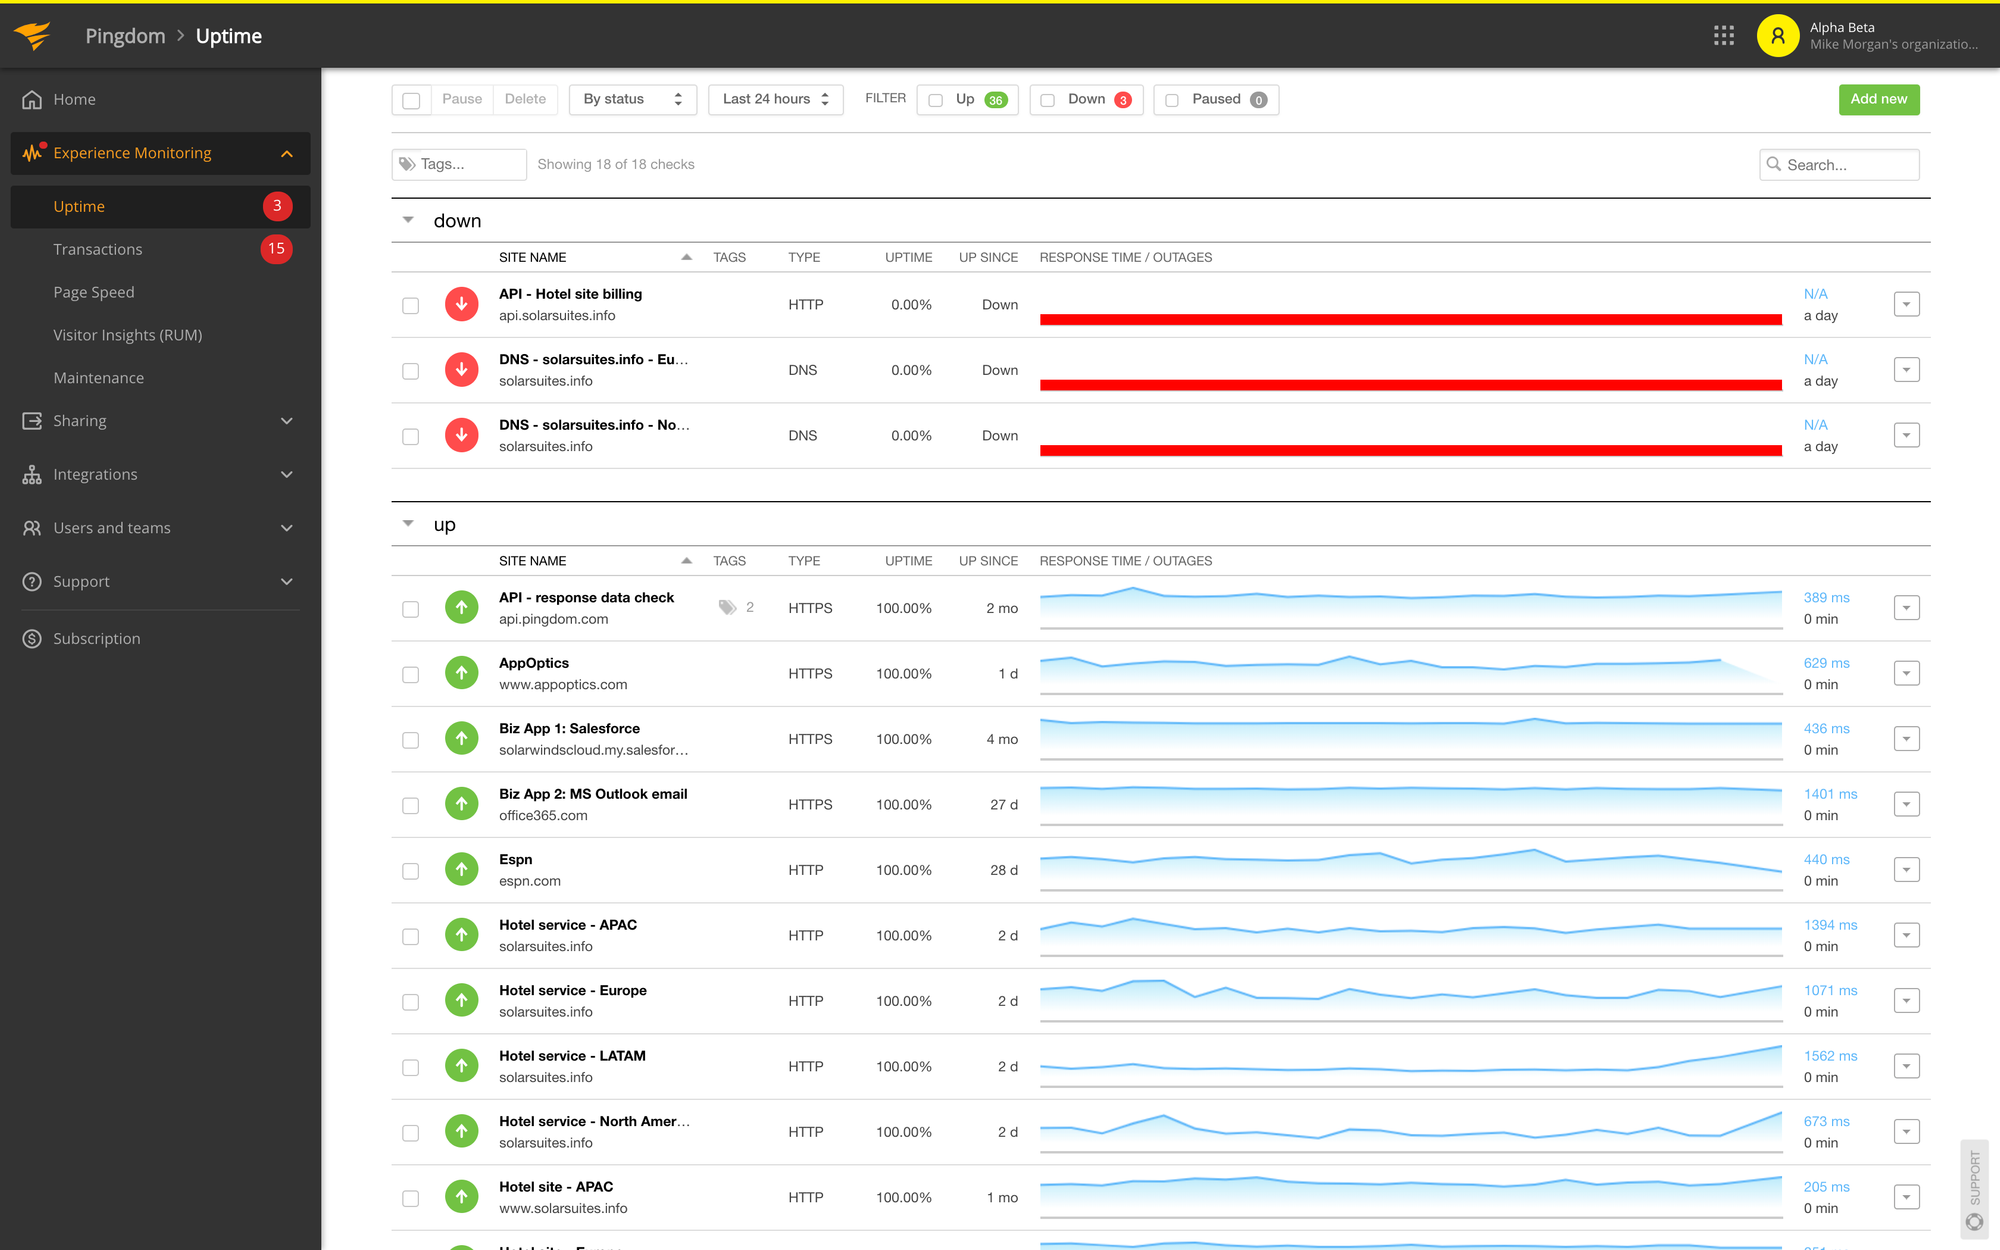
Pingdom Synthetic Monitoring is a cloud service that runs out of more than 100 data centers all over the world. It was developed using the Ping application to check the availability of servers. Pingdom focuses specifically on the performance of the internet even if it can operate across networks or the internet.
Ping is a synthetic monitoring method that is extensively used to check the availability of websites. To assess load times and transaction speed on web pages, Pingdom performs a variety of tests from several remote locations, making it more than just Ping.
Uptime, response time, and transaction monitoring are all included in the Pingdom Synthetic Monitoring service, and subscribers can choose how many of each type of test to conduct each month.
Ten times as many advanced tests are provided in each package than are available for uptime monitoring. Monitoring web transactions and response time are included in the advanced test category.
The Pingdom bundle includes downtime alerts that let you know when your website is inaccessible and keeps track of the downtime durations. You can determine which features are hurting the performance of your websites by looking at the Timeline Metrics screen in the dashboard, which ranks page elements by lag time. Users can set up test scripts that go through user tasks on a site on the Transaction Monitoring screen.
Features:
- 100 test launch locations
- Choice of test methods
- Cloud-based
- Page speed analysis
- Performance alerts
- Service Level Agreement (SLA) monitoring
- Website transaction recorder
In addition to providing synthetic monitoring, Pingdom also provides real user monitoring. A 14-day free trial is available for this service.
#3 Site24x7
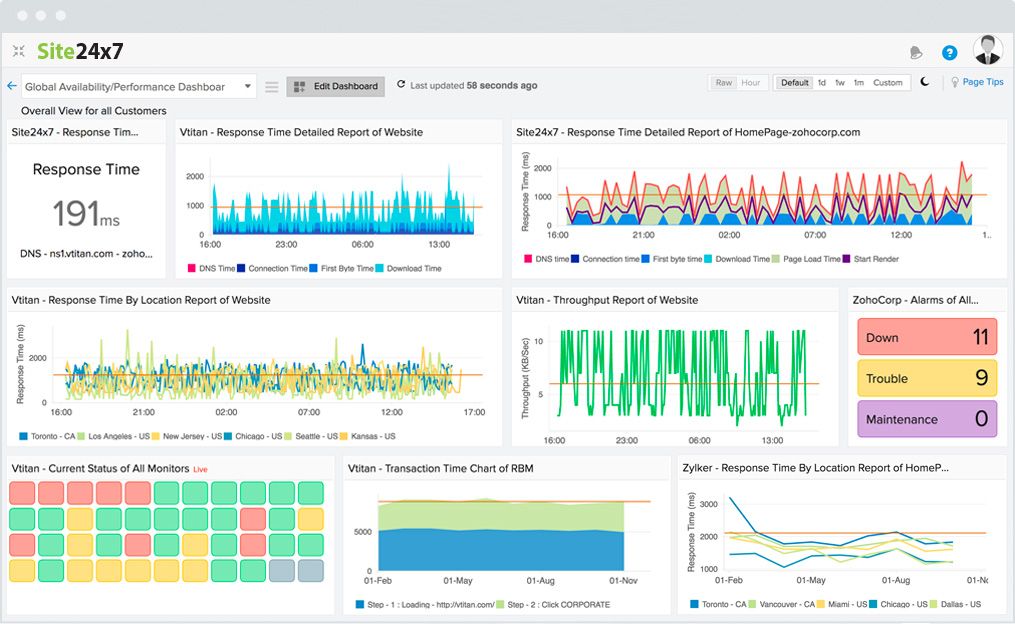
Site24x7 is a simple and excellent option for monitoring end-to-end application performance and website availability. It offers thorough reports on the issues with downtime.
Its user-friendly design includes graphs and data that are simple to understand. It offers a complete analysis of interactions' simulations throughout time.
110 data centers around the world are where Site24x7 runs its Synthetic Monitoring service. To provide uptime, response speed, and transaction monitoring systems, it offers both browser-based synthetics and Ping-based tests.
The Site24x7 Website Monitoring bundle includes the Synthetic Monitoring function. This service comes with a variety of site inspections, such as SSL certificates, DNS, and domain expiry monitoring.
The Website Defacement Monitor is a system that checks a website's code for errors. Statistics on DNS fetch times, connection establishment times, first-byte arrival timings, download times, and SSL handshake times are all included in the response time monitoring.
Features:
- 110 test launch locations
- Cloud-based
- Flexible pricing
- In-depth uptime and performance reports
- Multiple channel alerts
- Smart integrations
- Web code scanning
The four flexible pricing tiers offered by Site24x7 are Starter ($9/month), Pro ($35/month), Classic ($89/month), and Enterprise ($449/month). These rates are all for yearly billing. There is a 30-day free trial available.
#4 Datadog
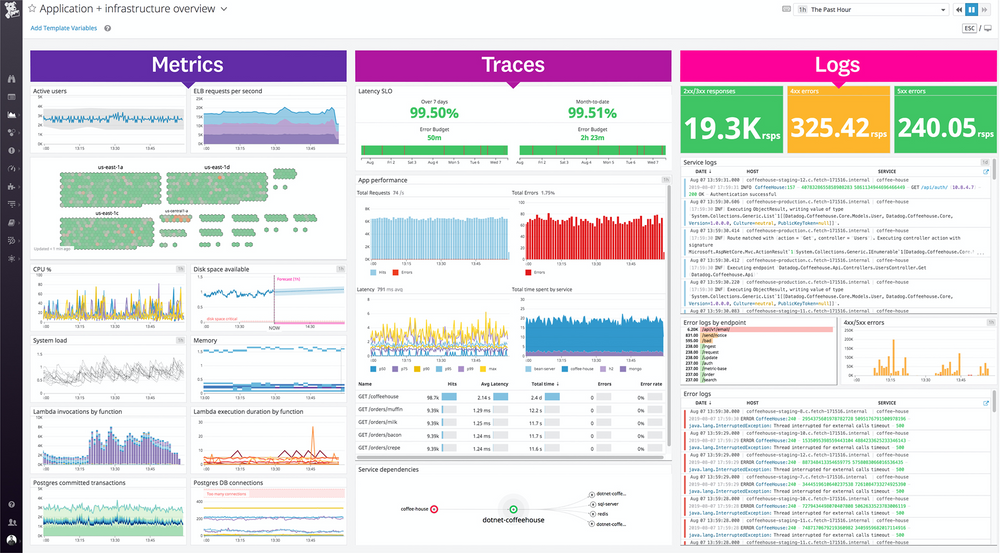
Datadog is a cloud service that uses artificial intelligence to track the performance of websites from various points across the globe. TCP requests are used for uptime checks, allowing them to simultaneously check SSL certificates and DNS servers.
The service also comes with an HTTP-based check to make that a web server is not only up and running, but also capable of finding and delivering your website's content.
Browser-based tests are started by Transaction Monitoring with Datadog by following an action script. Each run's results are presented as a waterfall graphic, which clearly shows the performance of each service that is activated by the action.
This visualization makes it simple to identify which components are delayed and whether any services failed. A machine learning-based AI service for automatic transaction testing is also provided by Datadog. It analyzes and tests each of a page's interactive components individually.
You can select the test launch location using the test launcher included with the Synthetic Monitoring package, allowing you to monitor performance as experienced by users from around the globe. For DevOps environments, synthetic testing can be incorporated into a CI/CD pipeline.
Features:
- Cloud-based
- Development testing
- Graphical data visualizations
- Live performance reports
- Option to connect to distributed tracing
- Web-Recorder
A monthly subscription for programmatic tests costs $5 per thousand test runs, while a subscription for browser-based tests costs $12 per thousand. Datadog Synthetic Monitoring is available for a 14-day trial period that is unlimited.
#5 New Relic
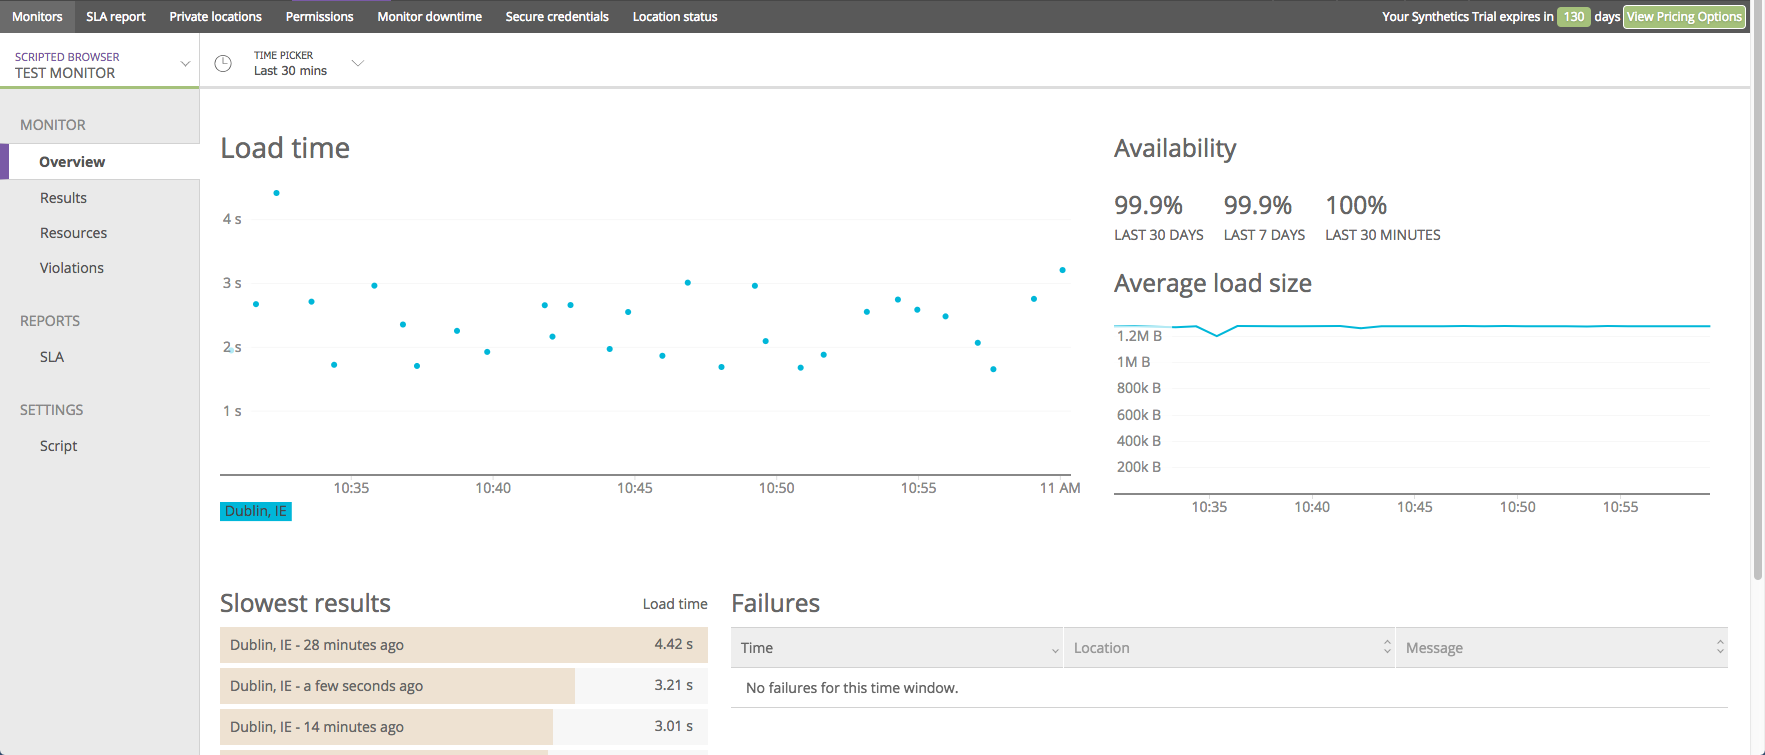
New Relic Synthetic Monitoring reduces website downtime with the help of intelligent automation and simulation approaches. It is a solution that can be customized and has advanced analytics for troubleshooting. Businesses can access complete downtime and error reports due to the solution.
By testing your system every minute from any of the eight websites across the world, New Relic Synthetics will make sure that your most important transactions proceed without error. With quick, easy, and cost-free ping tests, you can quickly check your availability.
This synthetic monitoring software uses a JavaScript-like script to create advanced tests that collect performance data and record errors that enable developers to identify the error and locate it more quickly.
While many of the locations that are made available to you when you sign up can be used to run tests, New Relic also gives you the choice to add your own private locations so that you can keep an eye on your resources from behind a private firewall or from a different location that might be more pertinent to your company.
Features:
- API testing
- browser engine data
- Easy-to-read waterfall charts
- Global test coverage
- Robust support
- Scripted browser interactions
- Testing tools available
The cost for the Telemetry Data Platform will be $0.25 per GB consumed beyond the free limit. There are three plans available for Full-Stack Observability: Standard, Pro, and Enterprise. The cost of Applied Intelligence is $0.50 for each incident and subsequent event. Some services are available on all three platforms for free.
#6 Dynatrace

With Dynatrace Synthetic Monitoring, you can simulate user interactions and experiences while monitoring your overall performance. Your entire team has access to it, and it offers thorough business information in a timeline that is simple to understand.
Dynatrace offers round-the-clock execution of monitors from private and public websites while also providing performance and availability monitoring for all your resources.
Business-critical customer journeys can be simulated and measured using their own web-based recorder. This will enable you to run all the simulations from actual browsers while still enabling you to playback scripted transactions with keyboard and mouse interactions as if they were genuine user activities and watch the crucial operations without the need for scripts.
The availability of a system and important transactions will be shown by the Dynatrace Synthetic Monitoring solution. It provides a web-based recorder to capture crucial business activities. You can use it to replay scripted transactions. Slack, VictorOps, PagerDuty, and other integrations are among those that Dynatrace supports.
Features:
- AI assistance
- Automated troubleshooting
- Browser simulation
- CDN and 3rd party performance monitoring
- Competitive analysis
- SLA compliance monitoring
The platform is available for a free trial. Three price options are available from Dynatrace: Full-stack monitoring (starting at $69 per month for an 8GB host), Infrastructure Monitoring (at $21 per month for an 8GB host), and Digital Experience Monitoring (at $11 per month for 10K units). All of these charges apply to annual billing.
#7 Uptrends
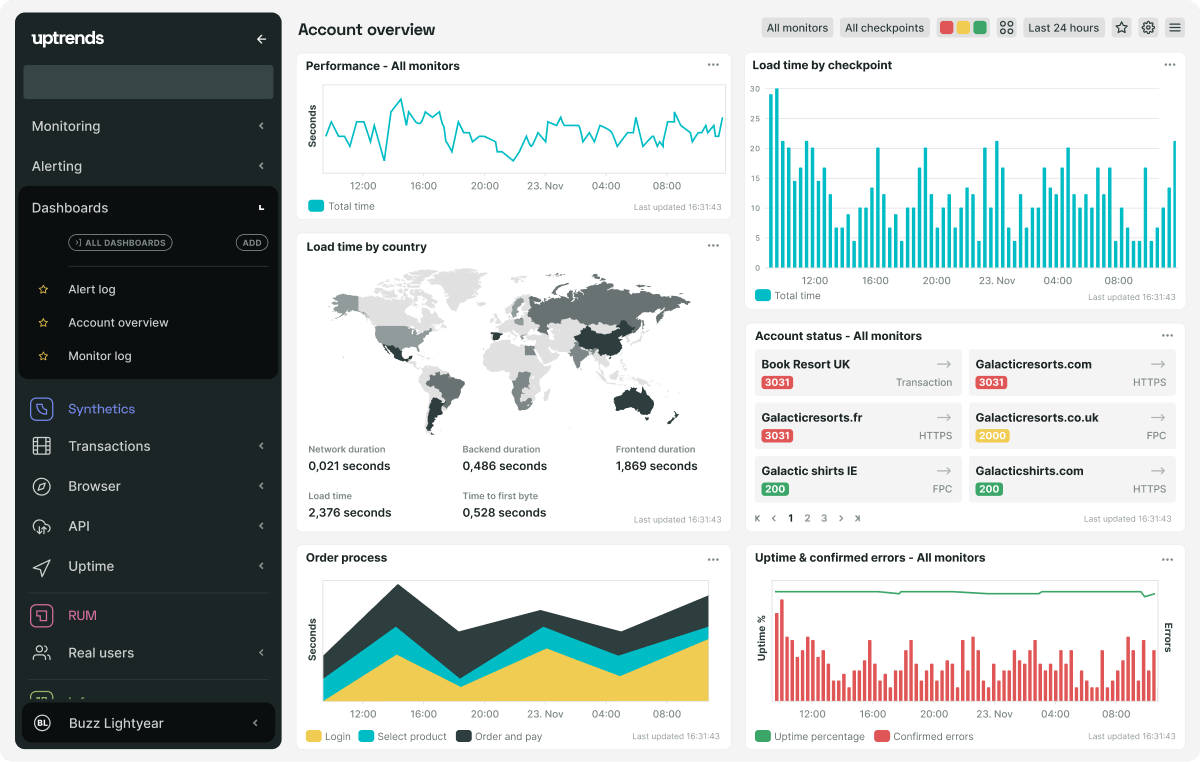
With over 20,000 users, including businesses like Virgin, Vimeo, and Zendesk, Uptrends has been around since 2007. Their primary goal is to offer users a simple synthetic monitoring solution that will shed light on their customers’ experience.
You can run automated tests to gauge the functionality of the website using the Uptrends Synthetic Monitoring platform. Emulation of a web browser is used to simulate user actions.
You can increase uptime and optimize site performance with the use of uptrends. It can produce a waterfall report and do a full-page check. It can monitor websites and web applications in a variety of ways.
There are 223 checkpoints, which they refer to as their testing locations, spread out over the globe. These enable you to conduct simulated tests that log and document any issues that might arise and even take screenshots to help you identify the problem precisely.
Uptrends include a bandwidth-limiting capability in addition to tracking uptime, page speed metrics, and transactions to assess the performance of websites under various network situations. Teams can do troubleshooting in almost real-time because of its rapid notifications and reports.
Features:
- Bandwidth throttling
- Failure snapshots
- Infrastructure monitoring available
- Monitoring of transactions and APIs
- Perform concurrent monitoring
- Simple UI
Three pricing plans are available for Uptrends: Starter ($15.47/month), Business ($21.59/month), and Enterprise ($51.58/month). A 30-day free trial is available.
#8 Sematext
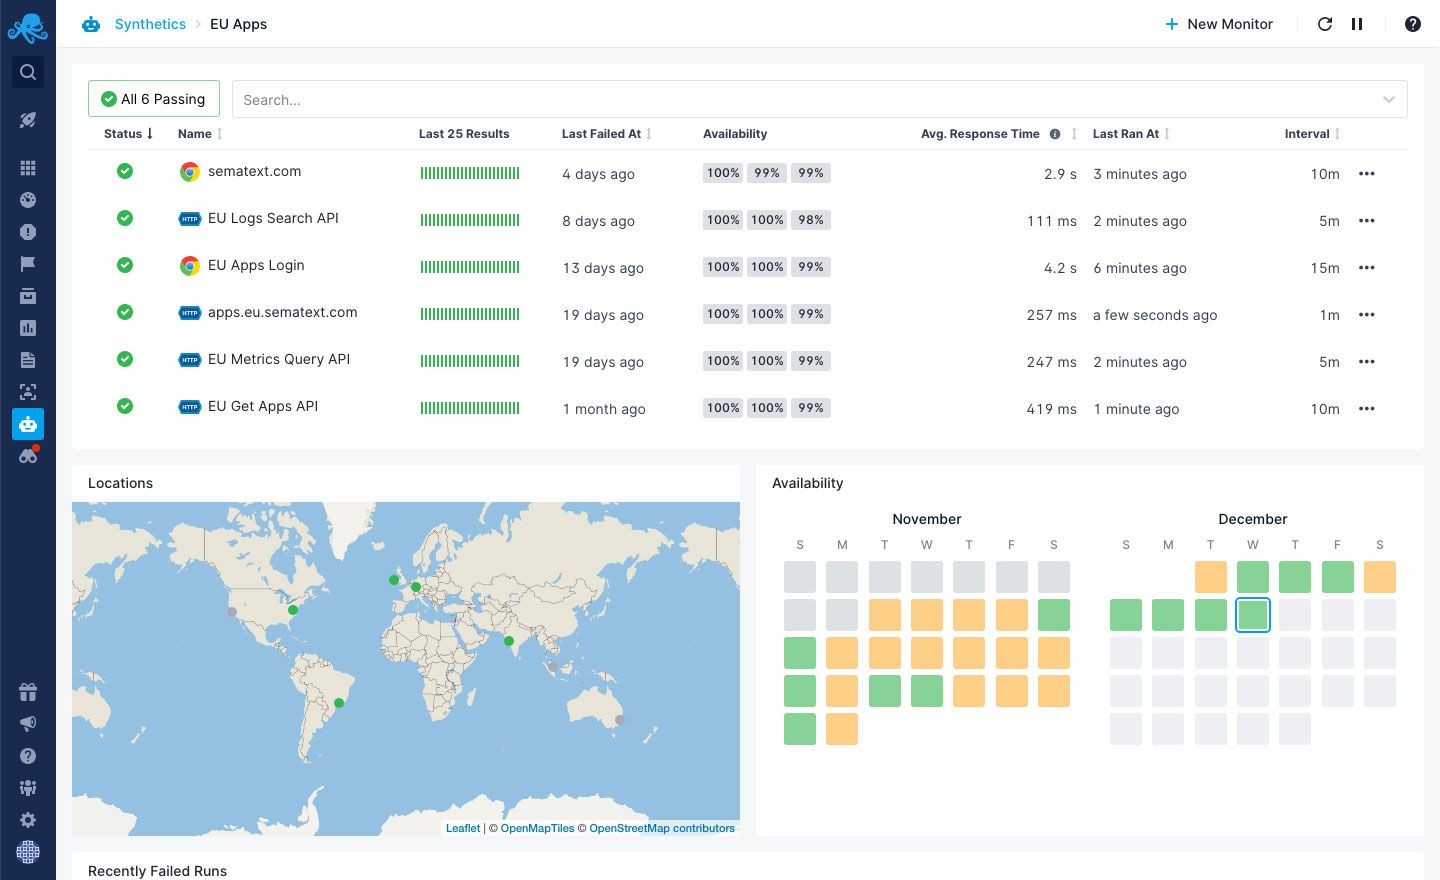
Sematext Synthetics is a powerful and user-friendly synthetic monitoring tool. You can check the accessibility of your website and application from various locations around the world.
Sematext provides statistics on error rates, page load times, and other crucial business information. Additionally, you can utilize it to benchmark against competitor websites and find areas that need optimization for better website performance.
You can watch APIs and websites from various places across the world with Sematext's synthetic monitoring service, which measures performance across various devices, browsers, and connection types.
Mission-critical metrics like website speed, error rates, SSL certificate expiry, and many more will be reported back. Even website benchmarking can be done using it to find areas that need to be optimized for better website performance.
Features:
- CI/CD Integration
- Monitors behind the firewall
- multi-step user journeys
- Pay-as-you-go subscriptions
- SSL Certificate Monitoring
Sematext Synthetics starts at $2 per monitor. Other pricing plans include Logs ($50/monthly minimum), Monitoring ($0.007/hour minimum), and Experience ($9/month minimum). There is a 14-day free trial period available.
#9 Catchpoint
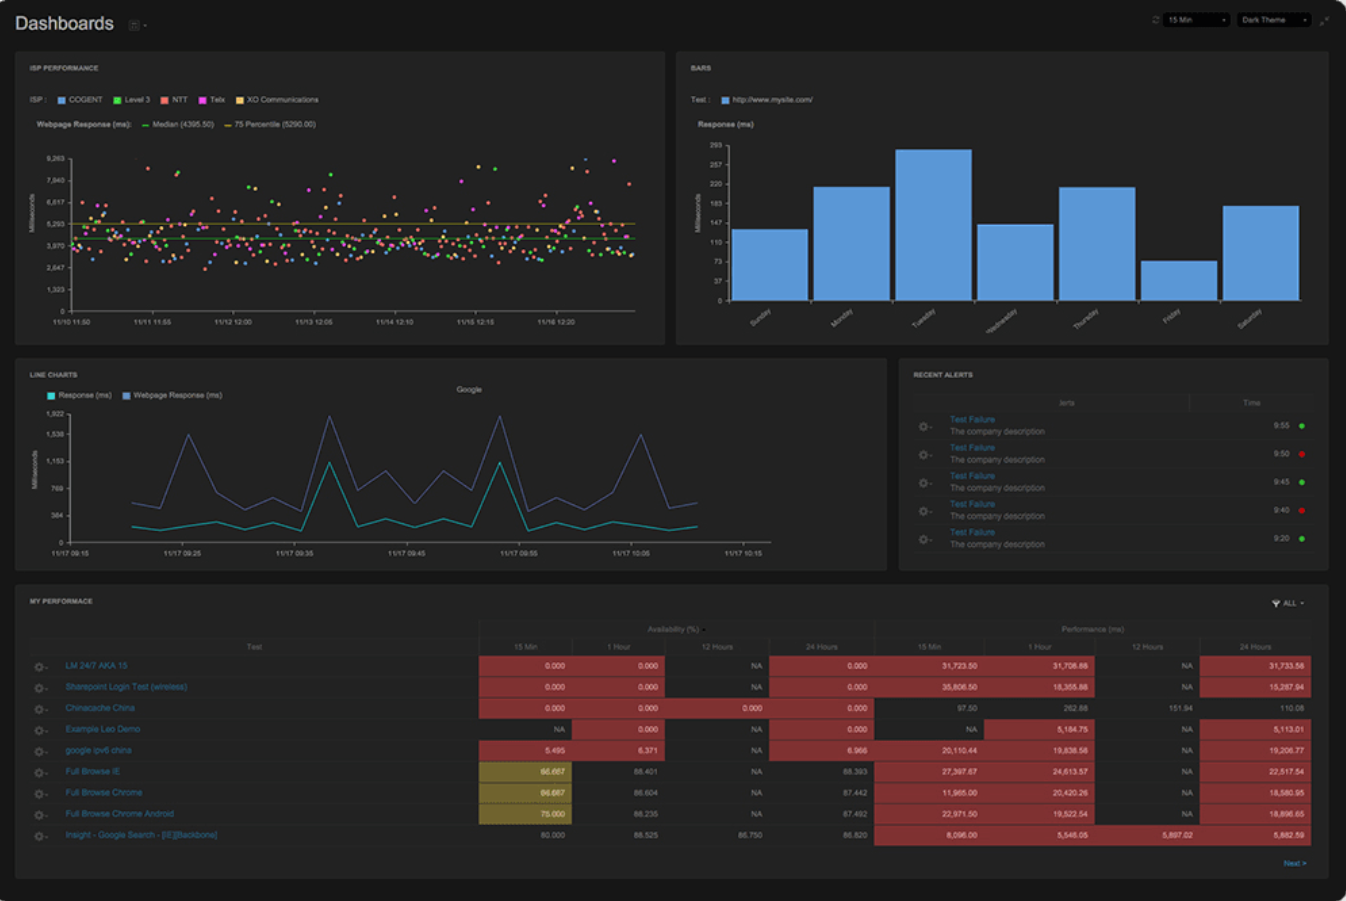
Catchpoint offers reliable solutions for continuous synthetic monitoring. Through the delivery of its advanced optimization services, it helps to enhance the overall experience. It is a Synthetic Monitoring service with more than 700 test locations throughout the world
A clever built-in alert system from Catchpoint Synthetics will activate anytime a specific threshold is exceeded. Your team can receive such notifications via a variety of channels, including but not restricted to Slack, VictorOps, and PagerDuty.
With the help of this tool, you can identify problems more quickly, assess user experiences, improve service delivery, and make sure that all of your important systems that aren't working properly are still operational.
In contrast to other solutions mentioned so far, Catchpoint also tracks websites and applications using standard internet protocols (HTTP, TCP, UDP, etc.). Additionally, MQTT is supported.
Organizations that need to track their IoT devices will find the protocol to be most helpful. Again, with over 20 different monitor types, the solution could be too complex for businesses looking for a simple synthetic monitoring solution.
Features:
- 360 Degree Visibility
- 850 + global monitoring nodes
- Analyze historical trends
- Comprehensive uptime tracking
- Quick troubleshooting
Catchpoint provides a 14-day free trial period to experience the whole product. You can also contact them for pricing.
Finally!!!
Every organization that keeps up with technological advancements and automation needs to use synthetic monitoring. Simulating and keeping an eye on the apps has become crucial in any business.
These technologies offer complete system workflow visibility. Synthetic monitoring tools conduct continuous, simultaneous tests while providing competency from beginning to end.
Synthetic Monitoring services and tools actively and continually monitor business transactions. This assists in the early detection of issues. Synthetic Monitoring uses software robots to actively simulate user interactions with IT applications and assess the efficacy and availability of those applications.
Monitor Your Application uptime with Synthetic Monitoring
Atatus is a Full Stack Observability Platform that lets you review problems as if they happened in your application. Instead of guessing why errors happen or asking users for screenshots and log dumps, Atatus lets you replay the session to quickly understand what went wrong.
We offer Application Performance Monitoring, Real User Monitoring, Serverless Monitoring, Logs Monitoring, Synthetic Monitoring, Uptime Monitoring, and API Analytics. It works perfectly with any application, regardless of framework, and has plugins.

Monitoring the uptime of your web applications is critical to ensuring a good user experience. Synthetic monitoring can help you do this by simulating user interactions with your application and monitoring the response times.
Atatus monitors the performance of your webpages and APIs in a regulated and steady manner, from the backend to the frontend, and at multiple network levels, warning you in the event of erroneous behavior such as regression, broken feature, high response time, unexpected status code, and so on.
For more information on Atatus' Synthetic Monitoring refer to this blog - Introducing Atatus Synthetic Monitoring
If you are not yet an Atatus customer, you can sign up for a 14-day free trial.
#1 Solution for Logs, Traces & Metrics
APM
Kubernetes
Logs
Synthetics
RUM
Serverless
Security
More


