Splunk vs Prometheus: A Side-by-Side Comparison [2025 Guide]
![Splunk vs Prometheus: A Side-by-Side Comparison [2025 Guide]](/blog/content/images/size/w960/2024/08/Datadog-vs-sentry--13-.png)
Splunk and Prometheus are two prominent tools in monitoring and observability, each with distinct strengths. Splunk excels in enterprise-level security and observability, while Prometheus is known for its efficient handling of time-series data.
In this blog, I have compared Splunk and Prometheus, focusing on their unique features and strengths. This can help you find the best fit for your specific monitoring needs. Some insights may reflect personal preferences.
In this blog post,
- What is Splunk?
- What is Prometheus?
- Feature comparison
- Data Collection: Tie
- Data Querying: Tie
- Data Visualisation: Splunk
- Log Management: Splunk
- Application Security: Splunk
- Alerting and Notification: Tie
- Pricing Comparison: Prometheus
- Splunk vs Prometheus: Final Verdict
- A Better Alternative to Splunk and Prometheus: Atatus
- Splunk vs Prometheus vs Atatus
What is Splunk?
Splunk is an enterprise platform designed for searching, analysing, and visualizing machine-generated data. It excels in handling large volumes of logs and metrics, offering advanced analytics and security insights. It collects, correlates, and indexes real-time data, generating alerts, dashboards, graphs, reports, and visualizations.
Splunk offers both cloud and enterprise versions of its platform. The Splunk Cloud version provides a 14-day free trial, allowing users to explore its features and capabilities in a cloud environment.
Meanwhile, the Splunk Enterprise version comes with a 60-day free trial, enabling users to experience its full suite of tools and functionalities on-premises or in a private cloud setup.
What is Prometheus?
Prometheus is an open-source monitoring toolkit focused on time-series data collection and analysis. It is known for its efficient storage model and flexible querying language.
Prometheus utilizes a multi-dimensional data model, which stores metrics as time series along with optional key-value pairs called labels. This multi-dimensional data model enables rich contextual metrics monitoring, providing deep insights into system performance.
Common features of Prometheus include scalable data collection, powerful alerting mechanisms, and seamless integration with visualization tools like Grafana.
Prometheus does not offer a cloud version, users need to deploy Prometheus on their own servers or infrastructure, handle updates, and manage its configuration.
Feature comparison: Splunk vs Prometheus
| Feature | Splunk | Prometheus |
|---|---|---|
| Metrics Monitoring | ✅ | ✅ |
| Data querying | ✅ | ✅ |
| Query Language | ✅ | ✅ |
| Application Security | ✅ | ❌ |
| Log Mangement | ✅ | ❌ |
| Visualization | ✅ | 🟡 |
| UI and UX design | 🟡 | 🟡 |
| Alerting | ✅ | ✅ |
| Documentation | 🟡 | 🟡 |
| Pricing | ❌ | ✅ |
✅ Available ❌ Not Available 🟡Limited
Data Collection: Splunk vs Prometheus
Splunk
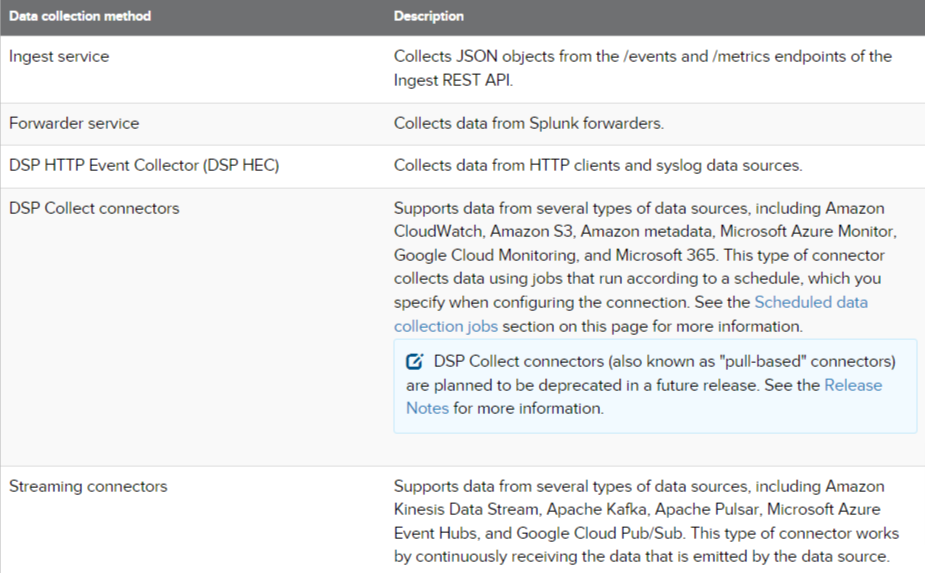
The Splunk Data Stream Processor (DSP) can collect and store large volumes of data from various sources. This data is efficiently stored in an index, allowing for effective management and analysis. It utilizes various methods to collect data from various sources. The image given below shows the different data collection methods used by the Splunk Data Stream Processor.
Prometheus
Prometheus operates on a pull-based model, where it regularly scrapes data from targets such as applications, services, or infrastructure components that are equipped with its client libraries.
It collects data by querying a list of scrape targets, which can include IP addresses and domain names. Prometheus sends an HTTP GET /metrics request to each service on this list to retrieve metrics. Any application that uses a Prometheus Client and exposes this endpoint can be monitored.
Splunk Data Stream Processor is best for managing large volumes of data from various sources. Prometheus is ideal if you need to scrape metrics from specific services.
Data Querying: Splunk vs Prometheus
Splunk
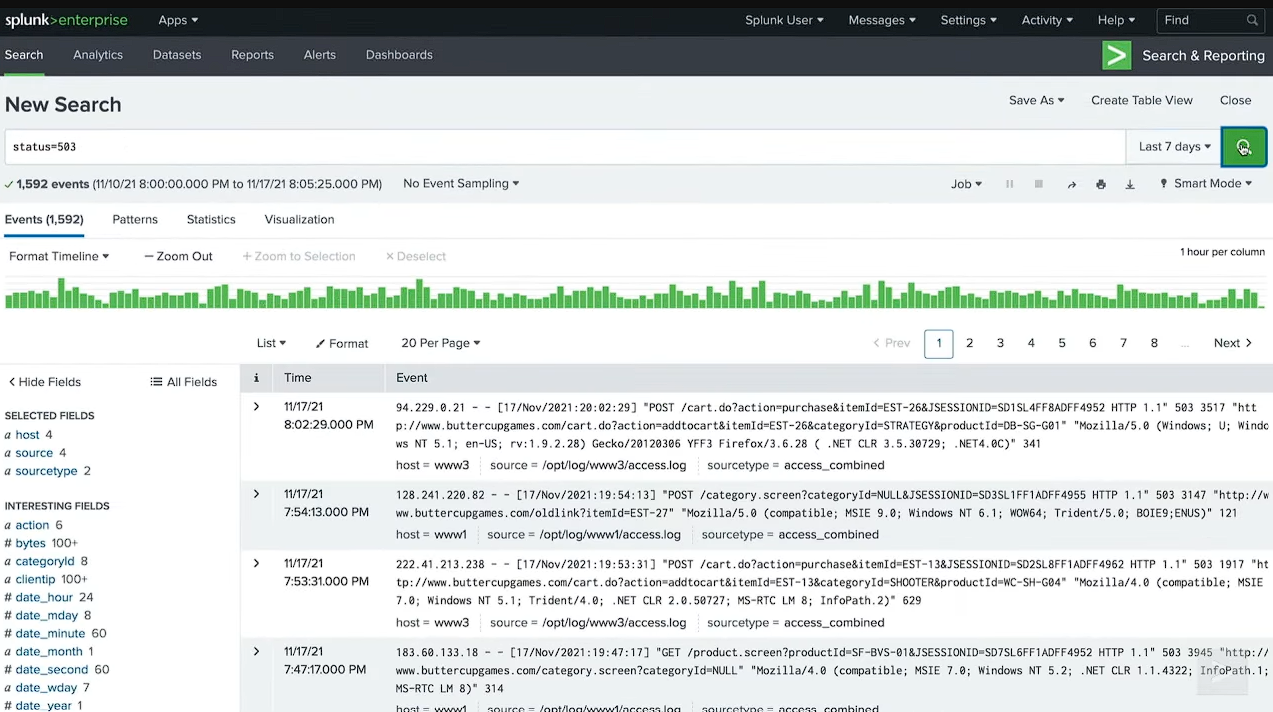
Splunk offers several methods for querying data. The easiest way is to use Splunk Search, a straightforward option available directly from the dashboard. Splunk SOAR (Cloud) provides a REST API for querying data, allowing for detailed customization from the backend.
Additionally, Splunk uses its own query language called Search Processing Language (SPL), designed specifically for searching, analyzing, and visualizing large amounts of machine-generated data.
Splunk offers easy querying through its Search, REST API, and Search Processing Language (SPL). Prometheus uses PromQL, a query language for real-time queries and visualizations.
Prometheus
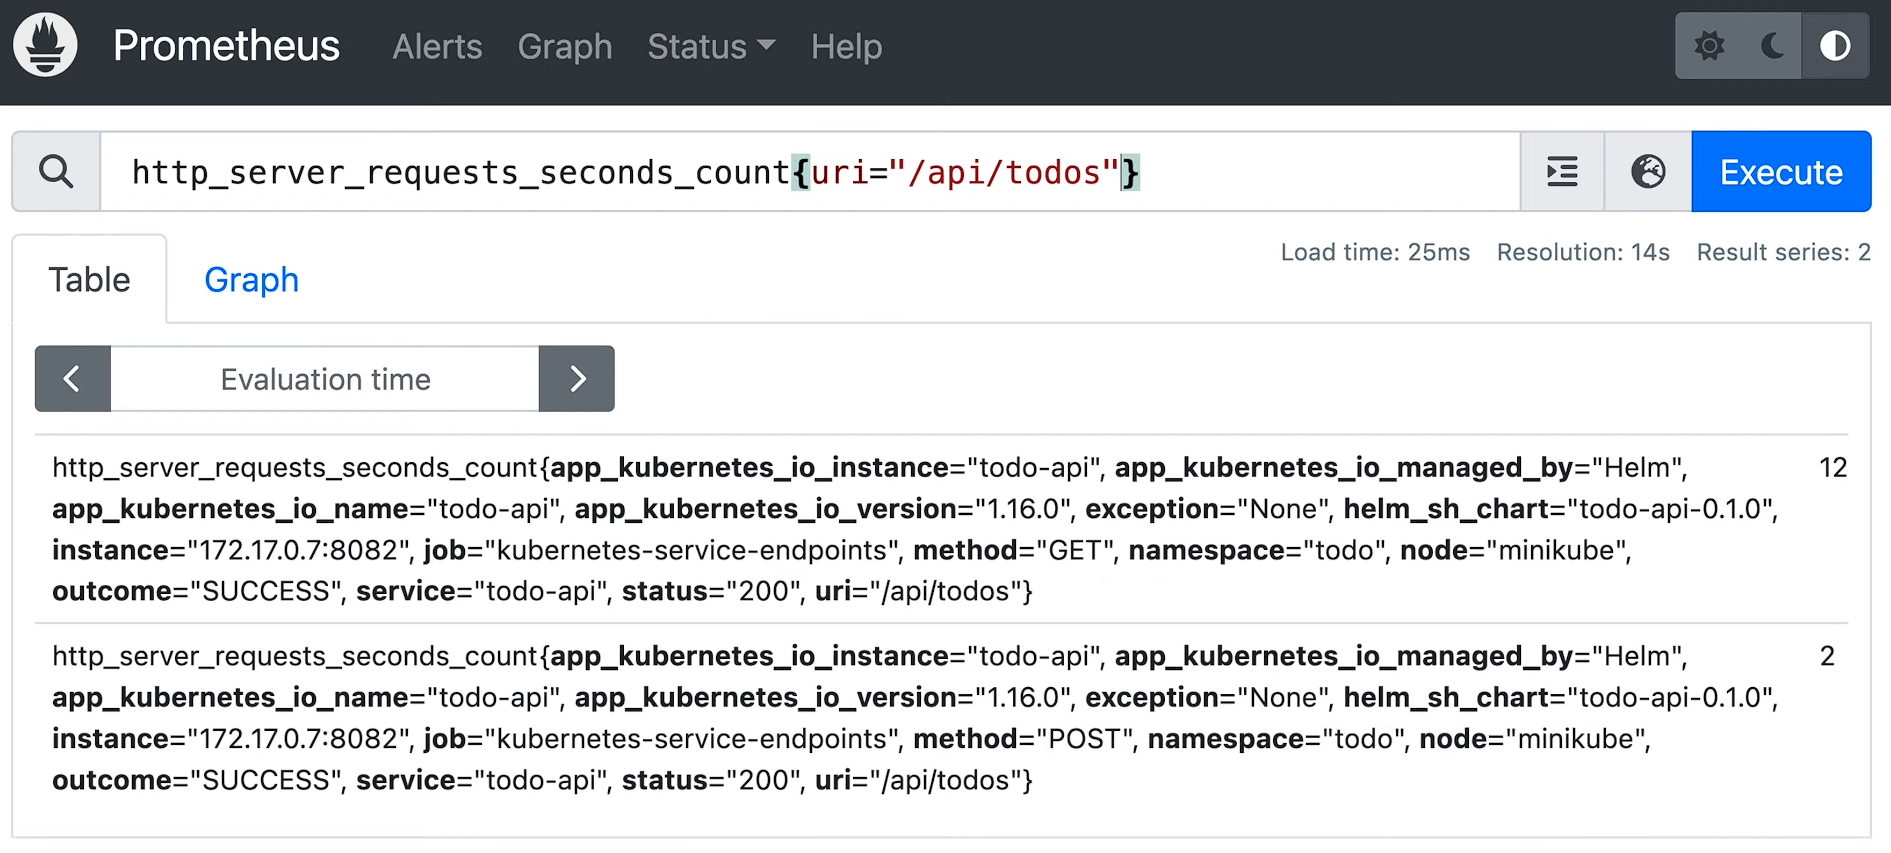
Prometheus offers a powerful query language known as PromQL (Prometheus Query Language), which allows users to select and aggregate time series data in real time. The results of a query can be displayed as a graph, viewed as tabular data in Prometheus's expression browser, or accessed by external systems through the HTTP API.
Data Visualisation: Splunk vs Prometheus
Splunk
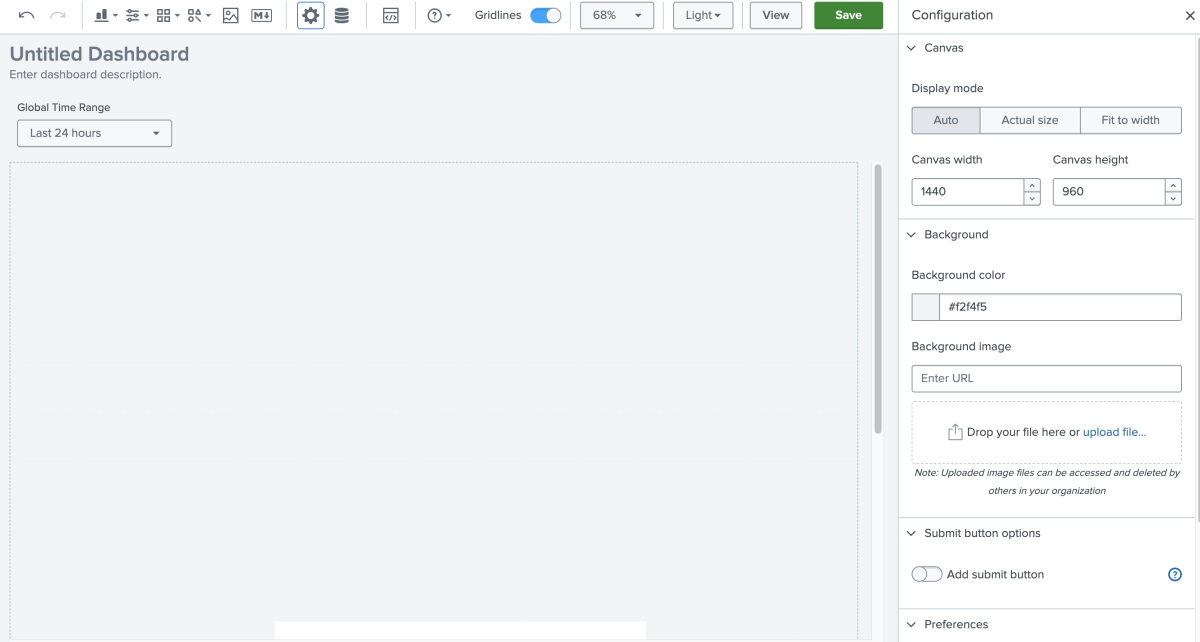
Splunk Dashboard Studio offers tools to customize dashboards in Splunk, allowing you to design the layout, colors, images, and more. It is included as a default application with Splunk Enterprise and Splunk Cloud Platform.
You can create and update dashboards using the visual editor, where the editing toolbar offers various visualisations to add to your dashboard, options to create data sources, and access to the source code editor for advanced customization.
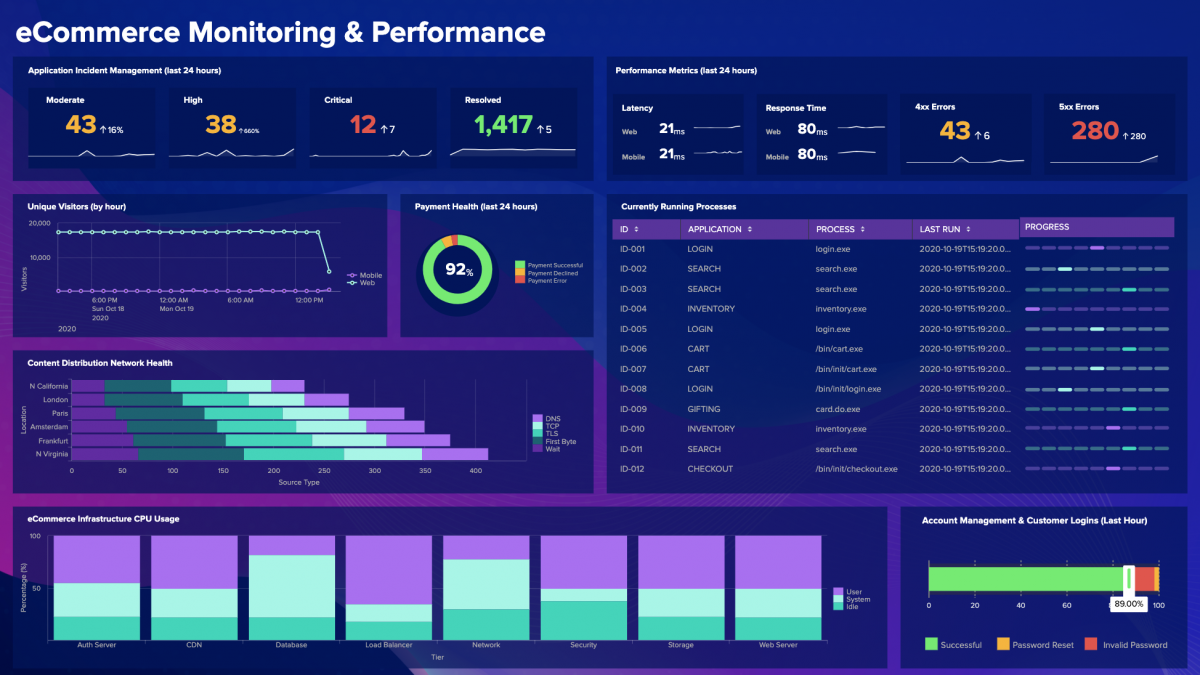
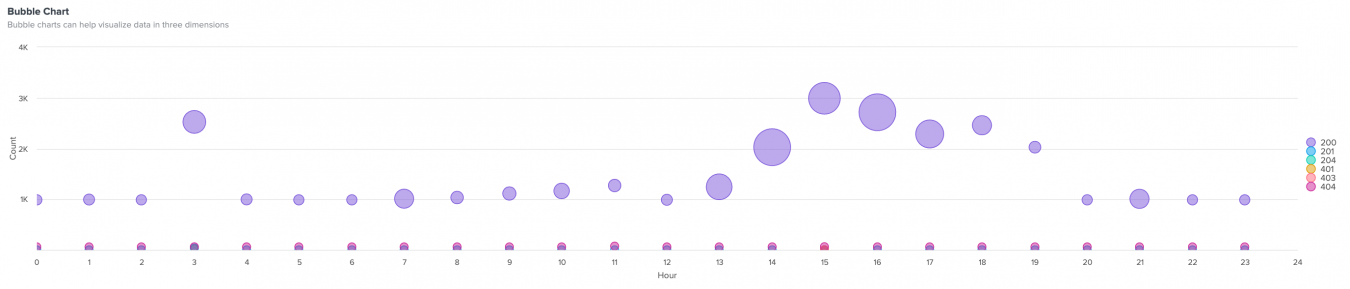
Splunk offers a variety of visualisations, including area and line charts, bar and column charts, pie charts, scatter charts, and maps. Additionally, there are options for single value visualizations, tables, and much more.
Prometheus
Prometheus supports the creation of basic charts and graphs from collected data. However, its features are limited and it does not support dashboard creation. The expression browser, available at /graph on the server, allows users to enter expressions and view results in table or graph format. For more advanced graphing and visualization, consider using Grafana or Console templates.
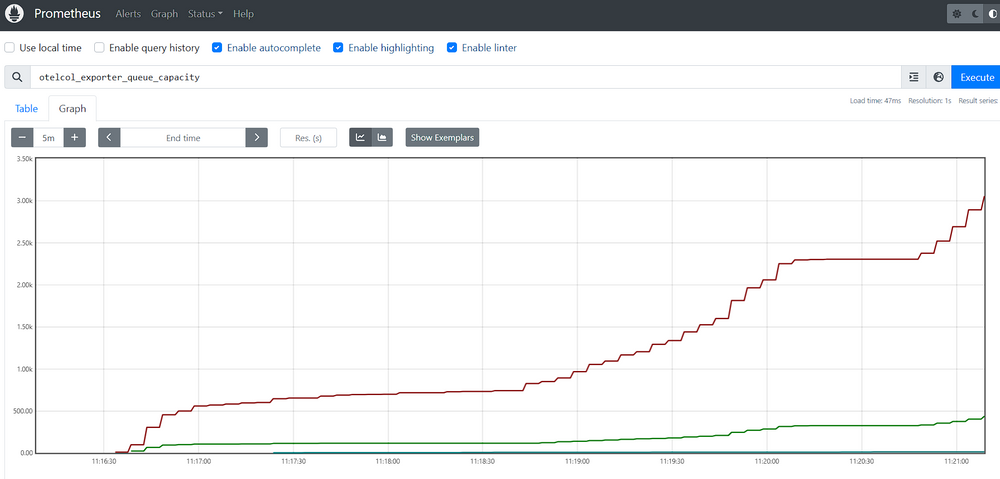
Splunk Dashboard Studio allows extensive customization of dashboards with various visualizations and advanced editing options. Prometheus offers basic charts and graphs but lacks built-in dashboard creation.
Log Management: Splunk vs Prometheus
Splunk
Splunk is well-known for its log management capabilities and can handle large volumes of data. However, it doesn't automatically collect logs from applications. To capture application logs, you need to install and configure the Universal Forwarder (UF) to ensure the data is properly formatted before being sent to Splunk.
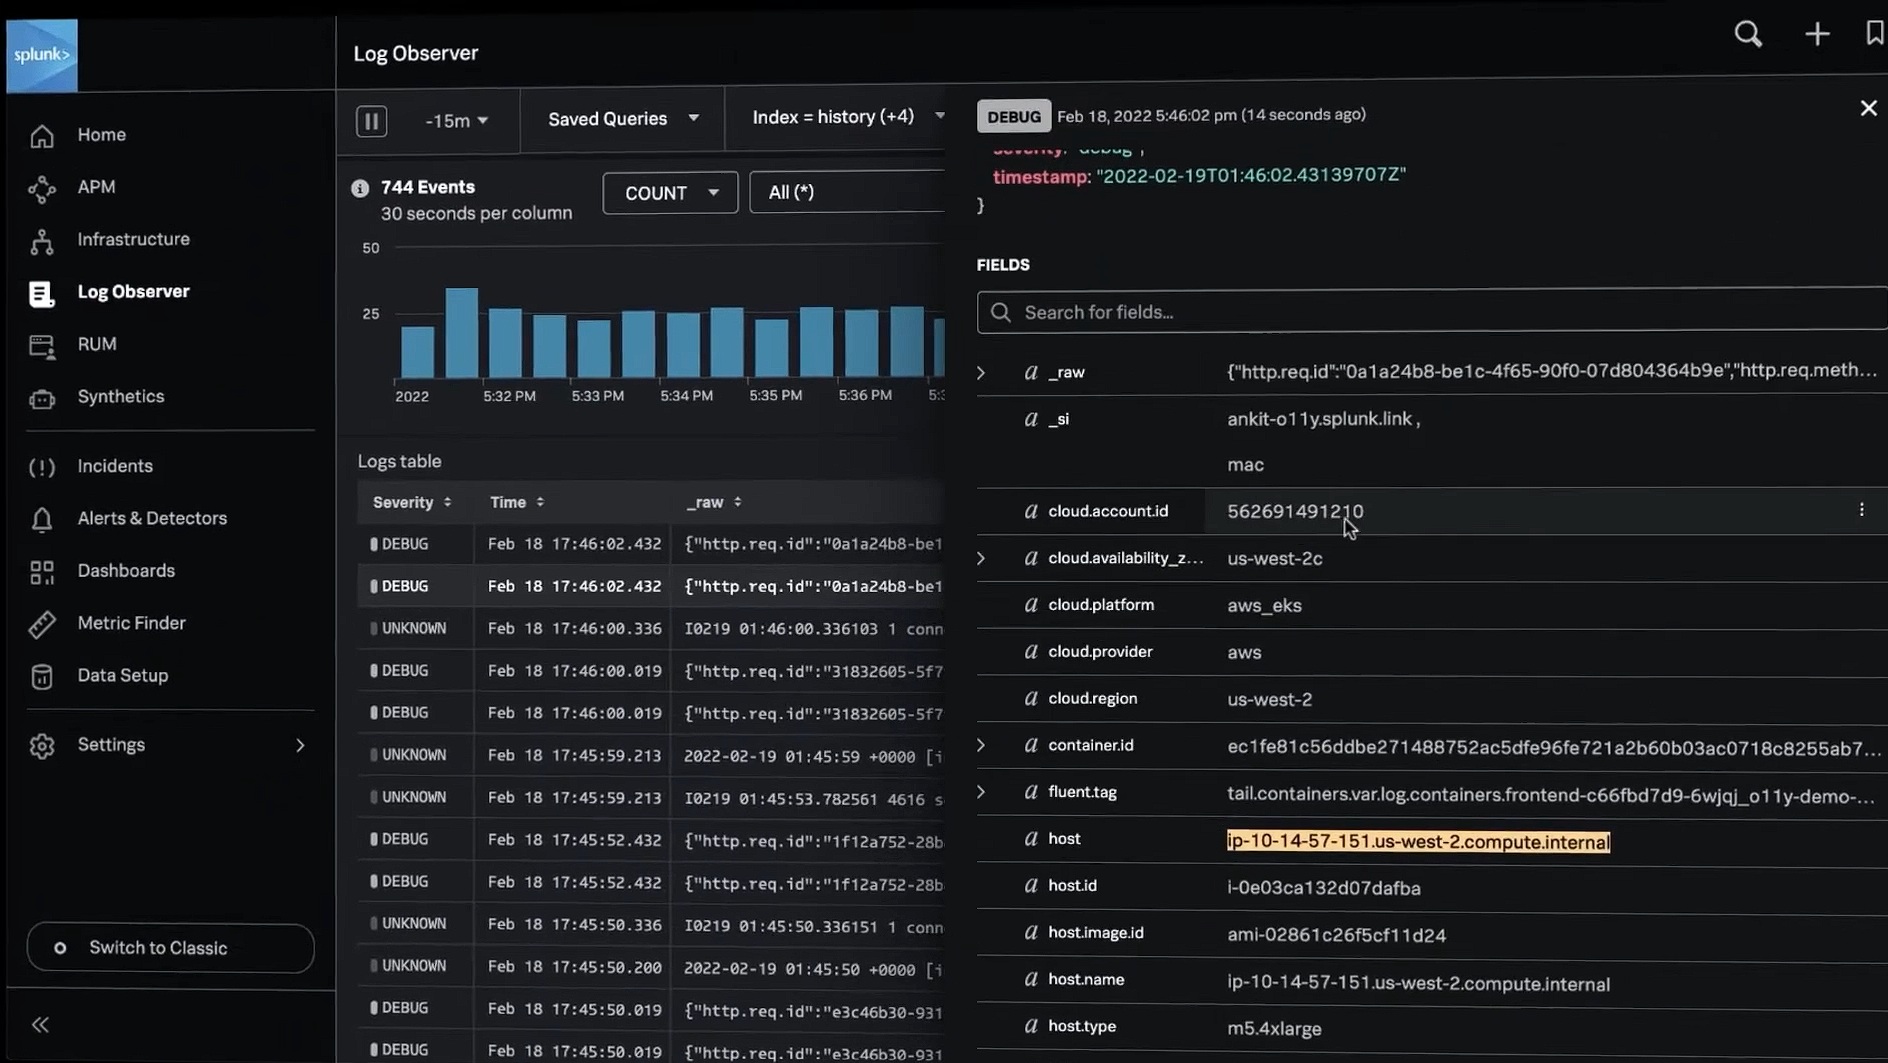
For improved log management, Log Observer Connect, a feature of Splunk Observability Cloud, allows you to easily import the same log data from your Splunk Platform into a user-friendly, codeless interface. This feature is designed to help you quickly identify and resolve issues.
Prometheus
Unlike Splunk, which excels in log management and supports comprehensive log storage, searching, and visualization, Prometheus is primarily focused on metrics. Prometheus excels in collecting and querying metrics but does not have native capabilities for managing logs. To handle logs, Prometheus must be used in conjunction with additional tools, as it lacks built-in log management features.
Splunk excels in log management with robust features for collecting, storing, and visualizing logs. Prometheus lacks native log management capabilities, needing additional tools for handling logs.
Splunk vs Prometheus: Application Security
Splunk
Splunk offers a range of security products that deliver in-depth insights into application security threats and vulnerabilities. By centralizing and analyzing data from any source or format, Splunk provides end-to-end visibility, helping to reduce response times and improve the detection and investigation of security issues.
Splunk provides two key products for security monitoring:
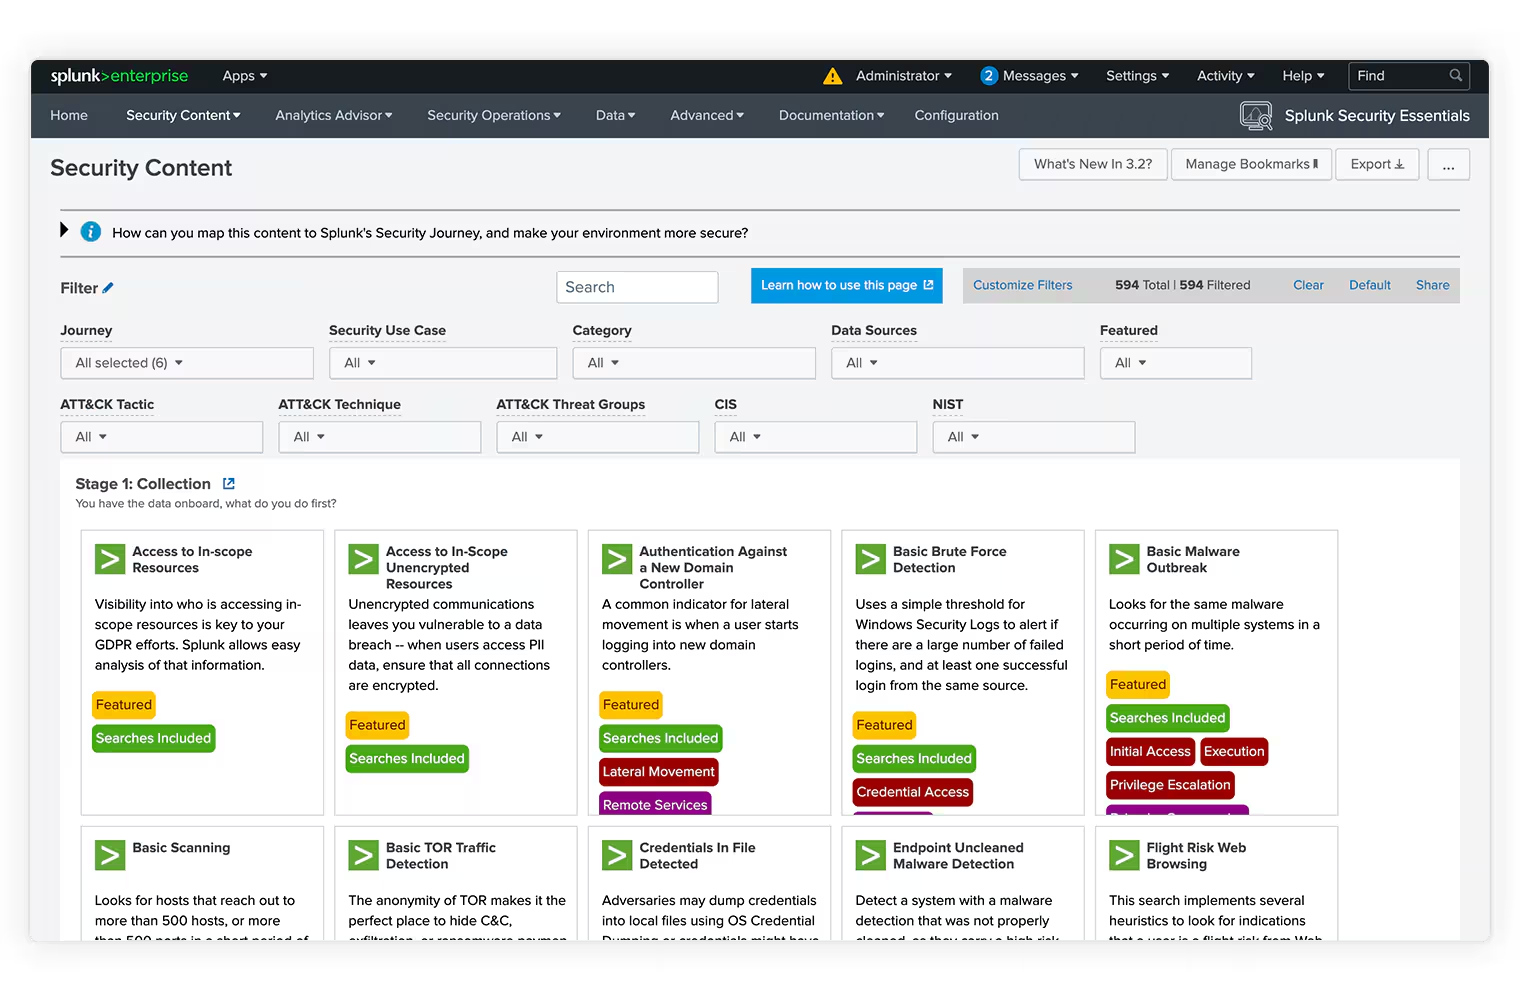
- Splunk Security Essentials.
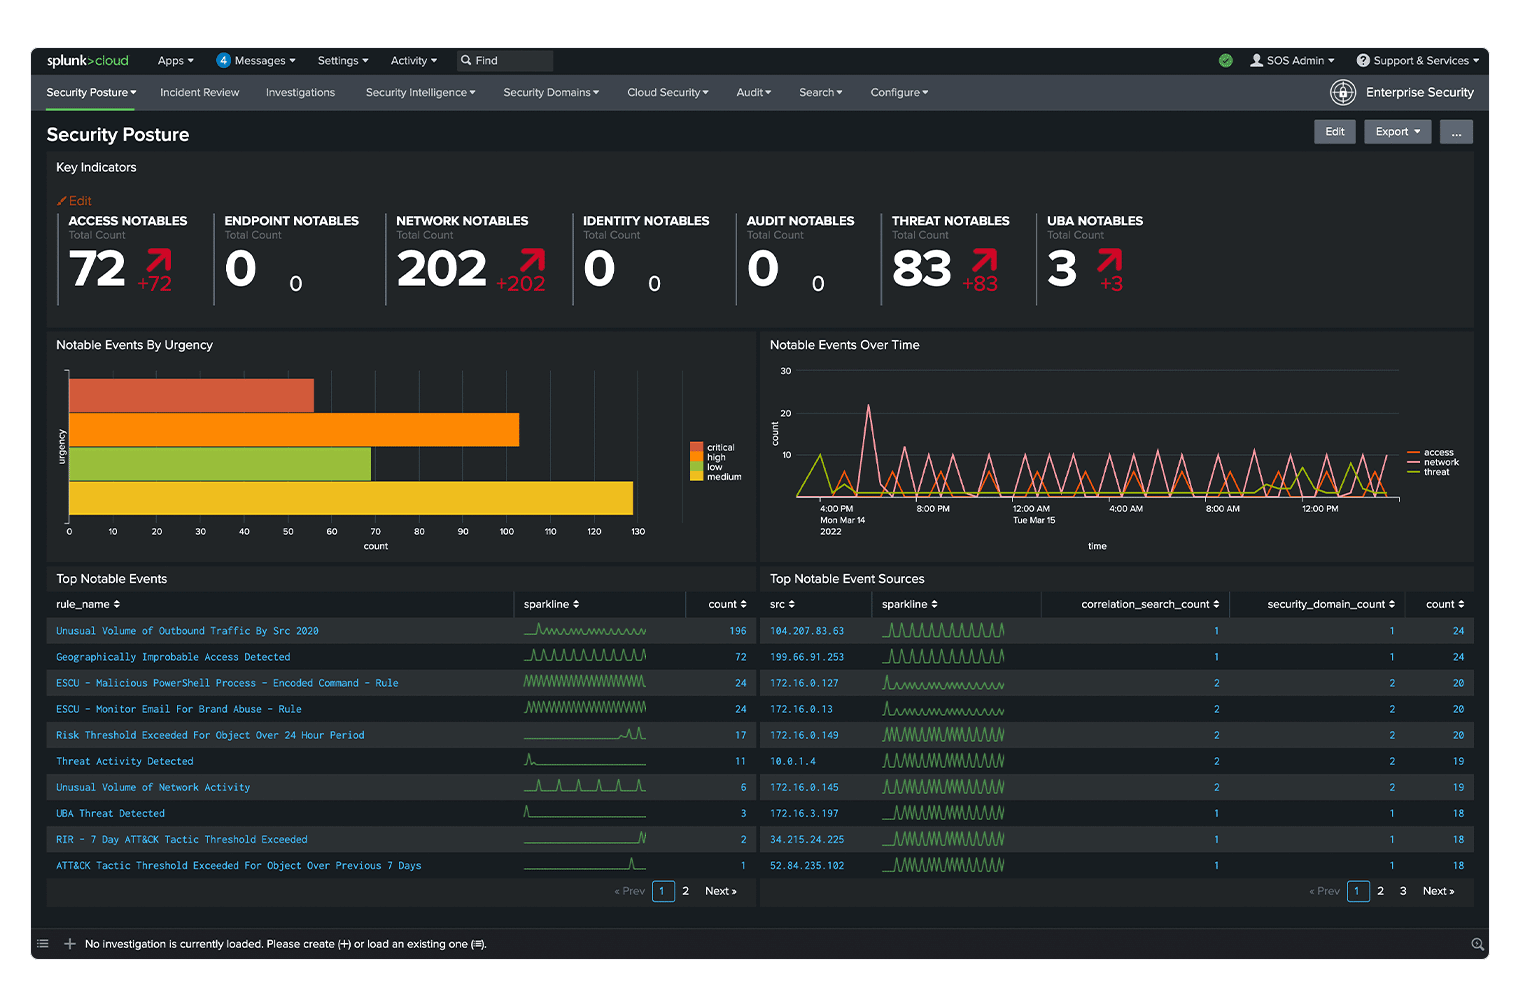
- Splunk Enterprise Security.
Splunk Security Essentials: Accelerates security use case implementation, supports a proactive security strategy, and helps address current and emerging threats.
Splunk Enterprise Security: Offers continuous security monitoring, advanced threat detection, and rapid threat investigation and response.
Prometheus
Prometheus does not focus on application security as its primary purpose is to collect, store, and query metrics from applications, and services. It lacks built-in features for application security, such as threat detection, vulnerability management, or security event monitoring.
Splunk offers robust security monitoring with tools for threat detection and response. Prometheus lacks built-in application security features.
Splunk vs Prometheus: Alerting and Notification
Splunk
Splunk provides robust alerting features that enable you to create alerts based on specific conditions and thresholds. There are two primary alerting options: Scheduled Alerts and Real-Time Alerts.
Scheduled Alerts run at set intervals and trigger when specific conditions are met.
Real-Time Alerts monitor continuously and trigger instantly when conditions occur.
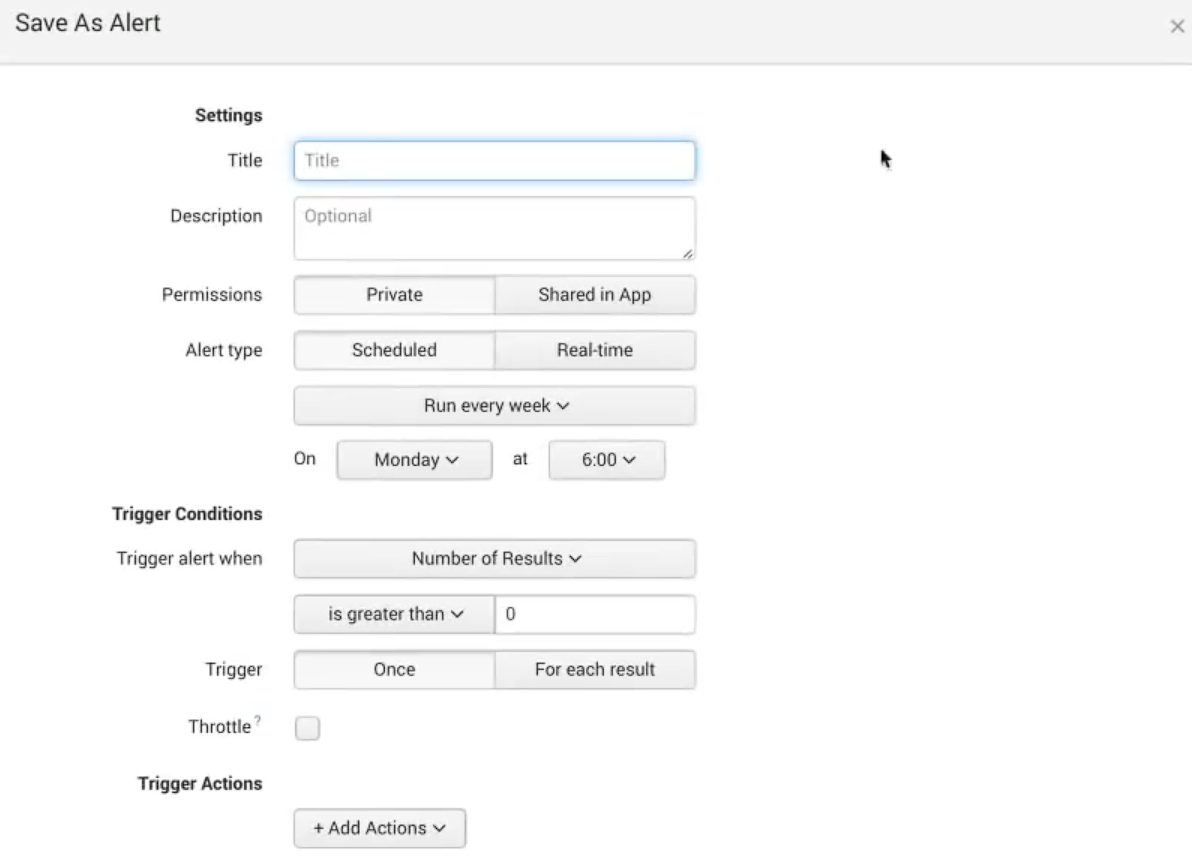
Once triggered, you can view and manage these alerts from the Activity menu, where alerts are categorized by app, owner and severity.
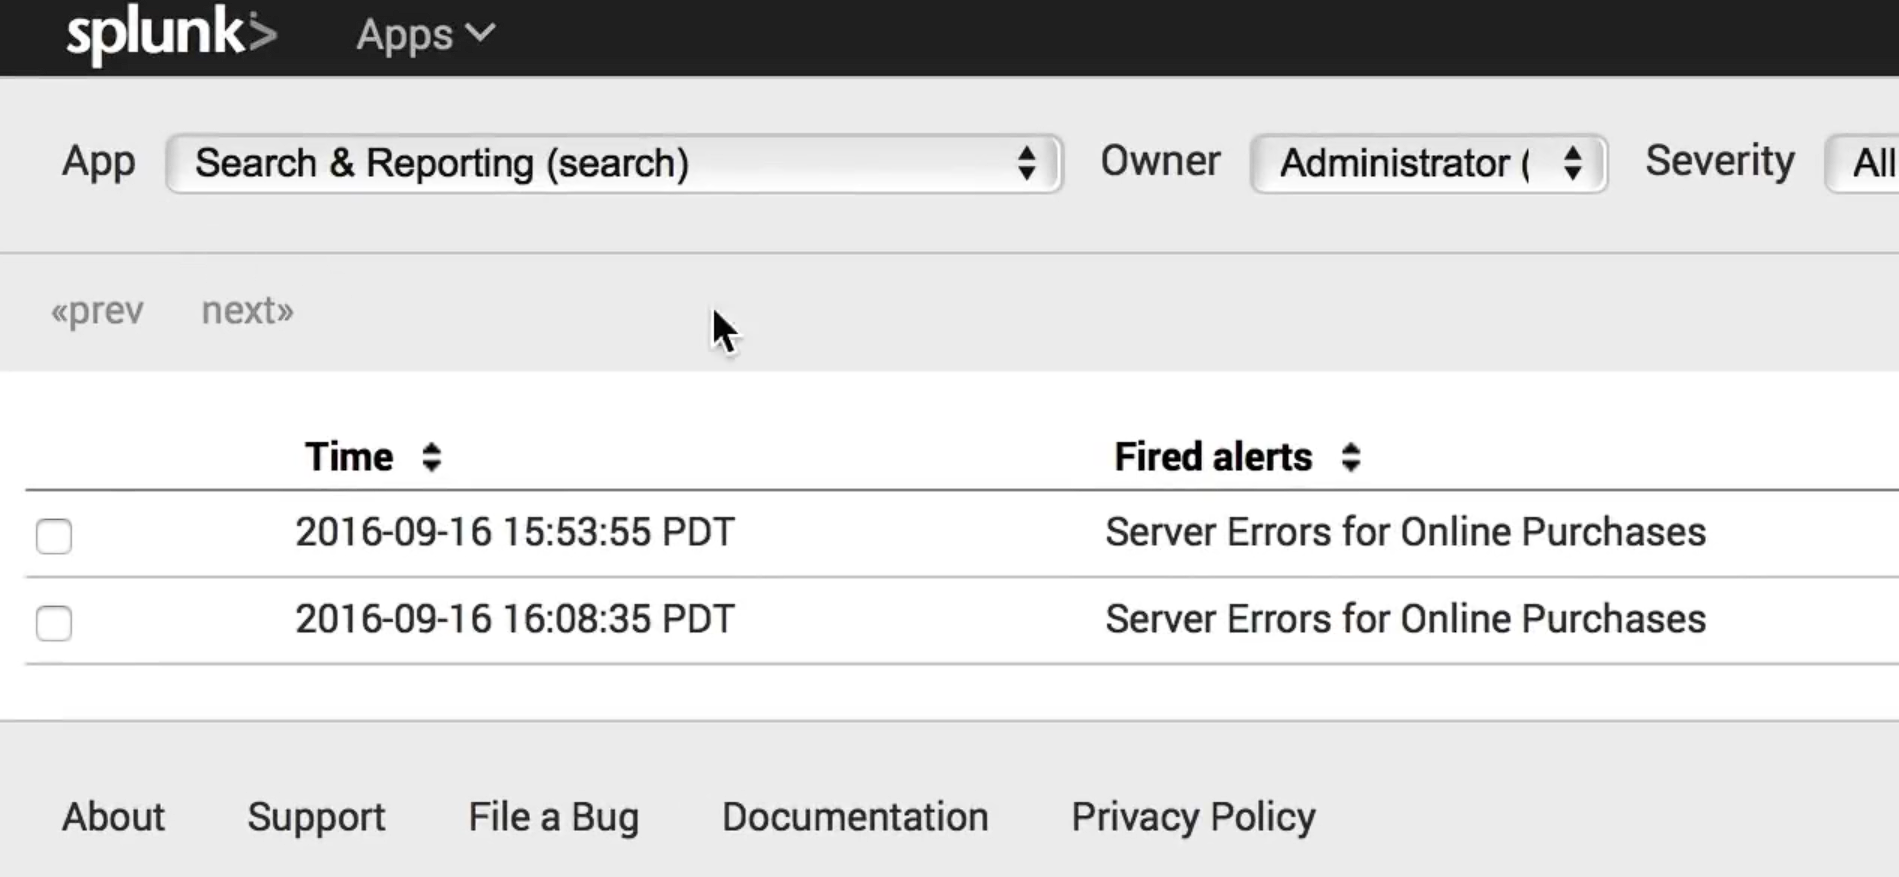
Additionally, alerts can be accessed through the Alerts option in the app menu bar, allowing you to manage them further, view information, open them in search, or make edits.
Alerts in Splunk can be sent through various channels, including Slack, PagerDuty, ServiceNow, SMS, and email, ensuring that you stay informed and responsive to critical events.
Prometheus
Prometheus does not have a built-in feature for directly setting alert rules. Instead, these are managed through a separate component known as AlertManager. When alerts are generated by client applications, like the Prometheus server, AlertManager takes care of deduplication, grouping, and routing them to the appropriate receivers, such as email, PagerDuty, or OpsGenie. It also handles silencing and inhibiting alerts.
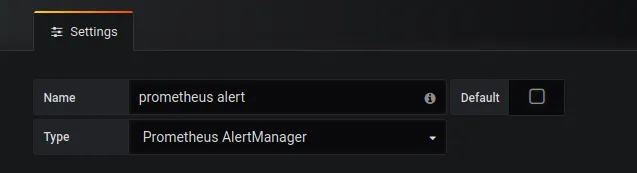
Splunk provides built-in alerting with options for Scheduled and Real-Time Alerts, sent through various channels. Prometheus uses AlertManager for handling alerts.
Splunk vs Prometheus: Pricing Comparison
Splunk
Splunk's pricing model is complex and can be costly due to the large scale of data it handles. Users can start with a 15-day free trial period.
Splunk offers several pricing options, including workload, entity, ingest, and activity-based pricing. The actual cost is not listed on the website. Users need to contact Splunk’s sales team for detailed pricing information.
Prometheus
Prometheus is open-source and free to use, with no paid version available. However, users may incur costs related to the infrastructure required for deploying and maintaining it.
Splunk is expensive and requires sales contact for pricing. Prometheus is free, but you may need to pay for infrastructure.
Splunk vs Prometheus: Final Verdict
When choosing between Splunk and Prometheus, it depends on your specific needs. Splunk is ideal for comprehensive log management, advanced security insights, and robust data visualization. Prometheus excels in metrics monitoring and is a strong choice for environments where scalability and time-series data collection are the focus.
Choose Splunk if:
- You require advanced log management.
- Security monitoring and threat detection are priorities.
- You need a wide range of data visualization options.
- Your organization handles large volumes of machine-generated data.
Choose Prometheus if:
- You need scalable metrics monitoring.
- Open-source flexibility and cost-effectiveness are essential.
- Your focus is on time-series data collection.
- You prefer integrating with other tools like Grafana for visualization.
A Better Alternative to Splunk and Prometheus: Atatus
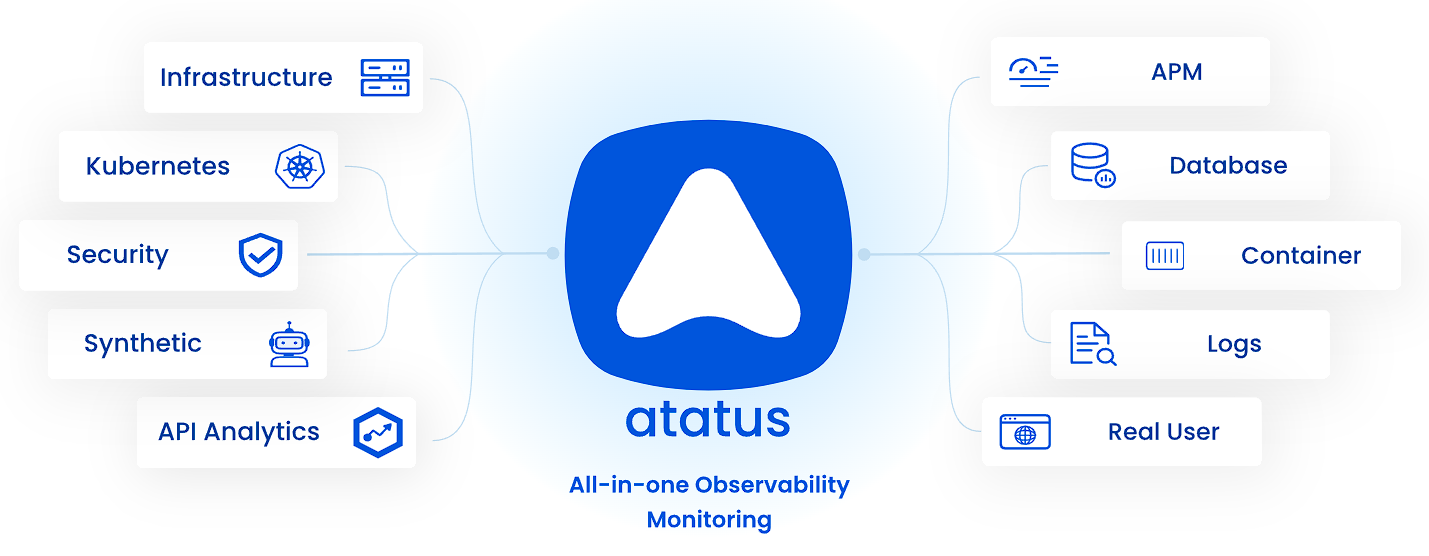
Atatus is a full-stack observability and monitoring platform that provides comprehensive visibility into your application. It offers detailed insights into your logs, metrics, and traces, all in one place.
Here are a few reasons to consider Atatus as an alternative to Splunk and Prometheus:
- All-in-One Platform: Atatus offers a comprehensive platform that integrates all your monitoring needs in one place.
- Built-in Alerting: The built-in alerting feature ensures you are promptly notified of any anomalies or performance issues.
- Custom Dashboards: Atatus provides a user-friendly interface for creating custom dashboards to display metrics, alerts, and other data, making it easy for organizations.
- Log Management: Atatus provides a flexible log management solution with an out-of-the-box UI. Correlate logs with APM traces and errors for a comprehensive view.
- APM (Application Performance Monitoring): Identify and fix spikes in endpoint failures and monitor application performance in real-time. Gain in-depth insights into transaction details, slow database queries, poor-performing network calls, and more.
New to Atatus? Try it out with a 14-day free trial.
Splunk vs Prometheus vs Atatus
When comparing Splunk, Prometheus, and Atatus, Atatus stands out with its comprehensive feature set, including application performance monitoring (APM) and a user-friendly interface. Atatus provides real-time insights into application performance and user interactions, allowing for quick identification and resolution of issues. Splunk excels in log management and visualization, while Prometheus offers solid metrics monitoring and alerting but has more limited features overall.
| Feature | Splunk | Prometheus | Atatus |
|---|---|---|---|
| Metrics Monitoring | ✅ | ✅ | ✅ |
| Data querying | ✅ | ✅ | ✅ |
| Application Security | ✅ | ❌ | ✅ |
| Log Mangement | ✅ | ❌ | ✅ |
| Visualization | ✅ | 🟡 | ✅ |
| UI and UX design | 🟡 | 🟡 | ✅ |
| Alerting | ✅ | ✅ | ✅ |
| Documentation | 🟡 | 🟡 | ✅ |
✅ Available ❌ Not Available 🟡Limited
#1 Solution for Logs, Traces & Metrics
![]() APM
APM
![]() Kubernetes
Kubernetes
![]() Logs
Logs
![]() Synthetics
Synthetics
![]() RUM
RUM
![]() Serverless
Serverless
![]() Security
Security
![]() More
More


![New Relic vs Splunk - In-depth Comparison [2026]](/blog/content/images/size/w960/2024/10/Datadog-vs-sentry--19-.png)
![New Relic vs Sentry - Which Monitoring Tool to Choose? [2026]](/blog/content/images/size/w960/2024/10/VS--1-.png)