Query Optimization in MySQL: Streamlining Slow and Top Queries with Advanced Database Monitoring
Query optimization in MySQL is essential for ensuring that your database performs efficiently, even under heavy load. While many focus on slow queries, the most frequently executed queries (top queries) can have a significant cumulative impact on performance.
This blog explores general strategies for finding and optimizing both slow and top queries, and how you can use Atatus database monitoring to streamline the process with advanced insights and faster optimization.
In this Blog:
- General strategies for finding and optimizing slow queries and top queries
- Speeding up query optimization with Atatus advanced database monitoring
General strategies for finding and optimizing slow queries and top queries
Finding slow queries
Slow queries are those that take a long time to execute. These can occur due to inefficient SQL, missing indexes, or poor database design. Here’s how you can find and optimize them:
- Enable MySQL’s slow query log: The first step in identifying slow queries is enabling the slow query log in MySQL. This log captures queries that exceed a certain execution time threshold, allowing you to isolate problematic queries.
- Use
EXPLAINto analyze queries: For each slow query, use theEXPLAINstatement to analyze how MySQL is executing it. This will show you whether the query is performing table scans, using inefficient joins, or missing necessary indexes. - Refine indexing: Ensure that your queries are using indexes effectively. Adding or optimizing indexes on frequently used columns in WHERE, JOIN, and ORDER BY clauses can drastically reduce query execution time.
- Simplify complex queries: Complex queries can often be broken down into simpler, more manageable parts. Subqueries, for instance, can sometimes be replaced with joins to improve performance.
- Optimize database design: Sometimes, slow queries are the result of poor database schema design. Review your schema and consider partitioning large tables or archiving old data to improve performance.
Finding top queries
Top queries refer to the most frequently executed queries in your application. Even if each execution is fast, the sheer volume of queries can add up and strain your database. Here’s how to identify and optimize them:
- Monitor query frequency: Identify which queries are executed most frequently. This can be done using monitoring tools or by logging queries and analyzing their frequency over time.
- Leverage caching: Frequently executed queries are prime candidates for caching. By using in-memory caches like Redis or Memcached, you can store the results of these queries and avoid hitting the database for repeated requests.
- Pre-aggregate data: For queries that involve heavy computation or aggregations, consider pre-aggregating the data and storing it in a separate table. This can reduce the need for complex calculations during each query execution.
- Use connection pooling: High-frequency queries often involve opening new database connections. Connection pooling can reduce the overhead of repeatedly establishing connections by reusing existing ones.
- Scale read operations: If your application is read-heavy, use read replicas to distribute the load of frequently executed queries. This helps balance the workload and prevents the primary database from becoming a bottleneck.
Speeding up query optimization with Atatus advanced database monitoring
While the above strategies are fundamental to query optimization, manually identifying and optimizing slow or top queries can be time-consuming and error-prone. This is where Atatus Database Monitoring comes into play, offering advanced features that make it easier and faster to identify problem queries and optimize them.
Streamline slow query identification with Atatus
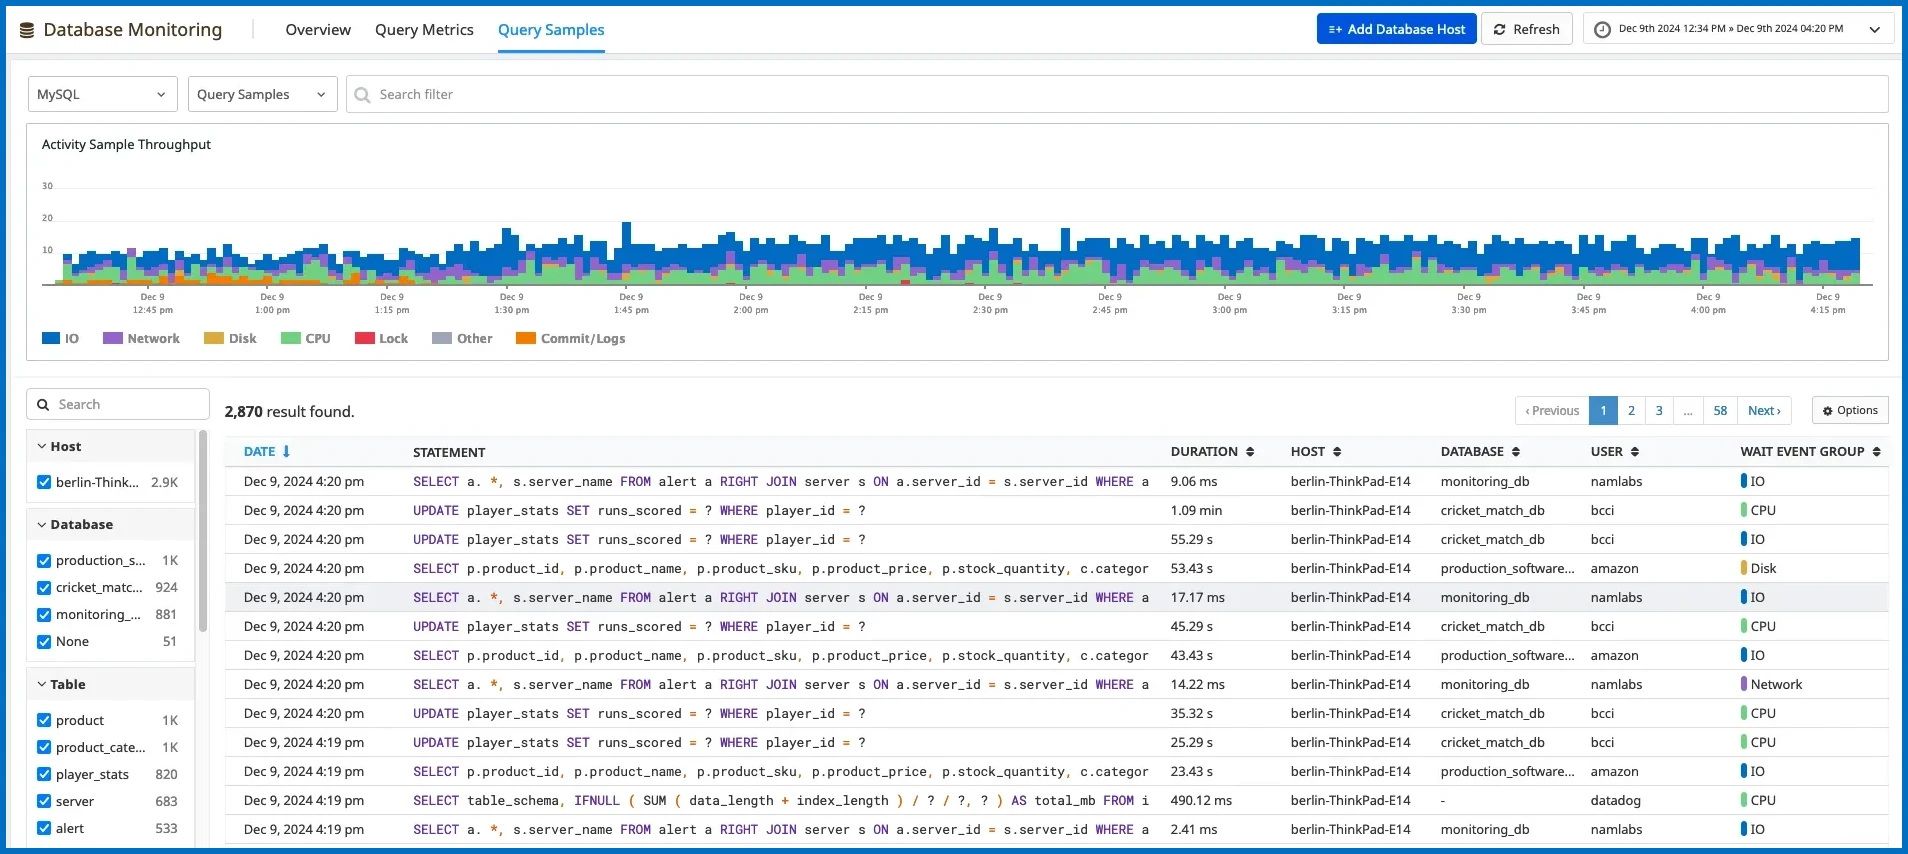
- Automated slow query detection: Atatus automatically monitors and detects slow queries in real time. With Atatus DB Monitoring, you don’t need to manually check slow query logs. Instead, the tool provides a comprehensive overview of all queries that exceed your defined threshold, allowing you to focus on optimizing the most impactful ones.
- Advanced query analysis: Atatus provides deep insights into each query’s execution, showing detailed metrics like execution time, lock wait times, and resource usage. This makes it easy to identify which queries are causing the most significant performance issues.
- Query execution plans: Atatus integrates with MySQL’s
EXPLAINfunctionality to display query execution plans directly in the dashboard. This allows you to quickly assess whether queries are performing table scans, using inefficient indexes, or suffering from other issues, helping you optimize them without manual analysis. - Performance dashboards: Atatus offers customizable performance dashboards where you can track slow queries over time. This makes it easy to identify patterns and prioritize which queries to optimize first based on their impact on the database.
Optimize top queries with Atatus
- Identify high-frequency queries: Atatus provides a query frequency analysis feature that shows the most frequently executed queries across your entire application. By identifying top queries in real time, you can take action to optimize or cache these queries before they overload the database.
- Real-time query monitoring: With Atatus, you can monitor queries as they are executed, tracking their frequency, execution time, and resource consumption. This helps you quickly spot any performance bottlenecks related to top queries, such as increased CPU or I/O usage.
- Query caching recommendations: Atatus provides recommendations for caching high-frequency queries. By leveraging Atatus' caching insights, you can determine which queries should be cached, either through built-in caching layers or by using external caches like Redis.
- Database load distribution: For read-heavy applications, Atatus helps you monitor how well your read replicas are handling top queries. This ensures that the load is distributed evenly across the database, reducing the risk of overwhelming any single node.
Prioritize optimization efforts with Atatus
One of the biggest challenges in query optimization is prioritizing which queries to tackle first. With Atatus, you can easily rank queries based on their resource consumption and overall impact on performance.

Atatus’ performance metrics allow you to see not just how long queries take to execute, but also how often they are executed and the resources they consume.
By focusing on the most resource-intensive slow and top queries, Atatus helps ensure that your optimization efforts are well-directed, maximizing the performance gains with minimal effort.
Conclusion
Query optimization is crucial for maintaining a high-performing MySQL database, and focusing on both slow and top queries is essential for comprehensive optimization.
While traditional methods for finding and optimizing queries are effective, tools like Atatus database monitoring can accelerate the process, offering real-time insights and advanced analytics to quickly pinpoint problem queries.
With Atatus, you can streamline the identification and optimization of both slow and top queries, ultimately ensuring your database remains fast, responsive, and scalable as your application grows. Take advantage of Atatus’ advanced monitoring features and optimize your MySQL queries faster than ever before.
#1 Solution for Logs, Traces & Metrics
APM
Kubernetes
Logs
Synthetics
RUM
Serverless
Security
More


