New Relic vs Prometheus - Key Feature Comparison 2025
New Relic and Prometheus are two popular monitoring tools that serve distinct purposes. New Relic provides in-depth application performance monitoring with real-time insights. Meanwhile, Prometheus, an open-source tool, excels in time-series data collection.
In this article, we have compared New Relic and Prometheus on key features such as data collection, data storage, data querying, visualization capabilities, and documentation. Also, we have provided a final verdict to help you choose the tool that best suits your needs.
In this Article:
- What is New Relic?
- What is Prometheus?
- New Relic vs Prometheus: A Detailed Comparison
- New Relic vs Prometheus: Final Verdict
- Atatus: A New Relic and Prometheus alternative
- New Relic vs Prometheus vs Atatus
What is New Relic?
New Relic is a cloud-based observability platform designed to provide engineers with real-time insights into the performance and behaviour of digital systems. The platform includes over 30 capabilities and supports more than 750 integrations. It uses AI-powered insights to help users debug issues and improve performance.
It offers a broad range of features, including Application Performance Monitoring (APM), log monitoring, infrastructure monitoring, and real-user monitoring. Thus, New Relic gives a complete view of your system, making it easier to monitor and improve reliability and efficiency.
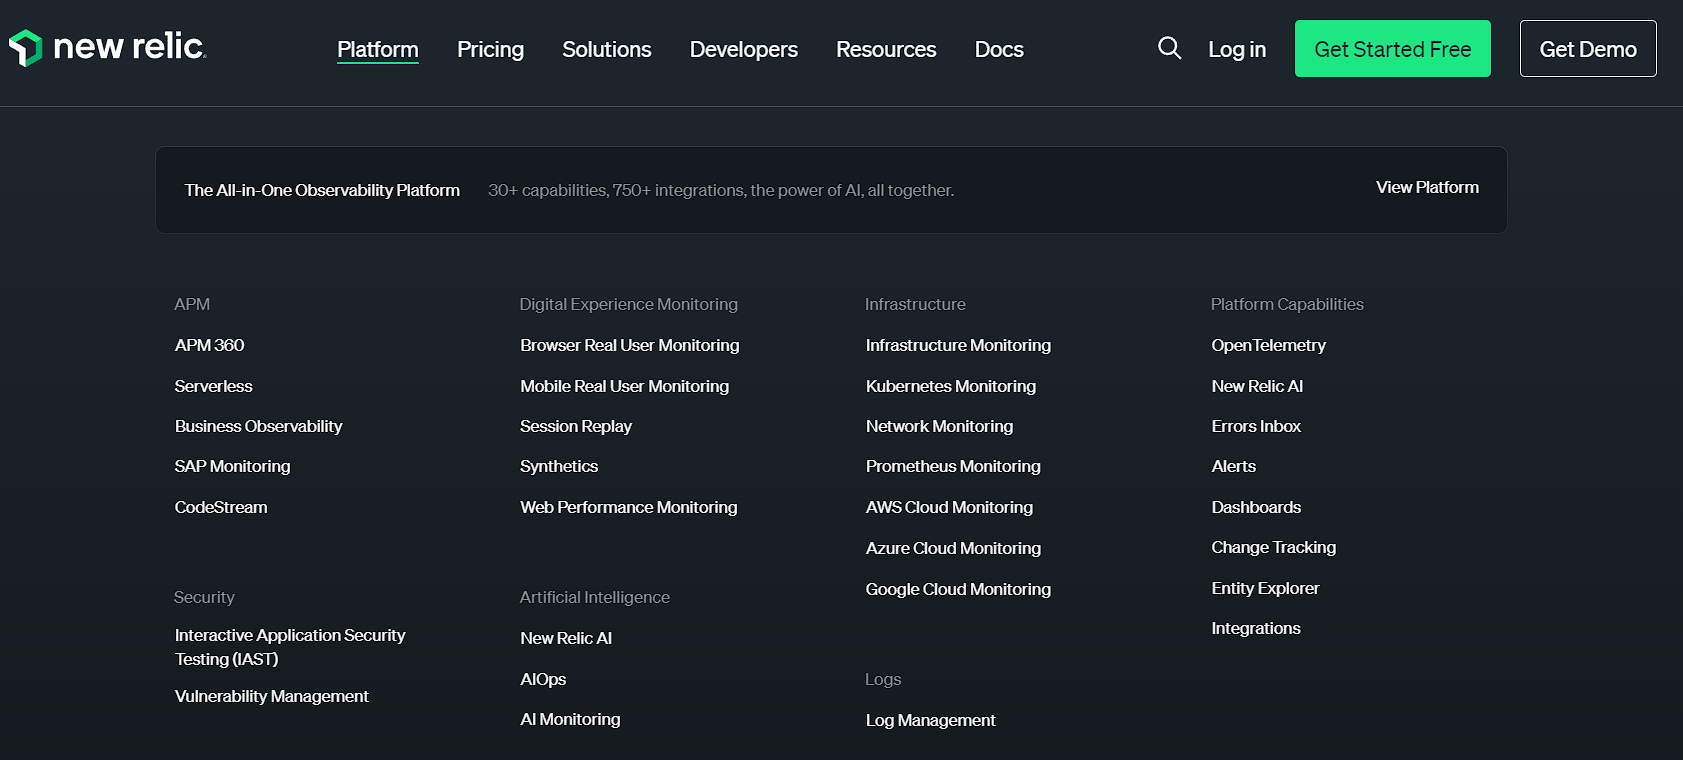
New Relic Key features:
- Full-Stack Observability: New Relic provides end-to-end visibility across your entire stack, including applications, infrastructure, and logs, all in one platform.
- Real-Time Monitoring: It offers real-time monitoring and alerts, allowing you to quickly detect and respond to performance issues as they happen.
- AI-Driven Insights: New Relic uses AI and machine learning to automatically detect anomalies and provide insights, helping you identify and resolve issues faster.
- Custom Dashboards: Users can create highly customizable dashboards with drag-and-drop widgets, offering a personalized view of critical metrics and performance data.
- Distributed Tracing: This feature allows you to trace requests as they flow through services, providing a clear picture of complex microservices architectures.
- Integrations: New Relic supports a wide range of integrations with popular tools and platforms, enabling seamless data flow and enhancing your monitoring capabilities.
What is Prometheus?
Prometheus is an open-source monitoring and alerting toolkit developed by SoundCloud in 2012. It excels at collecting and storing time-series data with timestamps. It features a robust data model and a powerful query language, making it ideal for both machine-centric and dynamic service-oriented monitoring. Prometheus is also simple and scalable.
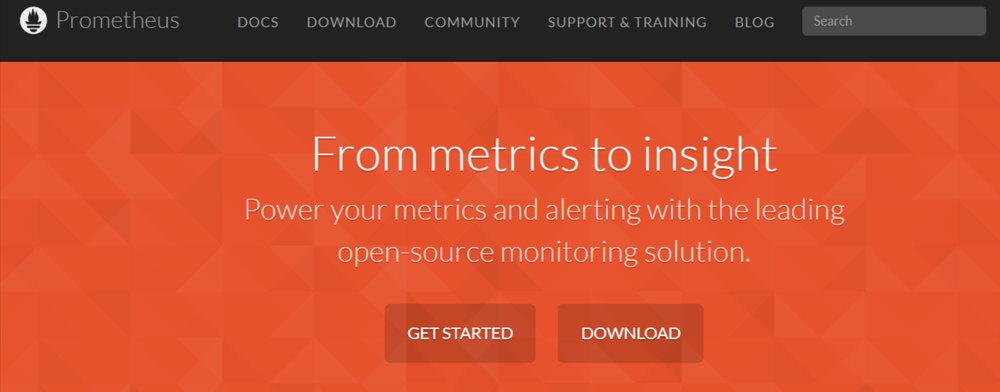
Prometheus Key features:
- Multi-Dimensional Data Model: Prometheus uses a multi-dimensional data model to represent time-series data, identified by metric names and key/value pairs.
- PromQL (Prometheus Query Language): Prometheus offers a powerful and flexible query language.
- Autonomous Single Server Nodes: Prometheus operates on single server nodes that are autonomous and do not rely on distributed storage.
- Pull-Based Data Collection: Time series data is collected using a pull model over HTTP, where Prometheus regularly scrapes targets to gather metrics.
- Push Gateway Support: While primarily using a pull model, Prometheus also supports pushing time-series data via an intermediary gateway.
New Relic vs Prometheus: A Detailed Comparison
Data Collection: New Relic wins
New Relic simplifies data collection by providing data sources that require no additional configuration. It collects data using an agent that instruments your application at the code level, automatically gathering extensive information.
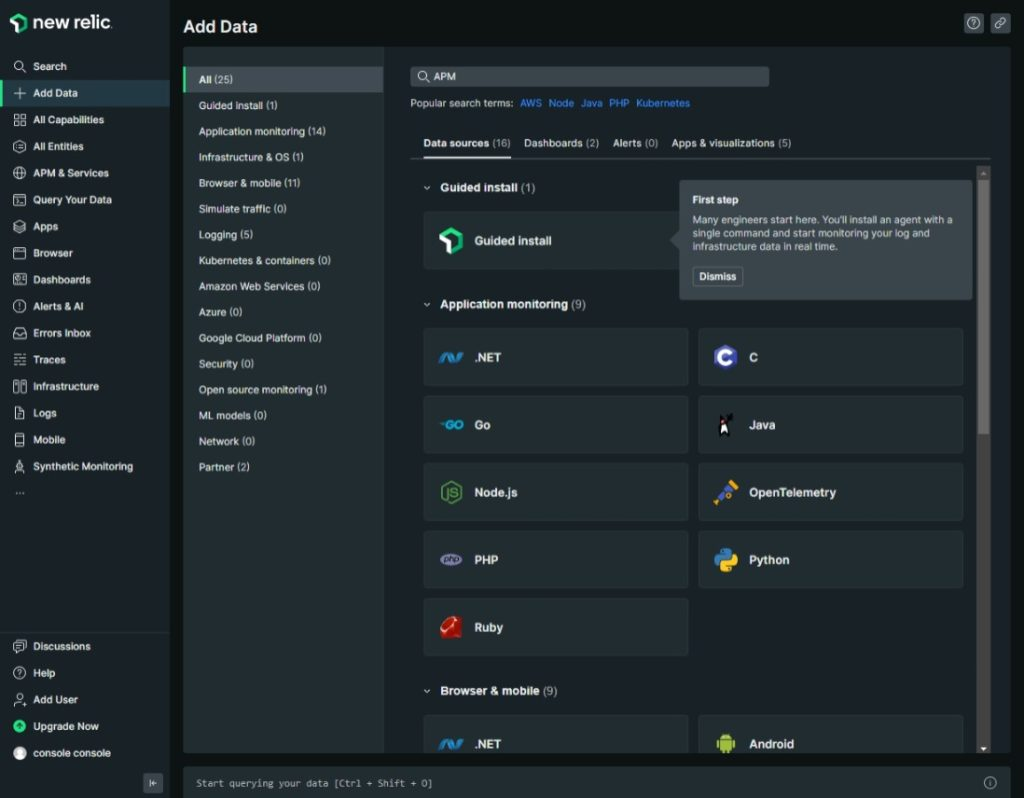
New Relic automatically collects a wide range of data, there might be specific data or metrics that aren't captured by default. In such cases, you may need to manually configure New Relic to bring in that additional data.
New Relic also offers several methods to add custom data sets, ensuring you capture all the relevant metrics. The Table given below gives you a clear picture on the methods offered by New Relic to add custom data.
| Ways to Get More Custom Data | How to Do It |
|---|---|
| Report custom data with agent APIs | Configure New Relic agents (APM, browser, or mobile) to send custom data. |
| Report custom infrastructure data | Use the Flex integration to report any type of infrastructure-related metrics |
| SAP Integration | Use SAP integration for managing business operations. |
| Use open-source telemetry | Integrate with popular open-source telemetry services like OpenTelemetry, Prometheus, Zipkin, StatsD, Grafana, DropWizard, and Micrometer. |
| Add custom attributes/events | New Relic-reported events with custom metadata/ report entirely custom events using the Event API. |
| Send custom trace data | Use the Trace API to send trace data in Zipkin or New Relic format. |
| Send custom log data | Use the Log API to send any arbitrary log data. |
Prometheus uses a pull-based model to collect metrics by scraping targets like applications, services, or infrastructure components that expose a /metrics endpoint. Prometheus sends HTTP GET requests to these endpoints to retrieve metrics in a format it understands.
While some services natively expose Prometheus endpoints, many do not. In such cases, an exporter is used. Exporters collect metrics from these services, convert them into a Prometheus-compatible format, and expose them at their own /metrics endpoint for Prometheus to scrape.
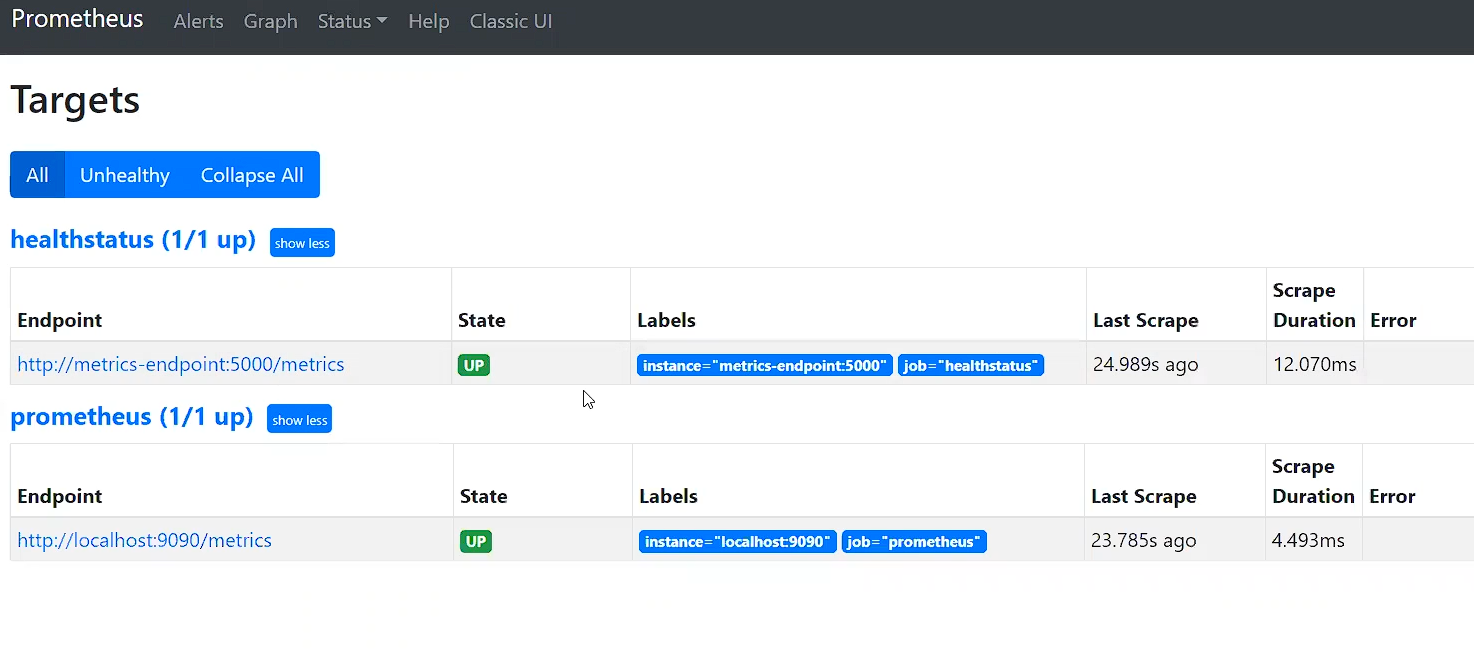
New Relic is better for easy data collection with minimal setup, while Prometheus is best for flexible and wide-ranging integrations.
Data Storage: New Relic wins
New Relic utilizes NRDB (New Relic Database), a scalable, distributed time-series database designed for high-performance data storage and analysis. By default, data retention is set to a minimum of 8 days, with the flexibility to extend this period up to a year for specific data types, such as metrics.
NRDB supports real-time data ingestion, enabling instant access for querying and analysis, and accommodates various data types like metrics, events, logs, and traces. The database’s horizontal scalability ensures consistent performance even as data volumes increase.
Prometheus features a built-in time-series database. This database efficiently stores collected metrics and handles time-stamped data. It maintains a valuable historical record of system performance. This historical data is essential for monitoring, analyzing, and optimizing system behaviour over time.
However, Prometheus does not support long-term data storage on its own. To retain data for extended periods, it needs to be integrated with additional tools or storage solutions.
New Relic is better for data storage with its scalable NRDB that supports long-term retention and real-time analysis, providing a more comprehensive monitoring solution.
Data Query: Tie
In New Relic, you can explore your data using different tools. The UI Query Builder lets you create custom queries using New Relic Query Language (NRQL) to build charts and view data easily.
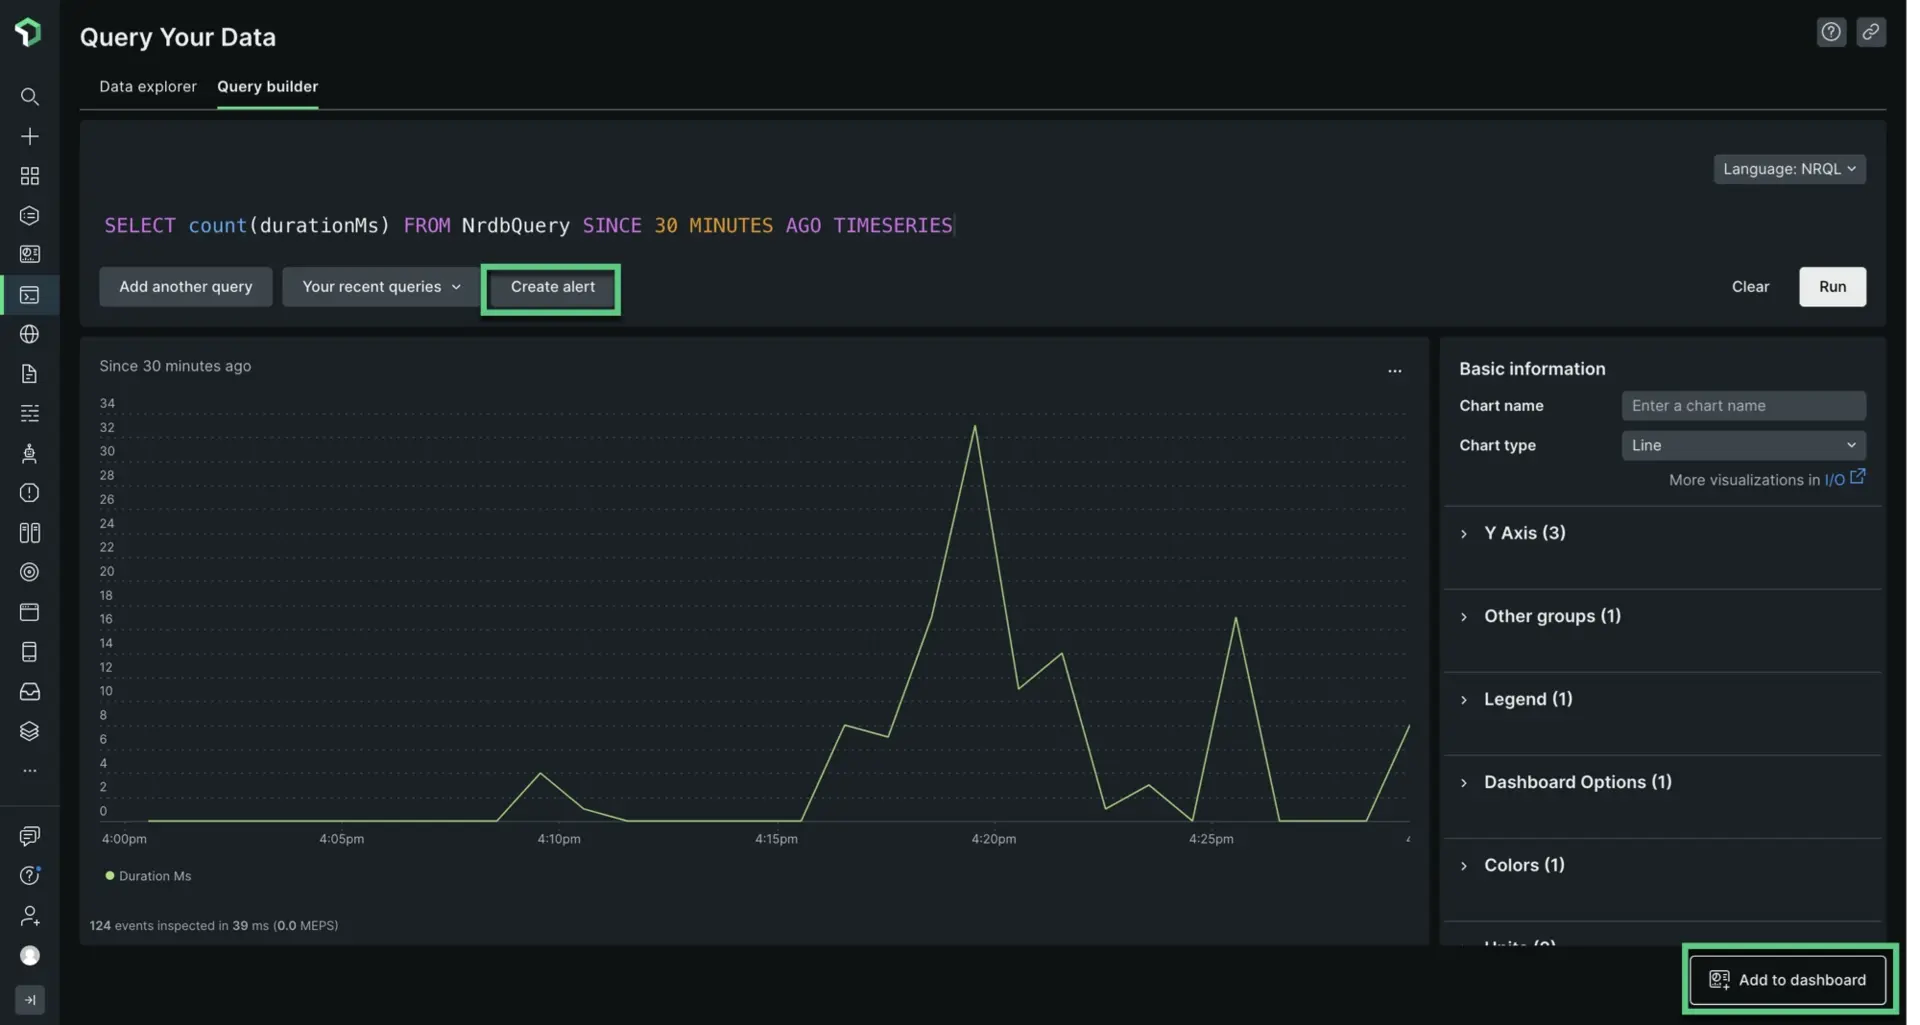
If you need more advanced options, the NerdGraph API offers powerful querying capabilities that go beyond what you can do in the UI. This way, you can choose the best method for accessing and working with your data.
Prometheus offers a powerful query language known as PromQL (Prometheus Query Language), enabling users to select and aggregate time series data in real-time. The results of these expressions can be visualized as graphs, displayed as tabular data in Prometheus's expression browser, or accessed by external systems through the HTTP API.
It's a tie, as both platforms excel in different ways for querying data.
Visualization and Dashboards: New Relic wins
New Relic simplifies data visualization with flexible charts and comprehensive dashboards. While charts focus on specific metrics, dashboards provide a broader view by gathering multiple visualizations in one place.
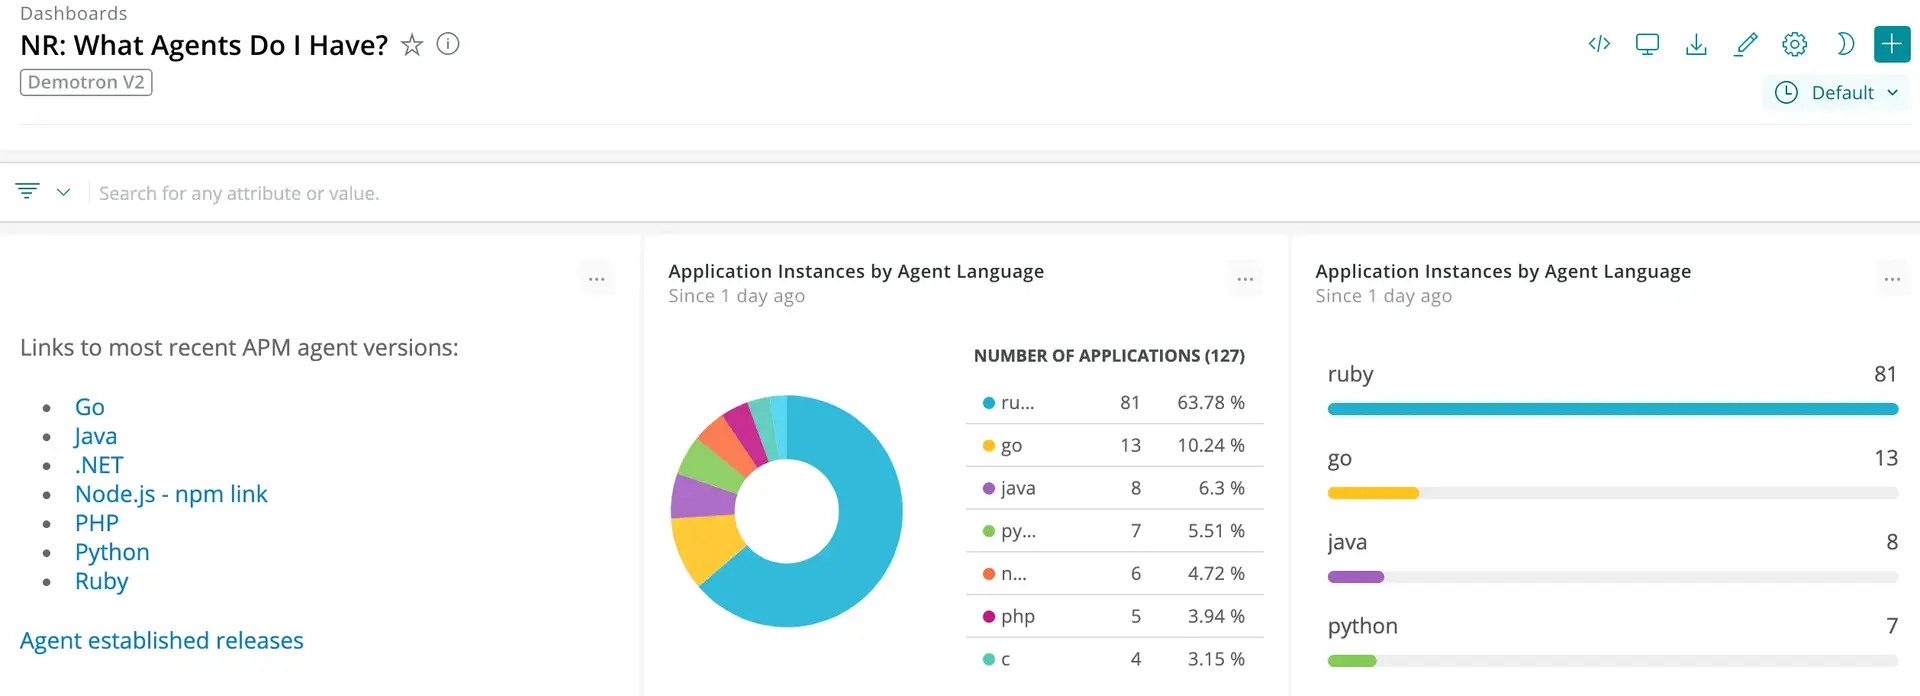
New Relic offers hundreds of pre-built dashboards, making it easy to visualize data quickly without needing to build from scratch. You can access these through tabs like "Datasources," "Dashboards," "Alerts," and "Apps & Visualizations." These pre-built options help you start monitoring your data instantly.
Prometheus features an expression browser, accessible via /graph on the server, where users can input expressions to view results as tables or graphs. It enables basic data visualization but with limited capabilities. The charts and graphs are simple, and the interface is not very user-friendly. This makes it less suitable for users who need more advanced or customized visualizations.
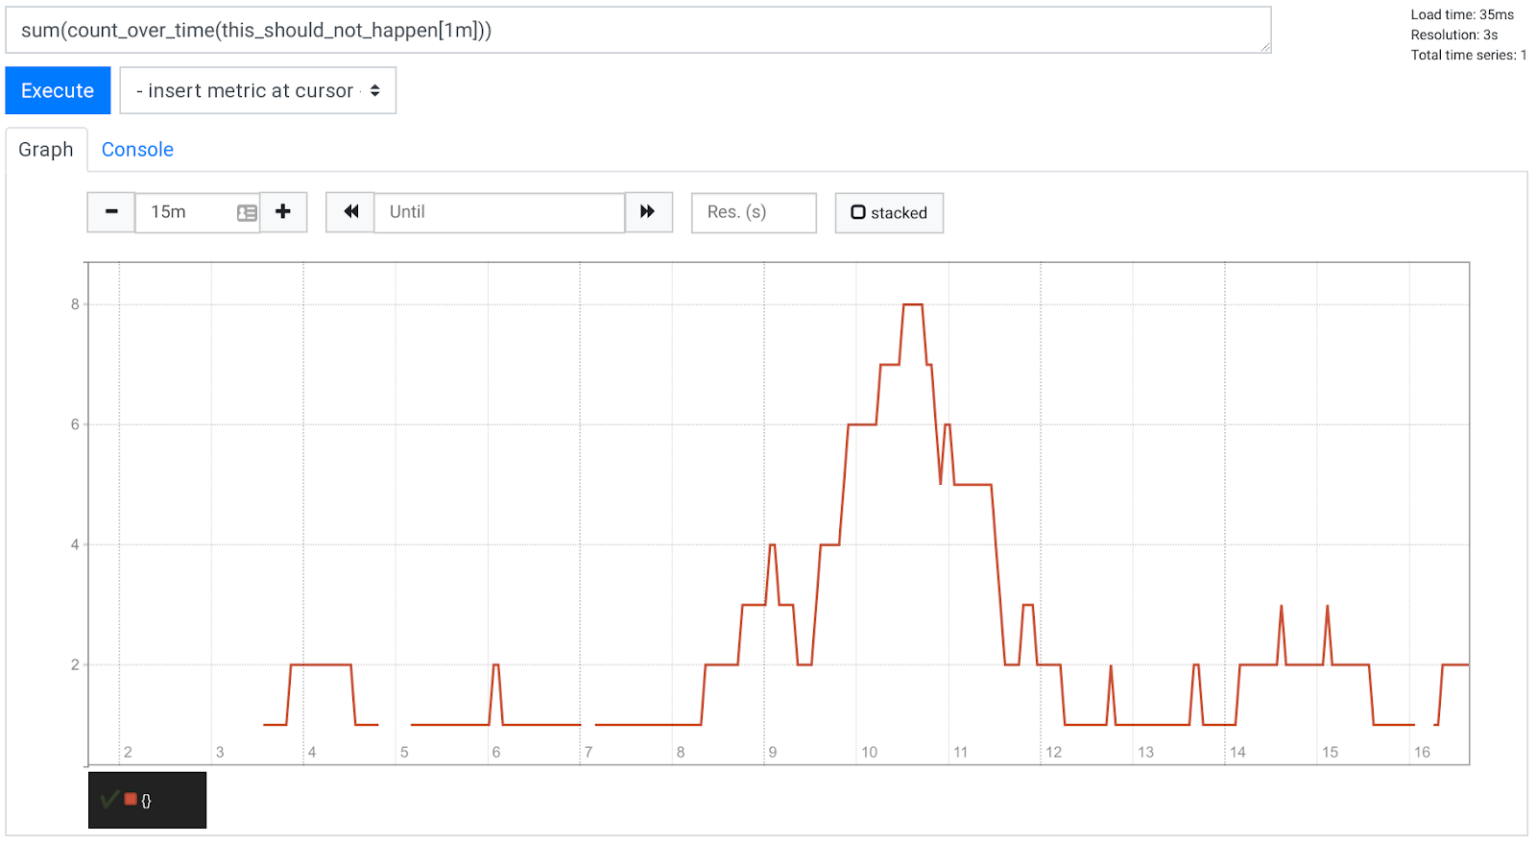
New Relic is the winner for its superior and user-friendly data visualization features.
Alerting and Notifications: New Relic wins
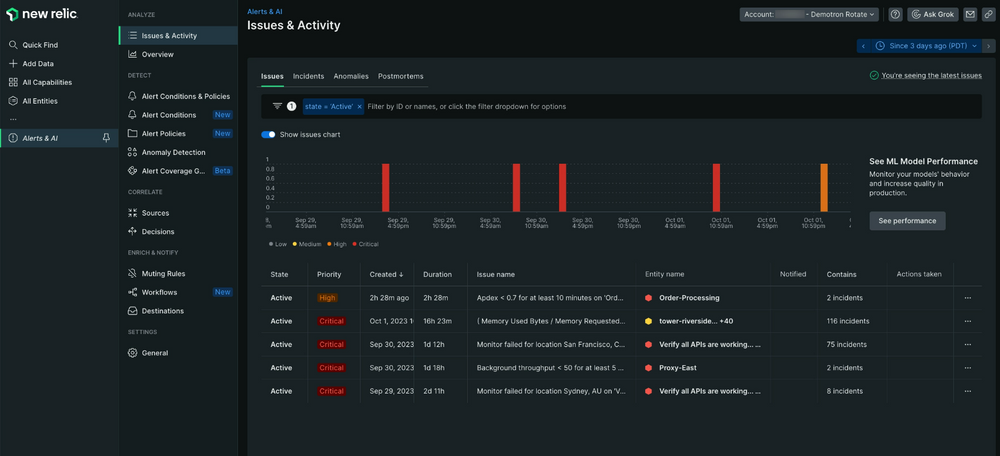
New Relic's AI-powered alerting is definitely a game changer. It not only notifies users of incidents but also identifies the exact issue and its location, which speeds up troubleshooting.
Setting up alerts is simple, with customizable thresholds for response times and error rates. Alerts can be received through various channels, including email, SMS, and Slack, enhancing monitoring efficiency.
Prometheus doesn't handle alert rules directly. Instead, it uses Alertmanager for this purpose. Prometheus servers create alerting rules and send alerts to Alertmanager, which then manages these alerts.
Alertmanager handles tasks like silencing, aggregation, and routing of alerts. It also manages deduplication and ensures alerts are sent to appropriate integrations such as email, PagerDuty, or OpsGenie.
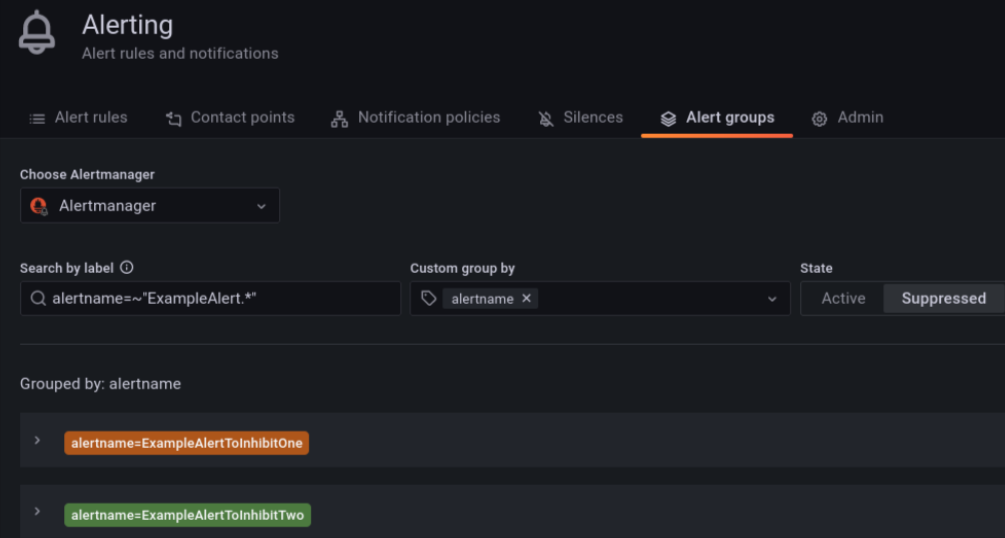
New Relic is the winner for its AI-powered alerting that quickly identifies and locates issues, with easy setup and multiple notification options. Prometheus requires additional setup with Alertmanager for alert management.
UI/UX: New Relic wins
New Relic’s interface is easy to use and straightforward. It comes with pre-configured dashboards and alerts, making it simple to set up and start monitoring. The design is user-friendly and perfect for beginners.
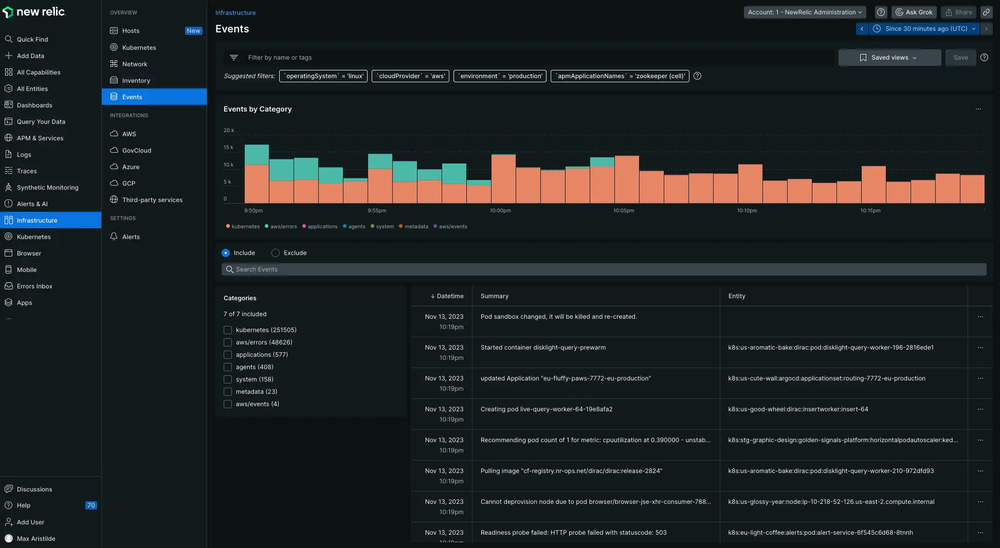
Prometheus provides a more basic UI, with a focus on core monitoring functionalities. The UI focuses on data presentation rather than providing a broad set of visualization options.
Prometheus has a more basic UI focused on core functionalities, with fewer visualization options. New Relic wins for its user-friendly interface, offering pre-configured dashboards and alerts that make setup and monitoring straightforward.
Documentation: New Relic wins
New Relic’s documentation is well-organized and easy to follow, with clear step-by-step guides. Instructions are straightforward, making it simple to execute tasks without extra searching. You can get a full understanding of the tool with minimal effort.
Prometheus documentation is brief and often lacks detail, making it harder to understand some concepts. Information is spread out, and this can make it challenging to execute tasks effectively.
New Relic's documentation is clear and well-structured, making it easy to follow. In contrast, Prometheus documentation often lacks detail and requires navigating through multiple documents.
Pricing Comparison: Prometheus wins
New Relic's pricing is determined by data ingestion and the number of user seats. It features usage-based pricing, starting with 100GB of free data ingestion per month. Beyond this limit, charges apply at $0.30 per GB or $0.50 per GB, depending on your plan. Additionally, the cost of user seats can become quite high.
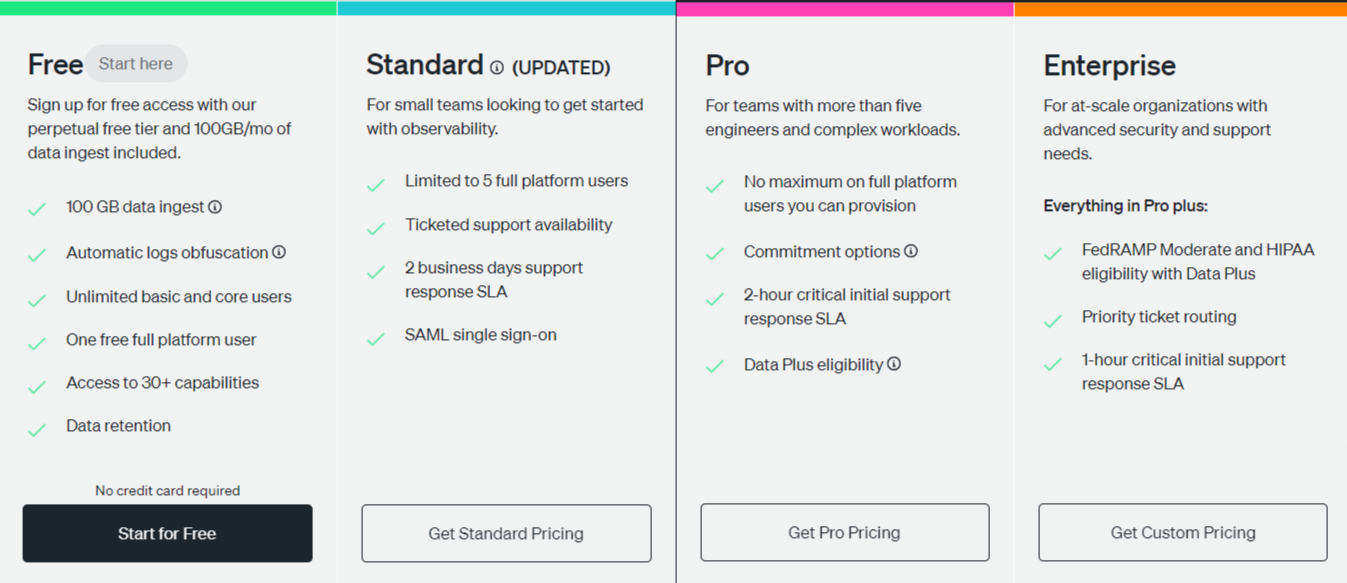
Prometheus itself is free as an open-source tool, but costs may arise from the infrastructure needed to run it.
Prometheus wins for cost-effectiveness as it is free and open-source. New Relic, while offering 100GB of free data ingestion, can become expensive with usage-based pricing.
New Relic vs Prometheus: Final Verdict
When choosing between New Relic and Prometheus, it depends on your specific needs. New Relic is ideal for full-stack observability, real-time monitoring, and AI-driven insights. Prometheus excels in metrics monitoring and is a strong choice for environments where scalability and time-series data collection are the focus.
Choose New Relic if:
- You need comprehensive full-stack observability across applications, infrastructure, and logs.
- Real-time monitoring and AI-driven insights are critical for your operations.
- You prefer a user-friendly interface with detailed, customizable dashboards.
- Your organization values an all-in-one solution with integrated alerting and visualization.
Choose Prometheus if:
- You need scalable and efficient metrics monitoring.
- Open-source flexibility and cost-effectiveness are important to you.
- Your focus is on time-series data collection with powerful querying capabilities.
- You prefer integrating with other tools like Grafana for advanced visualization and dashboarding.
Atatus: A New Relic and Prometheus alternative
Atatus can be an effective alternative to New Relic and Prometheus. New Relic and Prometheus each offer distinct monitoring capabilities but have their own limitations. New Relic can be expensive, while Prometheus requires manual setup and additional tools for visualization. Atatus addresses these limitations by providing,
- Full-Stack Monitoring: Atatus provides comprehensive monitoring for applications, infrastructure, and logs, similar to New Relic, offering full-stack observability in one platform.
- User-Friendly Interface: Atatus features an intuitive and easy-to-use interface, making it accessible for teams without the steep learning curve associated with more complex tools like New Relic and Prometheus.
- Integrated Monitoring: Unlike Prometheus, which focuses on metrics, Atatus offers integrated monitoring for logs, traces, and metrics, reducing the need for multiple tools and simplifying your monitoring stack.
- Cost-Effective Solution: Atatus often comes at a more competitive price point, making it a cost-effective alternative to New Relic, especially for small to mid-sized businesses.
- Simpler Setup: Atatus is easier to set up and manage compared to Prometheus, which requires more manual configuration and integration with other tools for visualization.
- Built-In Custom Dashboards: Atatus provides built-in, customizable dashboards, eliminating the need for additional tools like Grafana that are often required with Prometheus.
- Real-Time Alerts: Similar to New Relic, Atatus offers real-time alerts and AI-driven insights, helping teams quickly detect and resolve issues before they affect users.
Atatus offers Application Performance Monitoring, Real User Monitoring, Serverless Monitoring, Logs Monitoring, Synthetic Monitoring, Uptime Monitoring, and API Analytics. It works perfectly with any application, regardless of framework, and has plugins.
New Relic vs Prometheus vs Atatus
| Feature | New Relic | Prometheus | Atatus |
|---|---|---|---|
| Monitoring Scope | Full-stack monitoring | Metrics-focused | Full-stack monitoring |
| Cost | Often expensive | Free, open-source | Cost-effective |
| Setup | Easy but can be complex | Manual setup, needs extra tools | Simple setup |
| Visualization | Extensive built-in options | Requires Grafana for visuals | Built-in customizable dashboards |
| Alerts | Advanced real-time alerts | Basic alerting | Real-time alerts |
| Ease of Use | User-friendly | Steeper learning curve | Intuitive and easy to use |
New to Atatus? Try it out with a 14-day free trial.
#1 Solution for Logs, Traces & Metrics
APM
Kubernetes
Logs
Synthetics
RUM
Serverless
Security
More



![New Relic vs Splunk - In-depth Comparison [2025]](/blog/content/images/size/w960/2024/10/Datadog-vs-sentry--19-.png)
![New Relic vs Sentry - Which Monitoring Tool to Choose? [2025]](/blog/content/images/size/w960/2024/10/VS--1-.png)