New Relic vs Kibana: A Guide to Choosing the Right Tool in 2025
New Relic and Kibana are popular monitoring and observability tools that provide a wide range of features for analysing and visualizing data. In this post, I have compared New Relic and Kibana based on key aspects such as data ingestion, dashboards and visualizations, log management, alerting, pricing and more. Lets take a look at each tool's capabilities, strengths, and weaknesses to help you understand how they differ and which one is best suited to your needs.
Table of Contents:
- What is New Relic?
- What is Kibana?
- New Relic vs Kibana: Feature Comparison
- Data Sources & Ingestion
- Dashboards & Visualization
- Log Management
- Application Performance Monitoring
- Alerting & Anomaly Detection
- Security & Access Control
- New Relic vs Kibana: The Final Verdict
- Looking for a Simpler and More Effective Alternative? Try Atatus!
What is New Relic?
New Relic is a SaaS-based application performance monitoring (APM) platform that offers a comprehensive observability solution for applications, infrastructure, and logs. It is widely recognized for its real-time APM capabilities, allowing users to monitor application performance efficiently.
In addition to APM, New Relic provides infrastructure monitoring to track servers, containers, and cloud environments, log management for centralized log analysis, and distributed tracing to follow requests across complex systems.
Key Features of New Relic:
- APM (Application Performance Monitoring): Provides deep insights into application performance with real-time metrics, error tracking, and transaction monitoring.
- Infrastructure Monitoring: Monitors servers, containers, and cloud environments (AWS, Azure, GCP) with automated discovery and health analysis.
- Distributed Tracing: Tracks requests across microservices, helping to pinpoint bottlenecks and optimize service performance.
- Real-Time Alerting & AI-Driven Anomaly Detection: Uses machine learning to detect unusual behaviour and automatically trigger alerts for faster issue resolution.
- Log Management: Centralizes logs from multiple sources, integrates with third-party logging tools, and enables powerful search and filtering for troubleshooting.
- Pre-Built Dashboards: Offers ready-to-use dashboards for applications, infrastructure, and logs, providing instant visibility without manual configuration.
What is Kibana?
Kibana is an open-source data visualization tool, primarily used with Elasticsearch to visualize logs and other data stored within Elasticsearch indices. Kibana is often part of the Elastic Stack (formerly known as the ELK Stack), which includes Elasticsearch, Logstash, and Beats. Kibana allows users to explore, visualize, and create custom dashboards from their Elasticsearch data.
Kibana’s primary strength lies in its ability to handle log data, making it a preferred tool for log management and analysis. While it excels in visualizing and exploring logs, it can also be used to visualize other data types, including time-series data and metrics, though its core use is centered around logs and search-based data exploration.
Key Features of Kibana:
- Data Visualization: Provides interactive dashboards, charts, and graphs to analyse and explore data stored in Elasticsearch.
- Log Exploration: Enables powerful log searching, filtering, and analysis within the Elasticsearch environment.
- Kibana Lens: A drag-and-drop interface for quickly building visualizations without complex queries.
- Customizable Dashboards: Allows users to create and share personalized dashboards with real-time data updates.
- Alerting & Notifications: Provides rule-based alerting for Elasticsearch data, integrating with email, Slack, and other notification channels.
New Relic vs Kibana: Feature Comparison
| Feature | New Relic | Kibana |
|---|---|---|
| Application Performance Monitoring (APM) | ✅ | ❌ |
| Infrastructure Monitoring | ✅ | ❌ |
| Log Management | ✅ Built-in | ✅ Requires Elasticsearch |
| Distributed Tracing | ✅ | ❌ |
| Dashboards & Visualizations | ✅ Pre-built & Customizable | ✅ Highly Customizable |
| Machine Learning & Anomaly Detection | ✅ AI-driven Insights | ✅ Limited (Requires Elastic ML) |
| Alerting & Notifications | ✅ Integrated with AI-based Alerts | ✅ Rule-based Alerts |
| Security Monitoring | ✅ Built-in | ✅ Requires Elastic Security |
| Multi-Source Data Support | ✅ Supports Multiple Data Sources | ❌ Limited to Elasticsearch |
| Ease of Setup | ✅ Simple SaaS-based Setup | ❌ Requires Elasticsearch Configuration |
| Pricing | ✅ Paid (Free Tier Available) | ✅ Free & Paid (Requires Elasticsearch) |
1. Data Sources & Ingestion
New Relic allows you to monitor multiple data sources with minimal configuration. It supports APM (Application Performance Monitoring), logs, infrastructure monitoring, mobile apps, and cloud services (AWS, Azure, GCP). The data can be ingested using agents installed in your applications or cloud platforms, making it simple to collect a variety of performance and operational metrics in real-time.
Kibana is specifically designed to visualize data stored in Elasticsearch, so it requires data to be ingested via Logstash, Beats, or other Elasticsearch ingestion methods. Kibana is great for visualizing log data but can also handle other data types, though it supports fewer data sources compared to New Relic.
New Relic excels in providing flexible data ingestion from various sources with minimal setup, while Kibana is better suited for Elasticsearch-based environments.
2. Dashboards & Visualization
New Relic comes with pre-built dashboards for common monitoring needs (APM, logs, infrastructure), making it ideal for users who want quick insights.
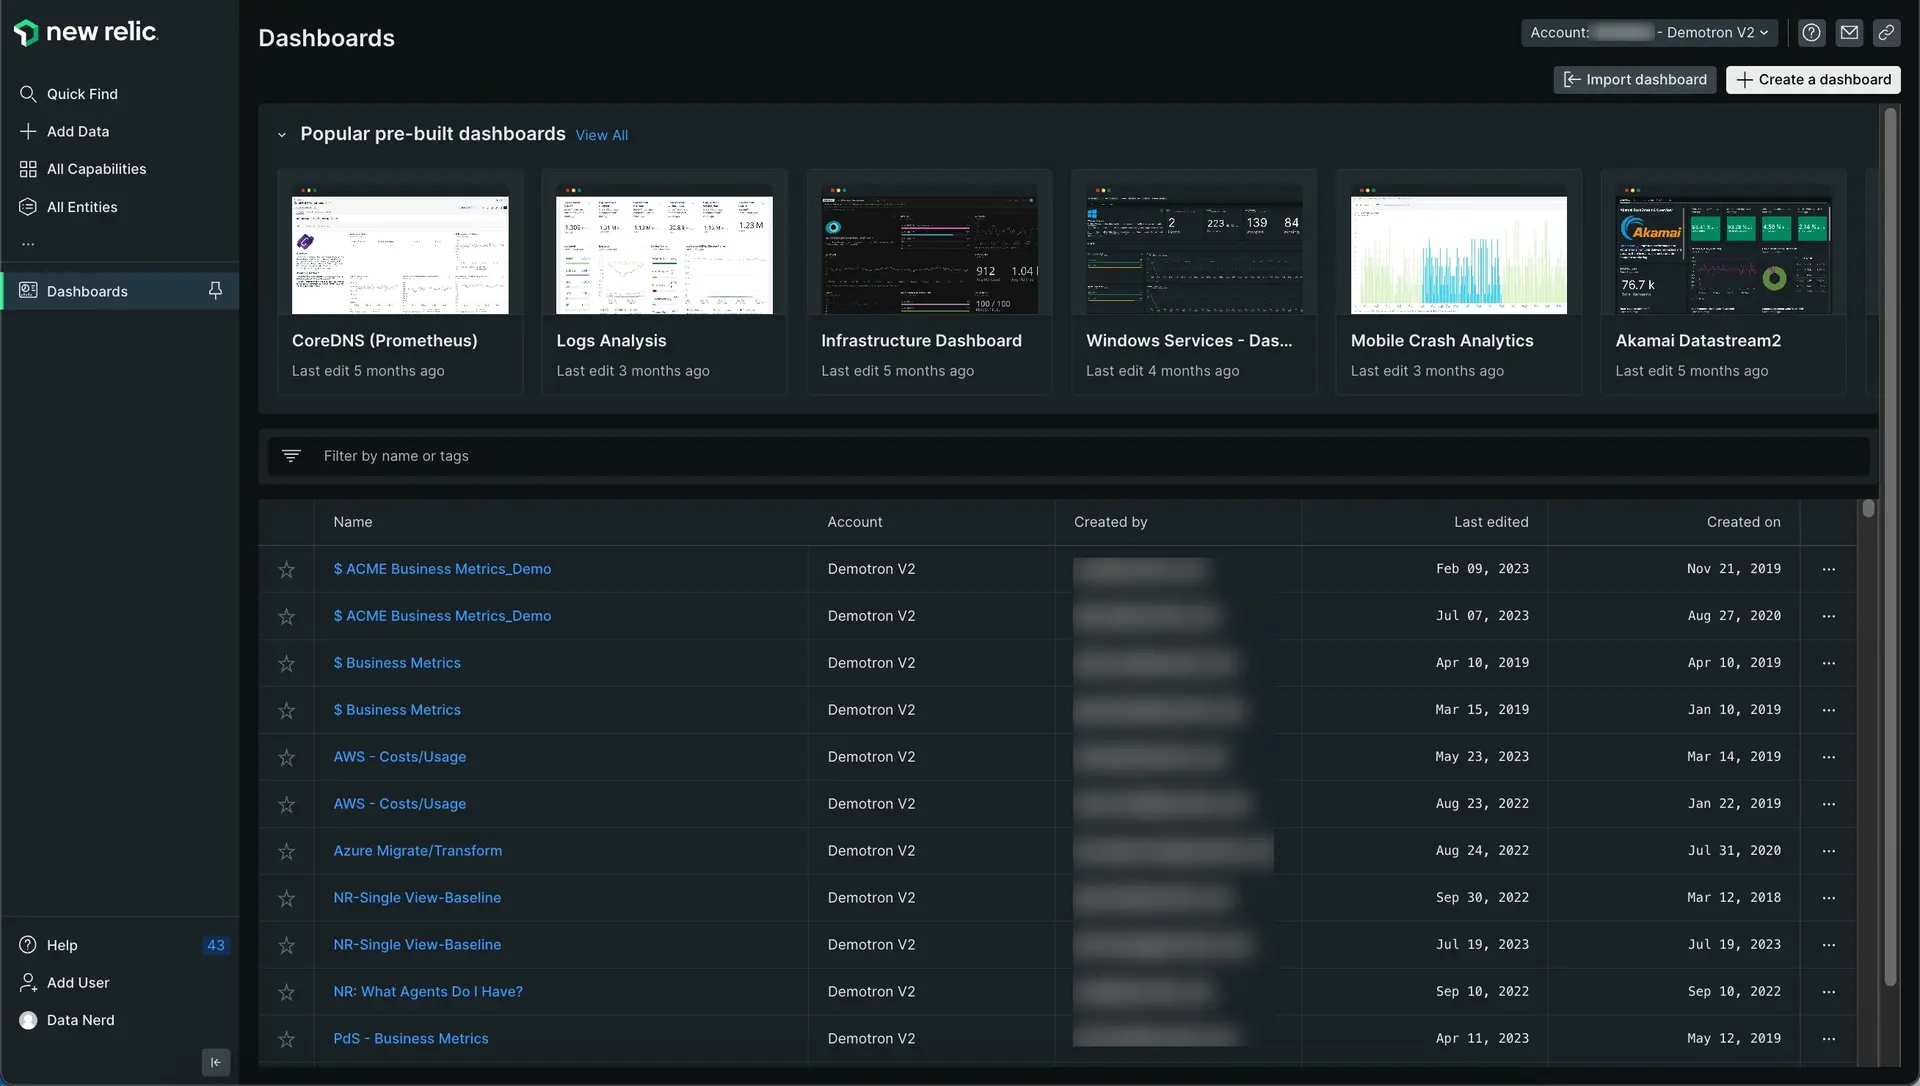
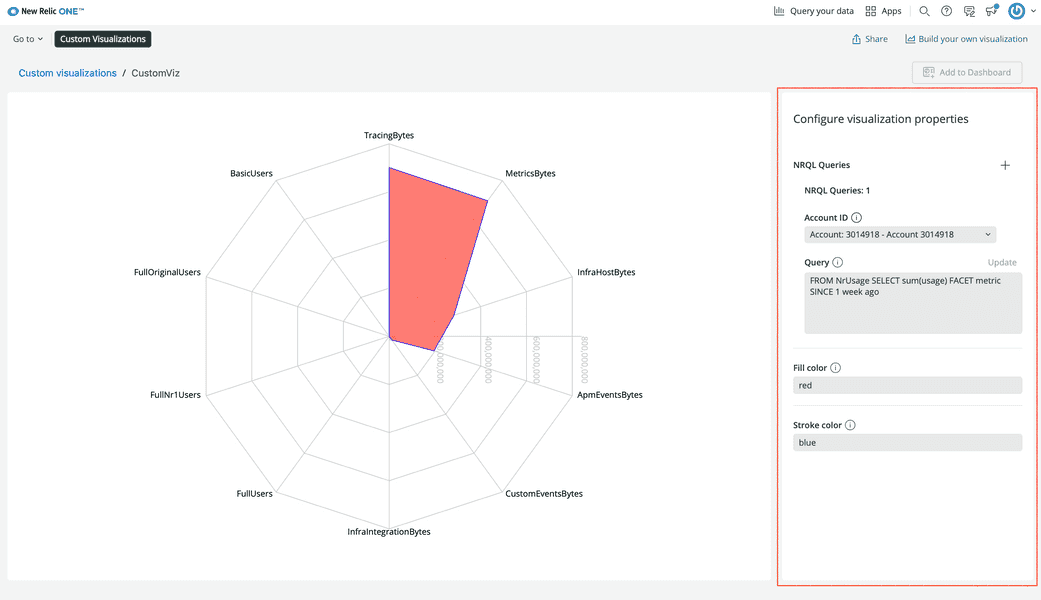
Users can also customize dashboards to highlight the most relevant metrics. For more advanced needs, the New Relic One SDK allows the creation of custom visualizations beyond the default charts.
Kibana provides a highly customizable dashboard experience, allowing users to design dashboards from scratch. Dashboards in Kibana let you rapidly create views that pull together charts, maps, and filters to display the full picture of your Elasticsearch data.
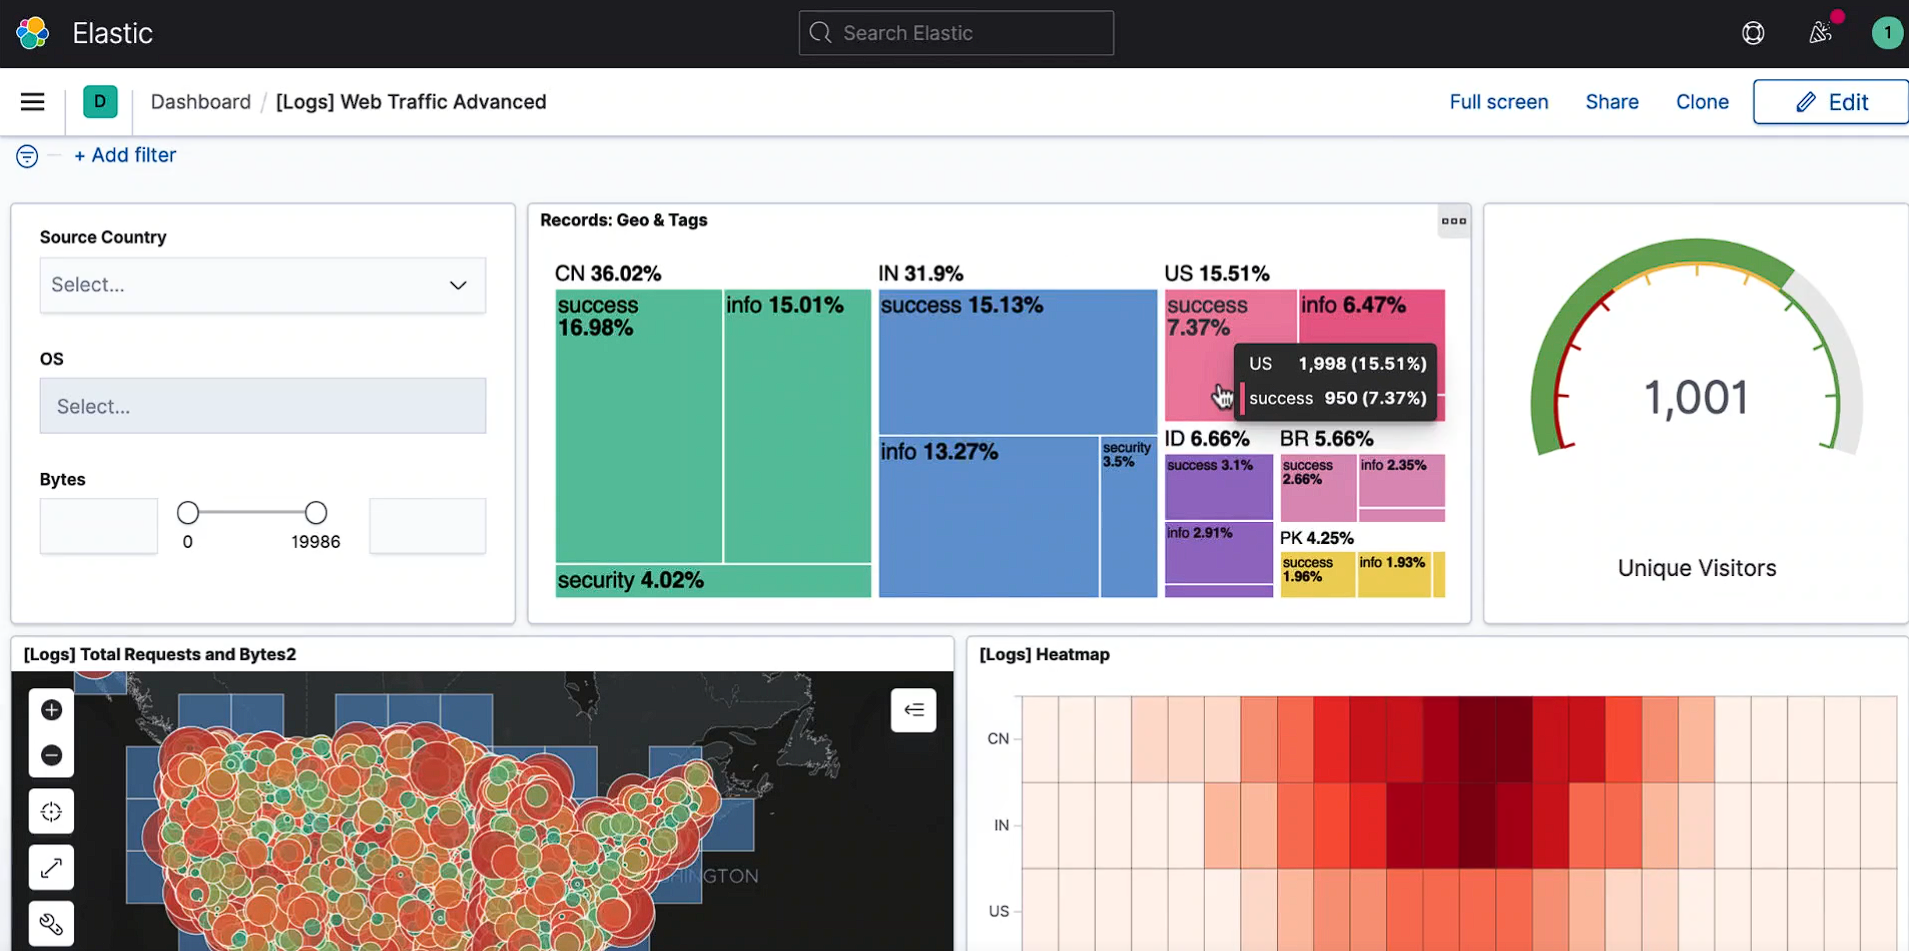
Kibana dashboards offer easy-to-use drilldown features that let users explore data in greater detail. You can start with a high-level overview and drill down to detailed document-level insights.
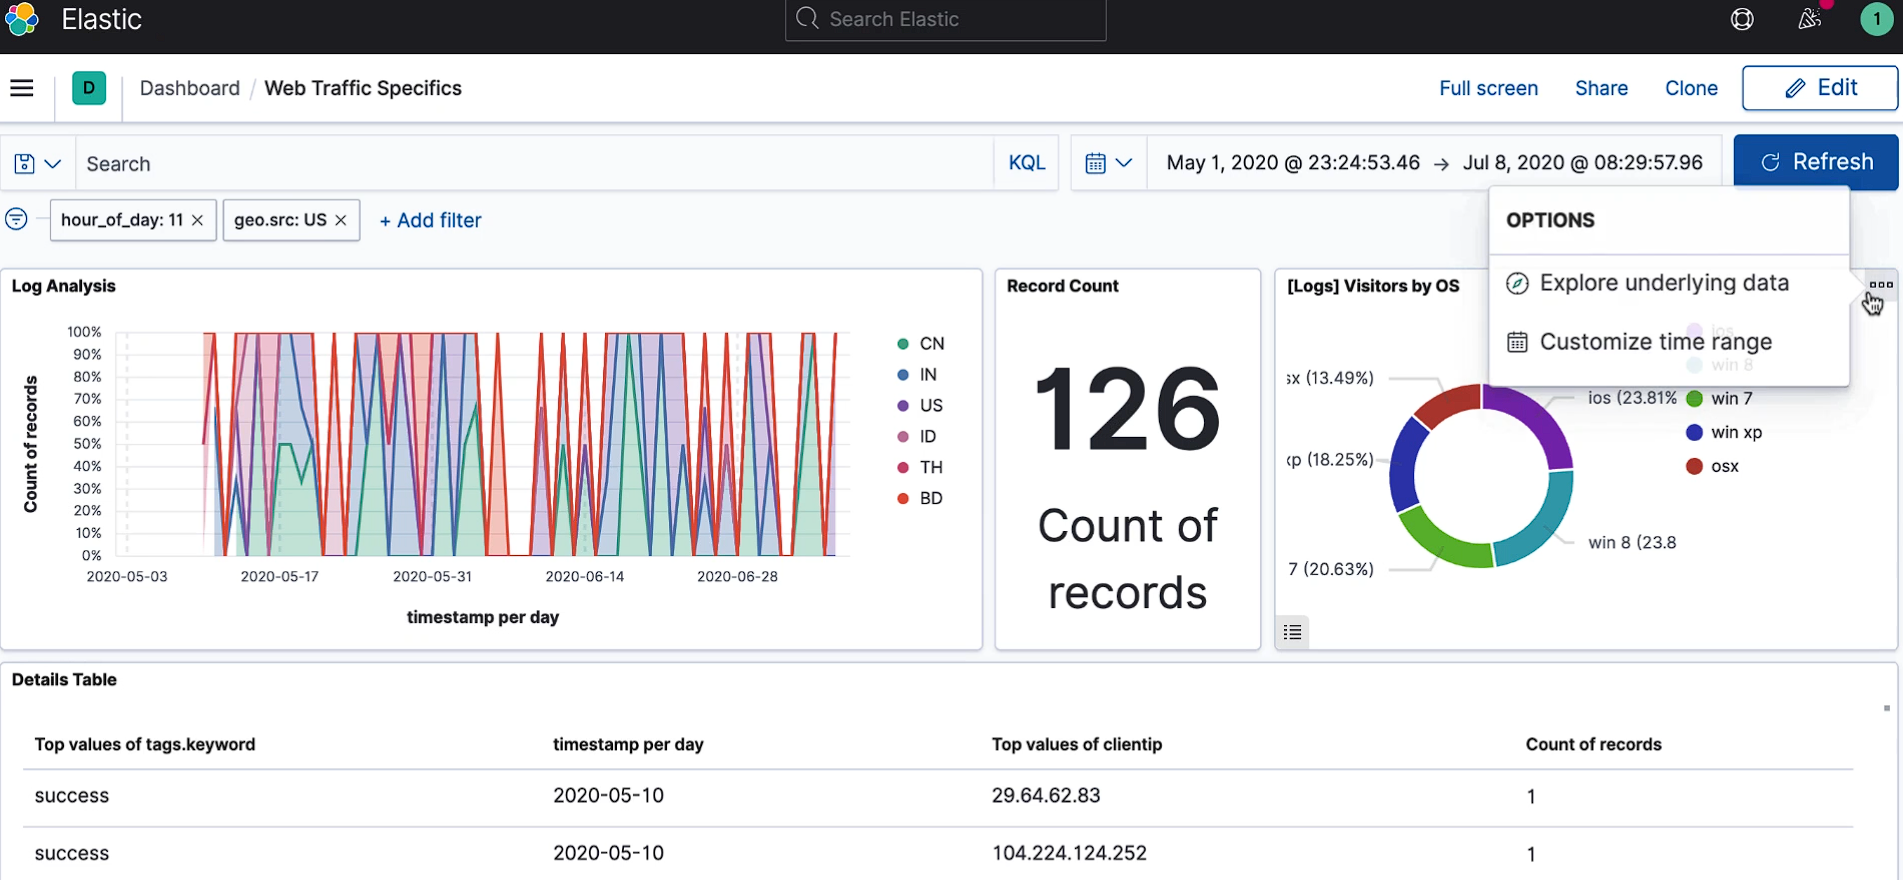
You can create custom visualizations and fine-tune the layout, which is perfect for teams with specialized data needs. However, it does require a deeper understanding of the data and querying to create meaningful visualizations.
Kibana offers more control over dashboard creation and visualizations, but New Relic’s pre-built dashboards make it a quicker solution for those who need fast insights.
3. Log Management
New Relic Logs automatically collects application and infrastructure logs, displaying them in a unified logs tab without requiring additional setup. Logs can be forwarded using APM agents, infrastructure agents, third-party services, the Log API, TCP endpoint, or the OpenTelemetry SDK, ensuring seamless integration.
This comprehensive approach provides deep visibility into performance data, including events, errors, and traces, making it easier to detect patterns and troubleshoot issues. With an intuitive logs UI, users can quickly analyze log details, reducing mean time to resolution (MTTR) and improving overall system reliability.
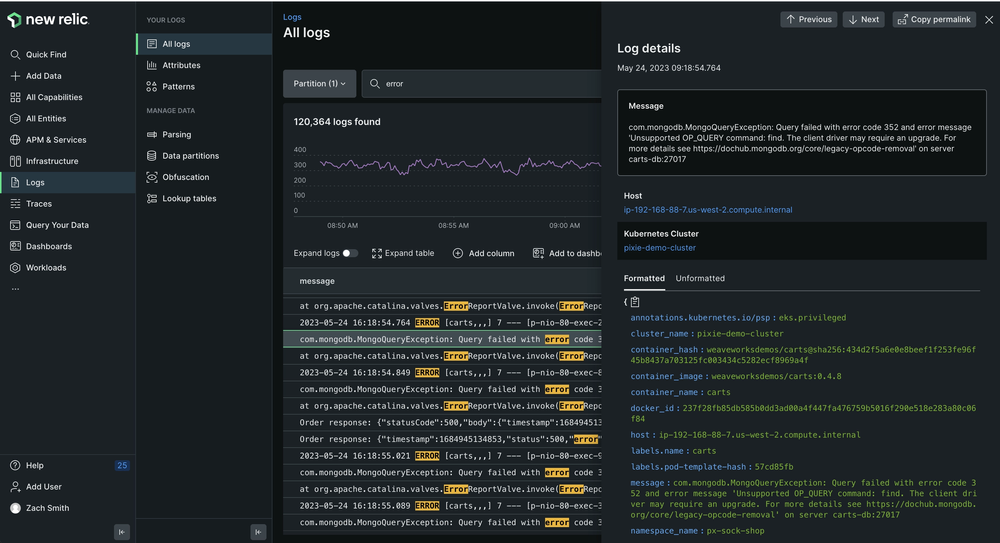
Kibana is best known for its log management capabilities, especially when paired with Elasticsearch. Logs need to be manually ingested using Logstash or Beats, which adds an extra layer of setup.
Kibana provides powerful search and filter functionalities for log analysis but lacks the automatic log correlation and AI-based anomaly detection that New Relic offers.
New Relic provides automatic log ingestion and correlation, while Kibana is more manual in nature, requiring additional setup.
4. Application Performance Monitoring (APM)
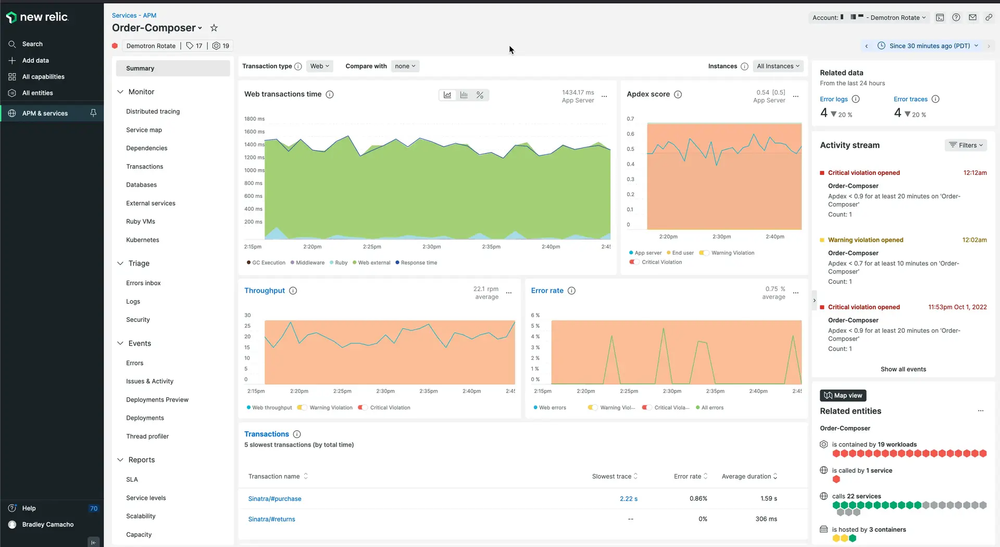
New Relic offers built-in APM features, which allow for real-time monitoring of application performance. You can trace transactions across microservices, monitor application health, and identify slow transactions or errors instantly.
It supports a wide range of languages and delivers flexible, customizable insights through its user-friendly interface.
Kibana does not include APM features out-of-the-box but can integrate with Elastic APM to provide application performance monitoring. However, this requires additional setup, and Kibana’s APM capabilities are not as comprehensive as New Relic’s.
New Relic provides out-of-the-box APM with minimal setup, while Kibana requires integration with Elastic APM for similar functionality.
5. Alerting & Anomaly Detection
New Relic features AI-powered anomaly detection, which automatically identifies abnormal behaviour in application performance, infrastructure, and logs. It also offers dynamic thresholds and advanced alerting capabilities.
Kibana has basic alerting capabilities through Elasticsearch Watcher (available in the paid version). Alerts are rule-based, requiring manual setup and configuration, and do not have AI-driven anomaly detection.
New Relic offers AI-powered alerting and anomaly detection, whereas Kibana's alerting is manual and less advanced.
6. Security & Access Control
New Relic has built-in role-based access control (RBAC), which allows administrators to assign different permissions to users based on their roles. It also supports SSO (Single Sign-On) and provides enterprise-grade security features.
Kibana also supports RBAC but this is only available in the paid versions. Basic authentication and access control are available in the free versions, but they are limited compared to New Relic’s enterprise security features.
New Relic offers more robust security features out-of-the-box, while Kibana requires a paid version for advanced security.
New Relic vs Kibana: The Final Verdict
Both New Relic and Kibana are excellent tools, but they serve different purposes and excel in different areas:
Choose New Relic if:
- You need a full-stack observability platform with built-in monitoring capabilities.
- You require real-time APM, infrastructure monitoring, log management, and AI-driven insights.
- You want a comprehensive solution with minimal setup and an intuitive user experience.
- You work with multiple data sources and need seamless integration for performance monitoring.
Choose Kibana if:
- You are working within an Elasticsearch environment and need a log visualization tool.
- You require highly customizable dashboards tailored to your log and metric data.
- You have experience with Elasticsearch and need advanced log management capabilities.
- You prefer a self-managed setup with greater control over data exploration and visualization.
Both tools are powerful in their own way, so your decision should depend on your specific monitoring needs, the scale of your system, and the type of data you need to visualize.
Looking for a Simpler and More Effective Alternative? Try Atatus!
While New Relic offers a comprehensive observability platform and Kibana excels in log visualization within the Elasticsearch ecosystem, both tools come with complexities and costs that may not suit every business.
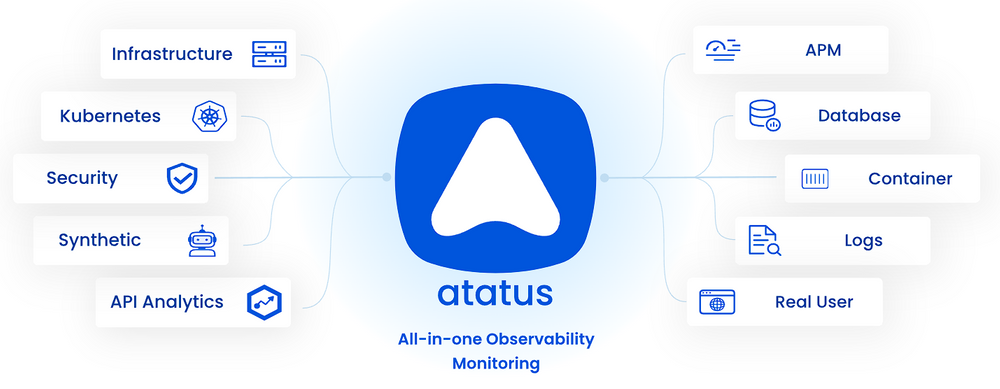
With Atatus, you get a one-stop observability platform that combines the best of monitoring, logging, and visualization without the steep learning curve or high costs of New Relic and Kibana.
Atatus unified platform includes Application Performance Monitoring, Infrastructure Monitoring, Database Monitoring, Logs Monitoring, and more.
Atatus Key Features includes:
- Full-Stack Monitoring – Gain insights into application performance, logs, and infrastructure in real time.
- Log Management Without Complexity – Easily collect, search, and analyse logs without the need for Elasticsearch.
- Affordable & Transparent Pricing – Get all essential monitoring features without hidden costs.
- User-Friendly Dashboards – Customizable reports with an intuitive interface for seamless monitoring.
- Seamless Setup & Integration – Start monitoring with minimal configuration and easy-to-use integrations.
#1 Solution for Logs, Traces & Metrics
![]() APM
APM
![]() Kubernetes
Kubernetes
![]() Logs
Logs
![]() Synthetics
Synthetics
![]() RUM
RUM
![]() Serverless
Serverless
![]() Security
Security
![]() More
More


![New Relic vs Splunk - In-depth Comparison [2025]](/blog/content/images/size/w960/2024/10/Datadog-vs-sentry--19-.png)
![New Relic vs Sentry - Which Monitoring Tool to Choose? [2025]](/blog/content/images/size/w960/2024/10/VS--1-.png)