Monitoring AWS Lambda Node.js Functions with OpenTelemetry
When deploying a Node.js function in the cloud, you might initially think of traditional methods involving web servers and other infrastructure. However, if your application suddenly faces a surge in traffic—thousands or even millions of requests—it could crash if it's unable to handle the load. This is where AWS Lambda shines.
AWS Lambda allows developers to run code without provisioning or managing servers. With Lambda, the infrastructure requirements such as web servers, scaling, and load balancing are managed for you. You only need to focus on writing your application code. Lambda automatically scales your application by running code in response to each trigger, handling requests efficiently regardless of volume.
While Lambda improves efficiency in deploying and maintaining applications on the cloud, it is not without faults. Monitoring AWS Lambda functions is essential for ensuring they perform well, remain reliable, and operate cost-effectively. It helps detect cold starts, which are common in Node.js applications, and allows you to optimize your code to reduce their impact.
In this guide, we will integrate OpenTelemetry into a simple Node.js application and deploy it on AWS Lambda.
This setup ensures that your serverless application can handle high traffic volumes while maintaining high performance and reliability.
Table Of Contents:
- What is AWS Lambda?
- Why is Monitoring Lambda Important?
- What is Serverless Monitoring?
- Challenges in Serverless Monitoring
- How to create a Lambda Function in Node.js Application?
- Writing and Deploying a Serverless Node.js Application
- Deploying and Testing Your Serverless Node.js Application in AWS
- Monitor Traces with Atatus
- To Remove the AWS Lambda Function
- Wrapping Up
What is AWS Lambda?
Amazon Lambda is a key component of the Amazon Web Services (AWS) cloud ecosystem. Lambda enables you to write and execute code without the need to manage the underlying infrastructure typically required for deployment and testing. Lambda functions run in dynamically provisioned containers managed by AWS, which automatically scale up or down based on incoming traffic, ensuring efficient resource utilization.
AWS Lambda simplifies the development process by handling server, platform, and virtual machine management, allowing you to focus solely on your code. This ease of deployment means you can write, configure, and execute a Lambda function within minutes. A significant advantage of Lambda is its cost efficiency: you are billed only for the time your code is actively running, making it a cost-effective solution for various workloads.
Why is Monitoring Lambda important?
Monitoring is essential when dealing with AWS Lambda functions for several reasons. In serverless applications, observability is particularly challenging due to the ephemeral nature of Lambda functions. Lambda provides ephemeral storage in the /tmp directory, which is unique to each execution environment and erased after the function execution ends. And thus if you want to keep track of your application's historical records, you will need a monitoring solution that manages all your application data.
What to Monitor?
- Performance Metrics: Memory consumption, function startup time, and execution duration.
- Scalability Metrics: Concurrency and invocation count.
- Business Metrics: User interactions, such as page visits and button clicks.
It's important to note that because AWS Lambda handles infrastructure management, typical system metrics like CPU usage aren’t available. However, Lambda provides a range of useful metrics out of the box via Amazon CloudWatch and supports custom metrics through your application code.
Lambda automatically captures logs for all requests when you create a new function (and not if you have disabled AWSLambdaBasicExecutionRole permission in the IAM Role) and sends all this data to Cloudwatch Logs.
Lambda sends all the logs it captures to a default /aws/lambda/<function name> log group. You can configure it to send these logs elsewhere by changing the CLI code or Lambda API. Refer to AWS docs for more information on this. You can view these logs in the Lambda console or CloudWatch.
What is Serverless Monitoring?
While reading on AWS Lambda, you must have come across that it is a serverless system.
What exactly is Serverless?
In the past, hosting an application required managing all the necessary infrastructure, including servers. However, advancements in technology now allow us to host applications without maintaining any physical infrastructure. By eliminating servers from your infrastructure stack, you adopt a serverless approach.
When we switch to a serverless architecture, it simplifies application deployment, reduces operational overhead, improves scalability, and enhances cost efficiency.
Coming back to monitoring, serverless monitoring fills in visibility gaps by enabling you to monitor the functions you run, the containers they are in, the applications, and the serverless environment as a whole and in turn gives you an overall
Challenges in Serverless Monitoring:
While serverless as an architecture is a great option, it isn't exactly easy to monitor it. Well, one of the reasons being its location on a cloud where typically thousands of people are also hosting their own applications. But we will look into more specific problems here:
- Cold Starts: Delays caused by initializing functions that haven't been recently invoked.
- Memory Usage: Monitoring to ensure functions do not exceed allocated memory.
- Concurrency Limitation: Managing the maximum number of concurrent executions.
- Resource Availability Limitation: Ensuring sufficient resources are available for function execution.
How to create a Lambda Function in Node.js Application?
We will now look at how to implement monitoring of our lambda functions. For this we first need to have working knowledge of AWS, specifically Lambda. Next we need to create a simple node.js application which we will add to lambda console. Then we will instrument OTel to collect metrics from it.
Prerequisites:
- AWS account
- Node.js Application
- Serverless framework
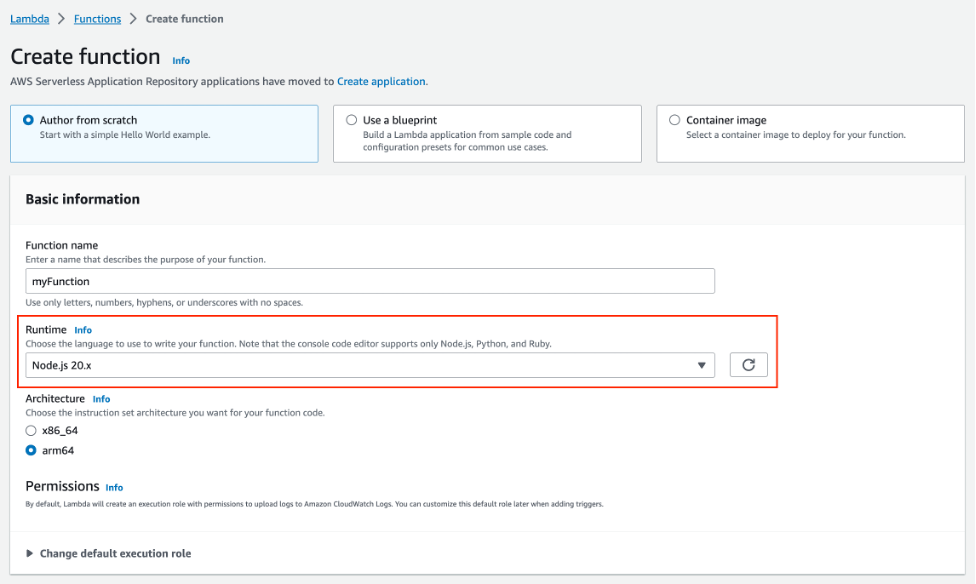
First and foremost, log in to your AWS account and navigate to the Lambda console. Create a basic function and configure it to use Node.js as the runtime language.
Writing and Deploying a Serverless Node.js Application
Once you've set up your AWS Lambda function, you can write your Node.js code in the Lambda function's inline editor or locally in your development environment using the Serverless Framework.
First let's create a sample Node.js application.
Sample Node.js Code for Lambda
We have taken a simple application from the following GitHub Repository:
git clone https://github.com/serverless/examples.git serverless
A typical Lambda function in Node.js exports a handler function. This function will be invoked by AWS Lambda when an event occurs. We will name this function as handler.js
Now don't confuse this "handler" file with the handler field in AWS Lambda. handler.js is simply a file name we chose for this app and it is not to define the Lambda handler function.
'use strict';

module.exports.hello = async (event) => {
  return {
    statusCode: 200,
    body: JSON.stringify(
      {
        message: 'Go Serverless v2.0! Your function executed successfully!',
        input: event,
      },
      null,
      2
    ),
  };
};
When you run this application in your terminal, you will get the following output:
serverless offline
Running "serverless" from node_modules

Starting Offline at stage dev (ap-south-1)

Offline [http for lambda] listening on http://localhost:3002
Function names exposed for local invocation by aws-sdk:
           * hello: node-aws-lambda-crud-dev-hello

   ┌─────────────────────────────────────────────────────────────────────────┐
   │                                                                         │
   │   GET | http://localhost:3000/                                          │
   │   POST | http://localhost:3000/2015-03-31/functions/hello/invocations   │
   │                                                                         │
   └─────────────────────────────────────────────────────────────────────────┘

Server ready: http://localhost:3000 🚀
Now this code seems pretty simple, but it is not so simple when you are implementing actual applications. The process is still the same, however steps become more complex.
Developing Production-Grade AWS Lambda Applications with the Serverless Framework
When working with production-grade applications in AWS Lambda, it's impractical to include all your code directly within the Lambda console's inline editor. This is where the Serverless Framework comes into play, enabling you to manage your code more efficiently and use your preferred development tools.
Why Use the Serverless Framework?
The Serverless Framework simplifies the process of deploying and managing serverless applications. It supports multiple cloud providers such as AWS, GCP, and Azure. With the Serverless Framework, you can define your infrastructure as code in a YAML file, making it easier to maintain and version control your serverless applications.
Key Advantages:
- Ease of Development: Write and manage your code in your favorite IDE.
- Infrastructure as Code: Define your cloud resources in a YAML file.
- Multi-Provider Support: Deploy applications across AWS, GCP, and other cloud providers.
- Simplified Deployment: Deploy your entire application with a single command.
Setting Up a Serverless Node.js Application with Environment Variables
To create an application using the Serverless Framework, you typically need to modify your existing Node.js application to work without a traditional server. You can achieve this using the serverless-http package and dotenv for environment variables. Let's learn how to get it done.
Prerequisites
- Node.js v18
- Serverless Framework
Step 1: Install Serverless Framework and Plugins
First, you need to install the Serverless Framework globally and the serverless-offline plugin for local testing.
npm install -g serverless
npm install serverless-offline --save-dev
Add the serverless-offline plugin to your serverless.yml configuration:
plugins:
  - serverless-offline
Step 2: Modify Your Application
Rename index.js to app.js
AWS Lambda expects a specific handler file. Rename your main file (usually index.js) to app.js.
Install serverless-http
This package is needed to convert your Express application to work with AWS Lambda.
You can certainly create a Node.js function without using an Express app. But since it is one of the most widely used web framework for Node.js and also because it works as an exceptional middleware, we are taking the help of Express here.
npm install serverless-http --save
Modify Your Application Code
Update your app.js to use serverless-http and handle Lambda events:
const express = require('express');
const serverless = require('serverless-http');
require('dotenv').config();

const app = express();
const port = process.env.PORT || 3000;

// Your Express routes here
app.get('/app', (req, res) => {
  res.json({ message: 'Go Serverless v2.0! Your function executed successfully!' });
});

// Other routes...
// app.get('/tasks', ...);
// app.post('/tasks', ...);

module.exports.handler = serverless(app);

// Uncomment the line below if you want to test locally using node app.js
// app.listen(port, () => console.log(`Server running on port ${port}`));
In this setup, the serverless-http package is used to wrap the Express app, enabling it to run in a serverless environment. The dotenv package can be included to manage environment variables conveniently. However, if you are not using any environment variables, installing the dotenv package is not necessary.
Step 3: Set Environment Variables
If you are using environment variables, follow this process to add them to your function code:
i.) Install dotenv
The dotenv package manages all the environment variables and stores them in a single place. Install it using npm:
npm install dotenv
ii.) Create a .env File
Create a .env file in the root directory of your project and add all the environment variables of your choice. For example, we are assigning a database URL and a specific PORT here:
PORT=3000
DATABASE_URL=your_database_url_here
iii.) Require dotenv at the Top of Your app.js
Ensure that dotenv is required at the very top of your app.js file to load the environment variables, like this example below:
require('dotenv').config();
const express = require('express');
const serverless = require('serverless-http');
Step 4: Deploy the serverless.yaml File
Update your serverless.yml with your function and environment configuration, and deploy your application:
serverless.yml Example:
service: node-aws-lambda-crud
frameworkVersion: '2 || 3'

provider:
  name: aws
  runtime: nodejs18.x
  lambdaHashingVersion: '20201221'
  region: <your-region>
  environment:
    AWS_LAMBDA_EXEC_WRAPPER: /opt/otel-handler
    OPENTELEMETRY_COLLECTOR_CONFIG_FILE: /var/task/atatus-collector.yaml
    OTEL_PROPAGATORS: tracecontext
    OTEL_TRACES_SAMPLER: always_on
  layers:
    - arn:aws:lambda:<region>:184161586896:layer:opentelemetry-nodejs-<version>
    - arn:aws:lambda:<region>:184161586896:layer:opentelemetry-collector-<amd64|arm64>-<version>

functions:
  hello:
    handler: src/handler.hello
    events:
      - httpApi:
          path: /hello
          method: get
  app:
    handler: src/app.handler
    events:
      - httpApi:
          path: /app
          method: get

plugins:
  - serverless-offline
- Region: Change
<your-region>to the AWS region closest to your service or where you want to deploy your Lambda functions. - ARNs: Replace
arnwith your specific ARNs for the layers you want to use. These ARNs should point to the correct AWS Lambda layers in your AWS account.
Step 5: Add OTel collector Endpoint
This configuration sets up the OpenTelemetry Collector to receive telemetry data from your Node.js application via OTLP, enhance it with resource attributes, and then export it to Atatus using the specified endpoint and API key.
receivers:
  otlp:
    protocols:
      http:

processors:
  resource:
    attributes:
      - key: env
        value: "dev"
        action: upsert
      - key: service
        value: "lambda-node-app"
        action: upsert
      - key: version
        value: "1.1.1"
        action: upsert

exporters:
  otlphttp:
    endpoint: "https://otel-rx.atatus.com/"
    headers:
      api-key: "d0594c10e7e44c3e9d9ab"

service:
  pipelines:
    traces:
      receivers: [otlp]
      processors: [resource]
      exporters: [otlphttp]
    metrics:
      receivers: [otlp]
      processors: [resource]
      exporters: [otlphttp]
Step 6: Test Locally
Once you've deployed the code in AWS, the next step is to test your application locally using the Serverless framework's offline plugin:
serverless offline
Output:
serverless offline
Running "serverless" from node_modules

Starting Offline at stage dev (ap-south-1)

Offline [http for lambda] listening on http://localhost:3002
Function names exposed for local invocation by aws-sdk:
           * hello: node-aws-lambda-crud-dev-hello
           * app: node-aws-lambda-crud-dev-app

   ┌─────────────────────────────────────────────────────────────────────────┐
   │                                                                         │
   │   GET | http://localhost:3000/hello                                     │
   │   POST | http://localhost:3000/2015-03-31/functions/hello/invocations   │
   │   GET | http://localhost:3000/app                                       │
   │   POST | http://localhost:3000/2015-03-31/functions/app/invocations     │
   │                                                                         │
   └─────────────────────────────────────────────────────────────────────────┘

Server ready: http://localhost:3000 🚀
Deploying and Testing Your Serverless Node.js Application in AWS
After verifying the successful execution of our function in a local environment, our next objective is to proceed with packaging, deploying, and subsequently testing our Lambda function within the AWS ecosystem.
This includes preparing the code and any necessary dependencies for deployment, uploading the packaged code to Lambda, configuring necessary permissions and testing it in the AWS environment.
i.) Package Your Lambda Function
Package your Lambda function along with its dependencies into a ZIP file. This can be done manually or using tools like npm pack. Ensure you exclude unnecessary files like node_modules.
While it's possible to add the code directly to the Lambda console, for complex applications featuring numerous microservices, an alternative approach involves manually creating a zip file containing the provided code.
zip -r function.zip .
This method allows for more organized management and deployment of the application's components, facilitating easier updates and maintenance in the long run.
ii.) Deploy Using Serverless Framework
Deploy your packaged Lambda function using the Serverless Framework:
serverless deploy
Output:
serverless deploy
Running "serverless" from node_modules

Deploying node-aws-lambda-crud to stage dev (ap-south-1)

✔ Service deployed to stack node-aws-lambda-crud-dev (107s)

endpoints:
  GET - https://2m3ac1mbg5.execute-api.ap-south-1.amazonaws.com/hello
  GET - https://2m3ac1mbg5.execute-api.ap-south-1.amazonaws.com/app
functions:
  hello: node-aws-lambda-crud-dev-hello (19 MB)
  app: node-aws-lambda-crud-dev-app (19 MB)
iii.) Testing Your Lambda Function
After deployment, test your Lambda function using the AWS Console or AWS CLI.

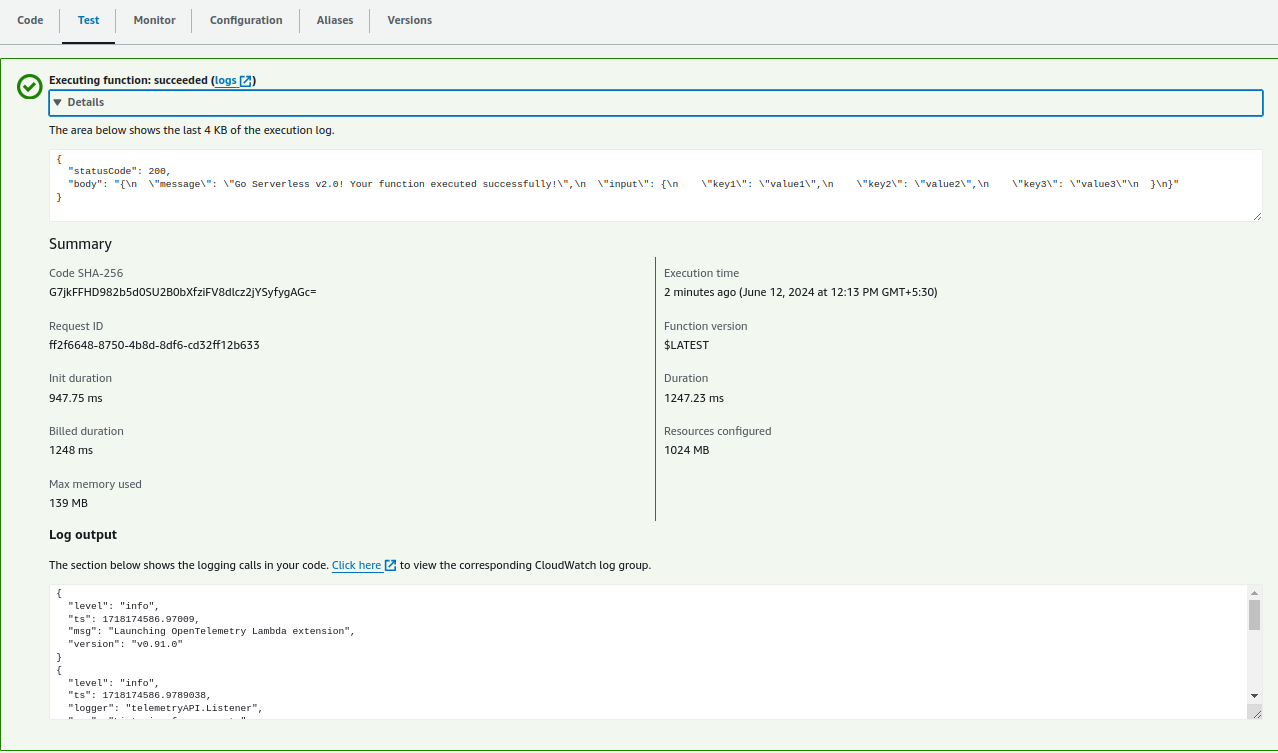
Within the Lambda console, navigate to Functions section and select the function you created earlier. Within the Test tab, configure a new test event and click on "Test".
Once the function is executed successfully, you will get an output screen like this:
You can test the same function in your terminal too. To do so, use the get command from the previous step, simply copy it and paste it in your terminal:
curl https://2m3ac1mbg5.execute-api.ap-south-1.amazonaws.com/hello
curl https://2m3ac1mbg5.execute-api.ap-south-1.amazonaws.com/app
Monitor Traces with Atatus
In the beginning of this blog, we saw how important it is to monitor AWS Lambda and all the functions we create within it. To ensure your Lambda function is correctly instrumented, you can monitor the traces in your chosen backend. Here we are using Atatus to monitor our serverless application.
First of all log into your Atatus account (or signup using a new ID freely). Once you're inside the dashboard, click on APM. Within that, choose your project. You will be able to see all the invoked functions here.
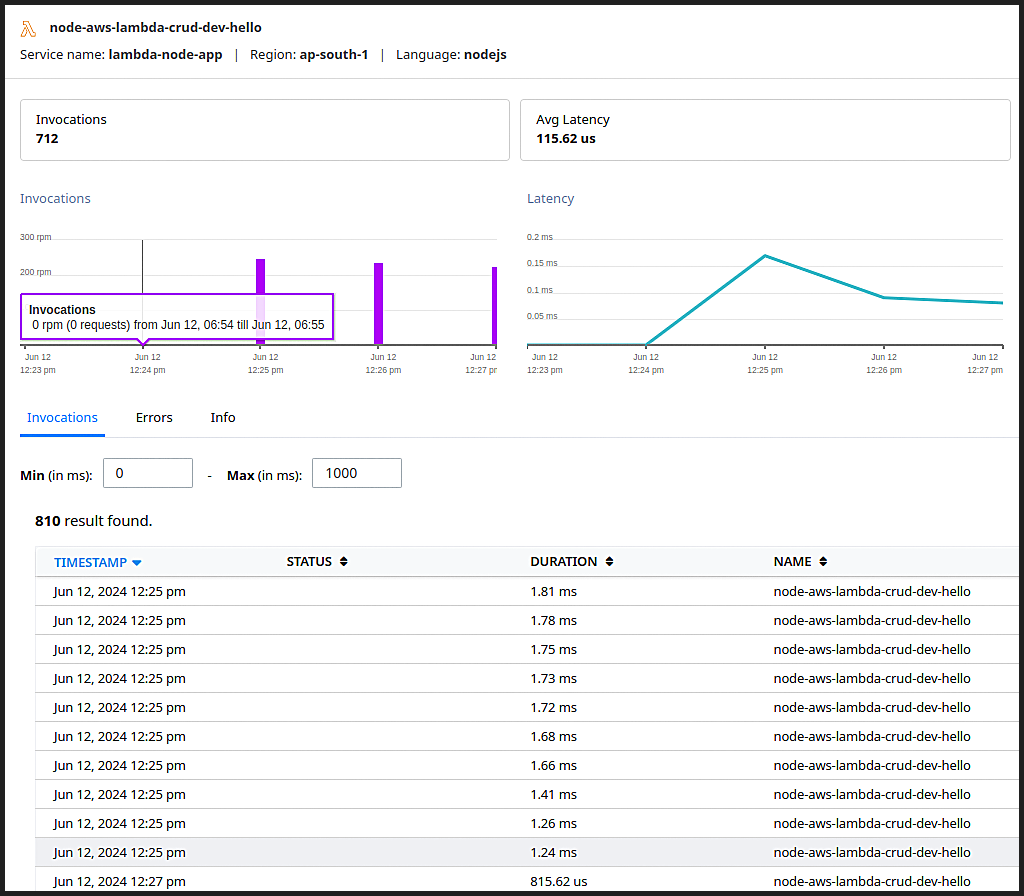
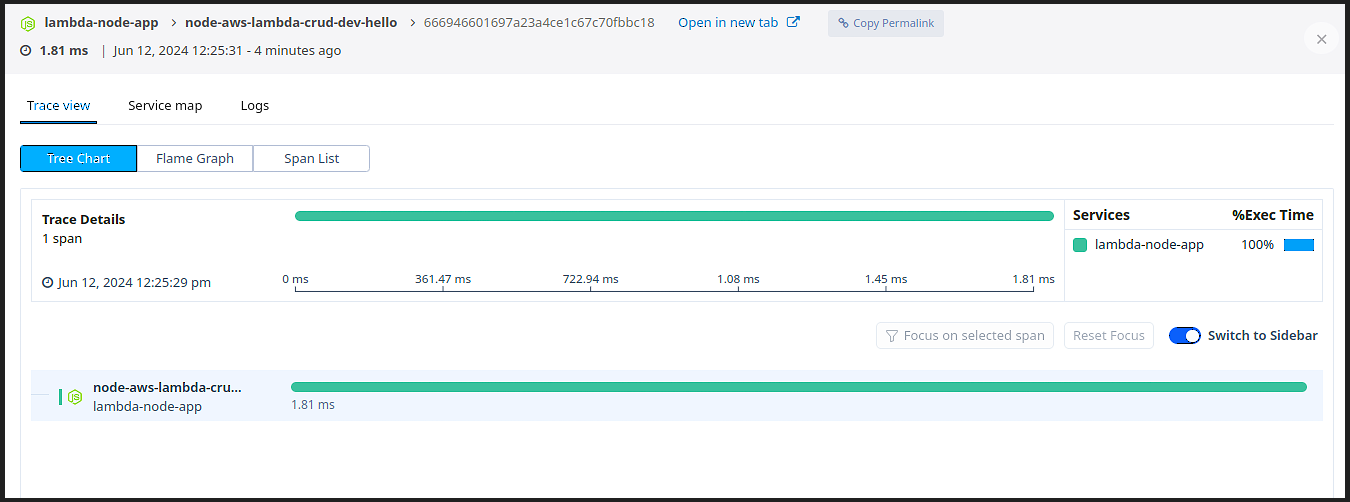
Here, you can see the function was executed every time it was invoked, iterating that our function is correct and is running properly.
You can also click on individual function to see deeper insights in the form of a Gantt chart or a Flame Graph.
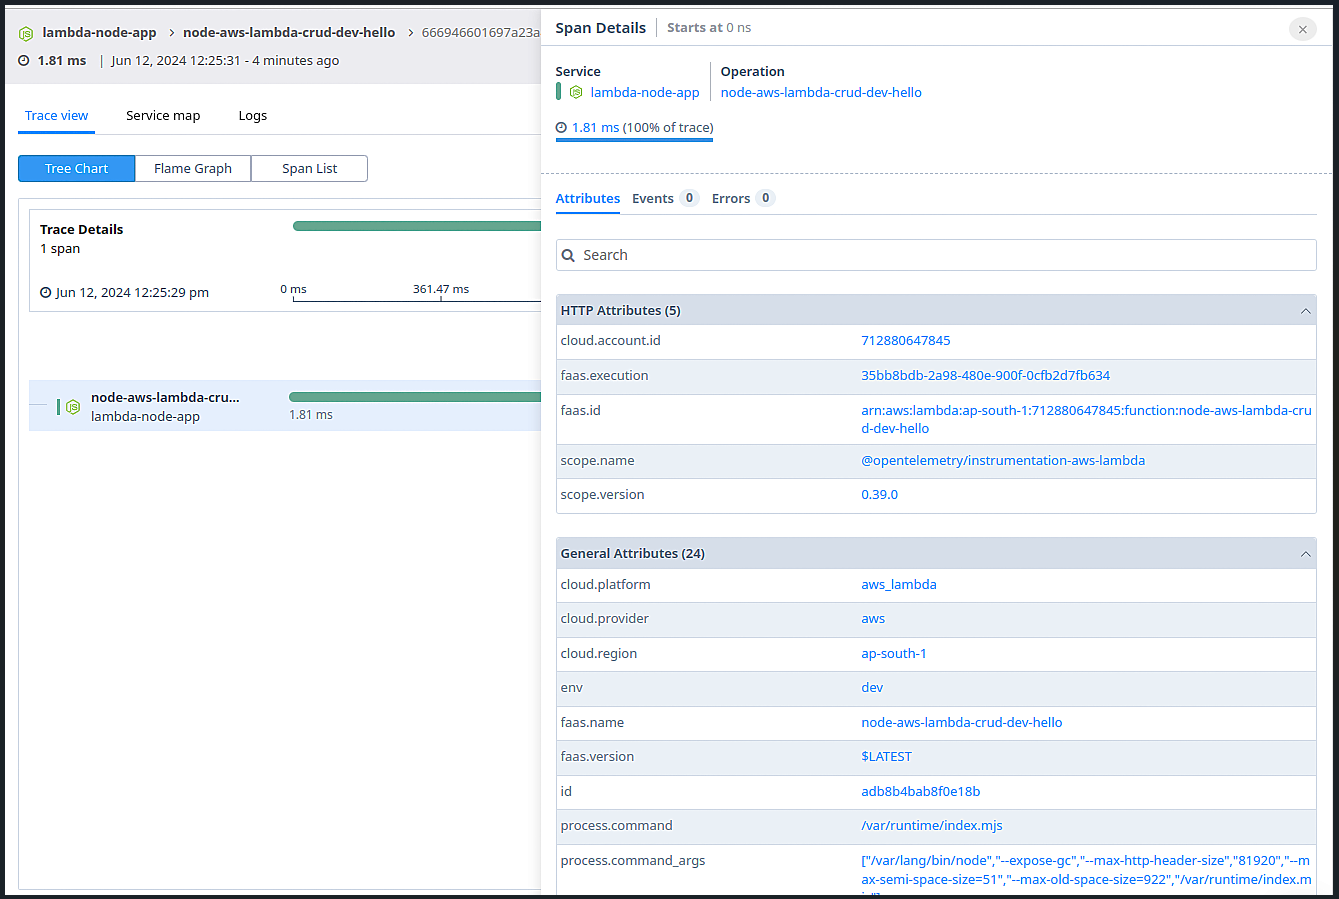
Further when you click on these individual invocations, you can get complete span details including HTTP and General attributes.
But if you were looking for something simpler and easy to understand, you can very well take help of the service maps.
Get a bird's eye view of all the transactions happening across your entire stack in a single place with Atatus Service Maps. You will be able to view every application running in the deployment and see how each of these services communicate with each other.
Create Custom Dashboards and Configure Alerts
Further you can create custom dashboards to monitor key performance indicators such as invocation count, duration, and errors. You can also add widgets to track these metrics.
Follow this by setting up alerts in order to receive notifications for specific thresholds (e.g., high error rates or increased response times). Use Atatus insights to analyze the performance of your Lambda functions and identify bottlenecks and optimize your code accordingly.
To Remove the AWS Lambda Function
Although AWS is a great tool, there are some hidden charges you must be cautious off. First of all, they charge additionally for certain features or usage beyond a certain limit. If you don't follow on and regularly monitor services running on AWS, costs can quickly escalate. It also charges for data transfer across regions, so be careful while selecting your region as well.
Despite these considerations, the free tier allows users to accomplish significant work. However, it's crucial to remove deployed functions at the end of each day to avoid unexpected charges.
To remove a deployed function using the Serverless Framework, open your terminal and navigate to the project directory and run the following command:
serverless remove
Wrapping Up
This comprehensive guide provides the steps necessary to package, deploy, test, and monitor your serverless Node.js application effectively, leveraging tools like the Serverless Framework, AWS CLI, and Atatus for performance monitoring and visualization.
In this blog, we saw how to monitor Lambda function invocations for Node.js applications. We broke down the entire process into these sections:
- Writing a serverless Node.js application.
- Integrating OpenTelemetry to this application.
- Deploying this application in AWS Lambda.
- Invoking function and testing if the function is working properly.
- Monitoring all these lambda functions.
While AWS CloudWatch and other built-in monitoring tools from cloud providers offer insights into the performance of your functions, they often lack advanced visualizations and seamless third-party integrations. Dedicated serverless monitoring tools address these shortcomings, offering enhanced visualizations and better integration capabilities, ultimately providing a superior user experience.
Serverless Monitoring with Atatus
Atatus provides complete visibility into AWS, enabling you to collect metric data from your Lambda functions and display it alongside data from other applications not within AWS. It's a comprehensive solution that offers convenience and efficiency.
Notably, Atatus Serverless Monitoring extends its support to multiple platforms, including Node.js, Python and Java. This versatility proves invaluable, especially when developing Lambda functions that interact with other AWS services such as S3 and DynamoDB.
If you're interested in monitoring your Lambda functions with Atatus, this article provides step-by-step instructions. However, if you prefer a hands-on approach, you can request a demo or try our free trial anytime.
#1 Solution for Logs, Traces & Metrics
![]() APM
APM
![]() Kubernetes
Kubernetes
![]() Logs
Logs
![]() Synthetics
Synthetics
![]() RUM
RUM
![]() Serverless
Serverless
![]() Security
Security
![]() More
More


