A Comprehensive Guide to OpenTelemetry: Traces, Spans, and Their Hierarchy
OpenTelemetry is an open-source framework for monitoring and observability in distributed systems. Traces and spans form the core of OpenTelemetry, providing the essential framework to track and understand how requests move through various services. This blog dives deep into the anatomy of traces, the structure of spans, and the hierarchical relationships that make distributed tracing possible.
Table of Contents:
- What is an OpenTelemetry trace?
- Spans: The building blocks of traces
- Anatomy of a trace: Hierarchy and relationships
- Visualizing trace hierarchy
- Real-life example
- Importance of understanding trace hierarchy
What is an OpenTelemetry trace?
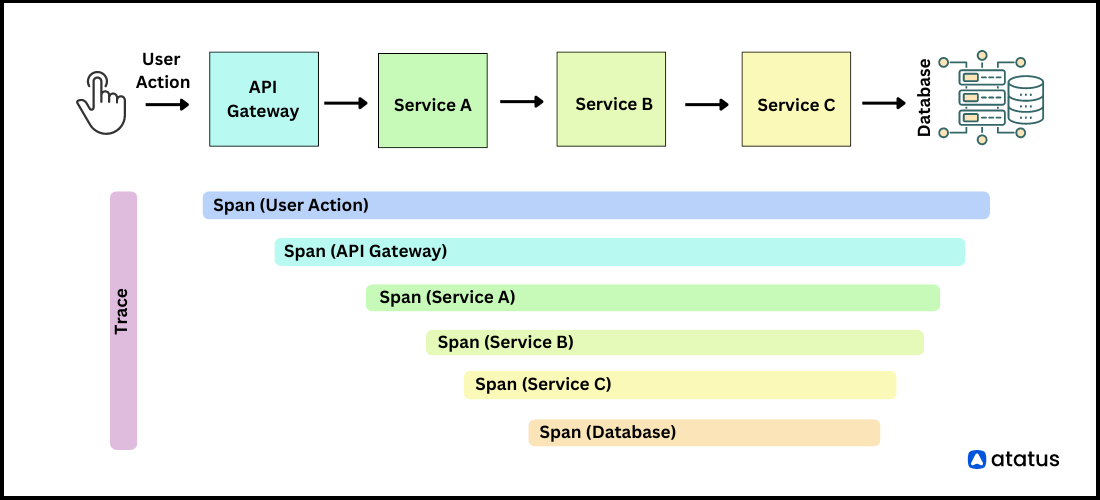
A trace represents the lifecycle of a request as it flows through a distributed system. It comprises multiple spans, each representing an individual operation or task within the request.
Traces provide a holistic view of how requests interact with various services and components, enabling developers to diagnose performance issues, identify bottlenecks, and understand system behaviour.
Spans: The building blocks of traces
A span is the fundamental unit of work in OpenTelemetry. It records information about a single operation, such as a database query, an API request, or a function execution. Each span is enriched with metadata, which helps track its execution and understand its role within the trace.

Key components of a span
(i). Operation name: The operation name is a descriptive label for the span, representing the task it tracks.
Examples:
"HTTP GET /api/orders""SQL SELECT on users_table""Cache Lookup for product_id"
(ii). Start and end time: Spans record their start and end times, which help measure the duration of the operation.
Example:
{
  "startTime": "2024-12-11T10:15:00.123Z",
  "endTime": "2024-12-11T10:15:01.456Z",
  "durationMs": 1333
}
(iii). Attributes: Attributes are key-value pairs that provide additional context about a span.
Examples:
{
  "http.method": "GET",
  "http.url": "https://example.com/api/orders",
  "db.statement": "SELECT * FROM users WHERE id = 42",
  "user.id": "12345"
}
(iv). Events: Span events are significant occurrences during a span's lifecycle, such as errors or checkpoints.
Example:
{
  "name": "exception",
  "attributes": {
    "error.message": "Timeout while connecting to database",
    "error.code": 504
  },
  "timestamp": "2024-12-11T10:15:00.567Z"
}
(v). SpanContext: The SpanContext uniquely identifies a span and its trace. It includes:
- Trace ID: Identifies the entire trace.
- Span ID: Identifies the specific span.
- Trace flags: Indicate sampling decisions.
(vi). Links: Links connect spans from different traces or represent asynchronous operations.
Example:
{
  "links": [
    {
      "traceId": "abc123",
      "spanId": "xyz789",
      "attributes": {
        "reason": "triggered by event"
      }
    }
  ]
}
(vii). Span operations: Spans support various operations like:
- Starting and ending spans.
- Adding attributes and events dynamically.
Anatomy of a trace: Hierarchy and relationships
The hierarchy and relationships within an OpenTelemetry trace are essential for visualizing the flow of a request across services and understanding how different operations contribute to the overall process. By organizing spans in a parent-child structure, OpenTelemetry creates a clear map of dependencies, parallel executions, and causal relationships.
Key elements of trace hierarchy

(i). Root Span: The root span serves as the entry point of a trace. It represents the first operation triggered in a workflow, such as a user request, an HTTP API call, or an event received by a message queue.
Characteristics:
- No parent span.
- Captures metadata such as HTTP method, URL, client IP, or headers.
- Provides the starting context for all subsequent spans.
Example:
Root Span: HTTP GET /api/orders
(ii). Child Spans: Child spans represent operations that are triggered as a result of the root span or other child spans. These operations can include database queries, API calls, computations, or external service interactions.
Characteristics:
- Every child span has a parent span identified by its
parentSpanId. - They inherit trace context from the parent span.
Use Cases:
- A root span for an API call triggering a child span for a database query.
- A parent span representing a transaction with multiple child spans for parallel tasks.
Example:
Root Span: HTTP GET /api/orders
├── Child Span: SQL SELECT on orders_table
├── Child Span: Call to payment gateway
(iii). Siblings: Siblings are spans that share the same parent span but represent independent operations. They often execute in parallel, such as fetching data from multiple sources or performing simultaneous computations.
Characteristics:
- Operate independently of each other.
- Help track concurrent processes in a distributed system.
Example:
Root Span: HTTP GET /api/orders
├── Child Span: Fetch user data
└── Child Span: Fetch order details
(iv). Parent-child relationship: The parent-child relationship forms the backbone of the trace hierarchy. Each parent span can have multiple child spans, and these relationships reflect the causal flow of operations.
- Parent Span: Represents the initiating operation.
- Child Span: Represents dependent or subsequent operations.
Examples:
- A parent span for a message producer and child spans for message consumers.
- A parent span for a server request triggering child spans for data processing and response generation.
(v). Sub-child spans: Sub-child spans are child spans of other child spans, creating a deeper hierarchy. These spans represent operations triggered as a result of another child span.
Use Case: Capturing intermediate steps of a complex operation.
- Example:
Root Span: HTTP GET /api/orders
└── Child Span: Fetch order details
    └── Sub-child Span: Query Redis cache
(vi). Links: Links connect spans across different traces or represent relationships in asynchronous or decoupled workflows.
Example use case:
- A producer span in one trace linked to a consumer span in another trace.
- Tracking a workflow that spans multiple, independent traces.
Example:
Root Span: Publish message to queue
└── Linked Span: Process message in consumer service
Visualizing trace hierarchy
The trace hierarchy can be represented as a tree-like structure, where the root span is the trunk, child spans are the main branches, and sub-child spans are smaller branches or leaves. This hierarchical view enables you to:
- Pinpoint bottlenecks in execution.
- Understand parallel operations and their impact on the system.
- Identify root causes of failures by tracing errors back to their origin.
Real-life example
E-commerce Order Workflow: Let’s look at an example of how an e-commerce application processes a customer’s order using OpenTelemetry. This example breaks down the workflow into spans, showing the main operations, intermediate tasks, and parallel processes involved in a checkout request.
Root Span: HTTP POST /api/checkout
├── Child Span: Validate cart
│   └── Sub-child Span: Fetch product details from inventory service
├── Child Span: Process payment
│   └── Sub-child Span: Call to payment gateway
└── Child Span: Update order status
    ├── Sub-child Span: Write to database
    └── Sub-child Span: Send confirmation email
- Root span:
HTTP POST /api/checkoutrepresents the main operation initiated by the customer. - Child spans: Each major operation (validation, payment processing, order updates) is represented as a child span.
- Sub-child spans: Intermediate tasks like database writes or API calls are captured as sub-child spans.
- Siblings: Spans for operations like updating the order status and sending emails run in parallel.
Importance of understanding trace hierarchy
- Holistic view: Provides a complete picture of request flow across services.
- Debugging: Pinpoints the source of errors or delays.
- Dependency analysis: Identifies inter-service dependencies and potential points of failure.
- Optimization: Highlights opportunities for parallelism or load balancing.
OpenTelemetry’s traces and spans, along with their hierarchical organization, are essential for understanding distributed systems. By exploring components like operation names, attributes, events, and links, and analysing trace hierarchies, you can gain valuable insights into your system's performance and behaviour.
Advanced tracing with Atatus
Distributed tracing has become an essential debugging tool for applications built on microservices architecture. To implement distributed tracing for your application, you can use Atatus.
Atatus is an observability platform that offers application metrics, distributed tracing, and logging capabilities in a single dashboard. It allows you to correlate these telemetry signals for faster issue resolution.
With native support for OpenTelemetry standards, Atatus helps you identify the slowest endpoints in your application by showing the exact request trace, making it easier to pinpoint issues.
You can filter traces by service name, operation, latency, and errors. It also lets you run aggregates on trace data, all within a unified UI that combines both metrics and traces for seamless monitoring.
The platform stands out with its advanced visualization features, offering rich, interactive dashboards that enable deep analysis and quick access to actionable insights.
Additionally, customizable alerts can be set up based on trace data and service performance, ensuring prompt notifications of any critical issues.
New to Atatus? Try it now with a 14-day free trial.
#1 Solution for Logs, Traces & Metrics
APM
Kubernetes
Logs
Synthetics
RUM
Serverless
Security
More


