Logging, Traces, and Metrics: What is the difference?
Several tech giants like Amazon and Netflix have jumped from their monolithic applications to microservices. This has allowed them to expand their business interface tremendously and improve their services.
Not only them, but most businesses today are dependent on microservices. Twitter currently has about a thousand such services working together, releasing meaningful outputs.
And many a time, these services are developed using different programming languages, deployed into separate runtime containers, and managed by different teams. This is why visibility into the working and performance of these diverse service topologies becomes exceedingly pertinent.
And thus, we come to the topic of our blog - What exactly is visibility? How do you achieve it? What do you mean by Logging, Tracing, and Monitoring?
- Defining Logging
- What is Tracing?
- Monitoring Metrics
- Implementing Observability
- What should you choose?
Defining Logging
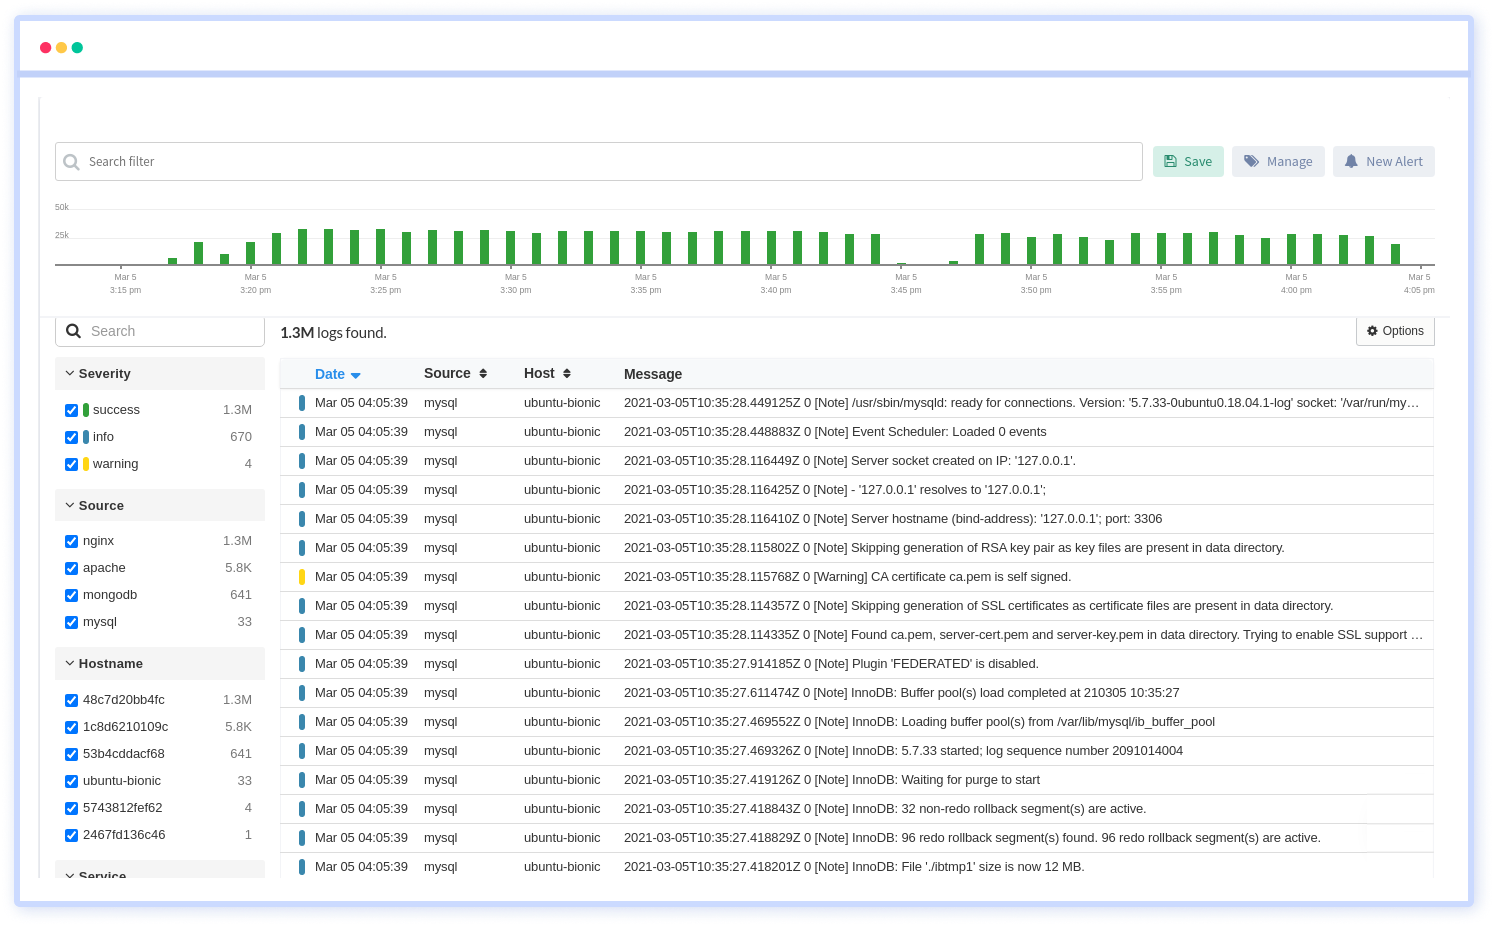
Logging can be considered the first line of defense for finding bugs and other blockages. It is also the most simplest way of observing your system programs.
Consider your call logs! when you open your phone’s call log - there is a list of all the incoming and outgoing calls on it. It further even segregates calls as recent, missed, or most-dialed. This makes the whole process of us managing our calls easier. We have better visibility into who called us, what important calls we’ve missed, so forth and so on.
Similarly, Logs are the timestamped data of every event that occurs within each compartment of your application. The log data is stored in a log file which can be accessed after converting it into text formats.
They are easy to generate, and most application frameworks, libraries, and languages have built-in logging support.
Log files provide comprehensive details about your application health - they tell you about any faults, errors, failures, or state transformation.
Logging can be complex, especially in distributed systems with multiple services. This rich data can cause processing issues, especially if they are logged too verbosely. So, we use filters, and several log levels can be assigned.
The most common ones are FATAL, ERROR, DEBUG, WARN, TRACE, and ALL. By analyzing all this filtered data, we can identify and troubleshoot problem areas.

Benefits:
- Built-in logging systems, so there is no need to install them additionally
- Provides complete details on the source, time, and place of occurrence of errors
- Filtering log data is possible
- Easy identification and troubleshooting
Limitations:
- Huge, clumsy data pools
- Adds onto storage space
- Analyzing log files is not easy
The microservices these days are intricately interwoven, so a succinct solution usually requires collating log information from multiple files.
Also, log files are mostly unstructured; reading them via a text file on your servers might not be plausible. That is why we provide you customized solutions with our Atatus Log Monitoring Tools.
With minimal set-up cost, we provide you with fully assisted Log Analytics and monitoring in real-time. Scalability is an added advantage!

What is Tracing?
Logs tell you everything about your application, but today’s technological world is driven by inter-communication. There are hundreds of applications calling each other every minute.
And logs don't tell you anything about these events!
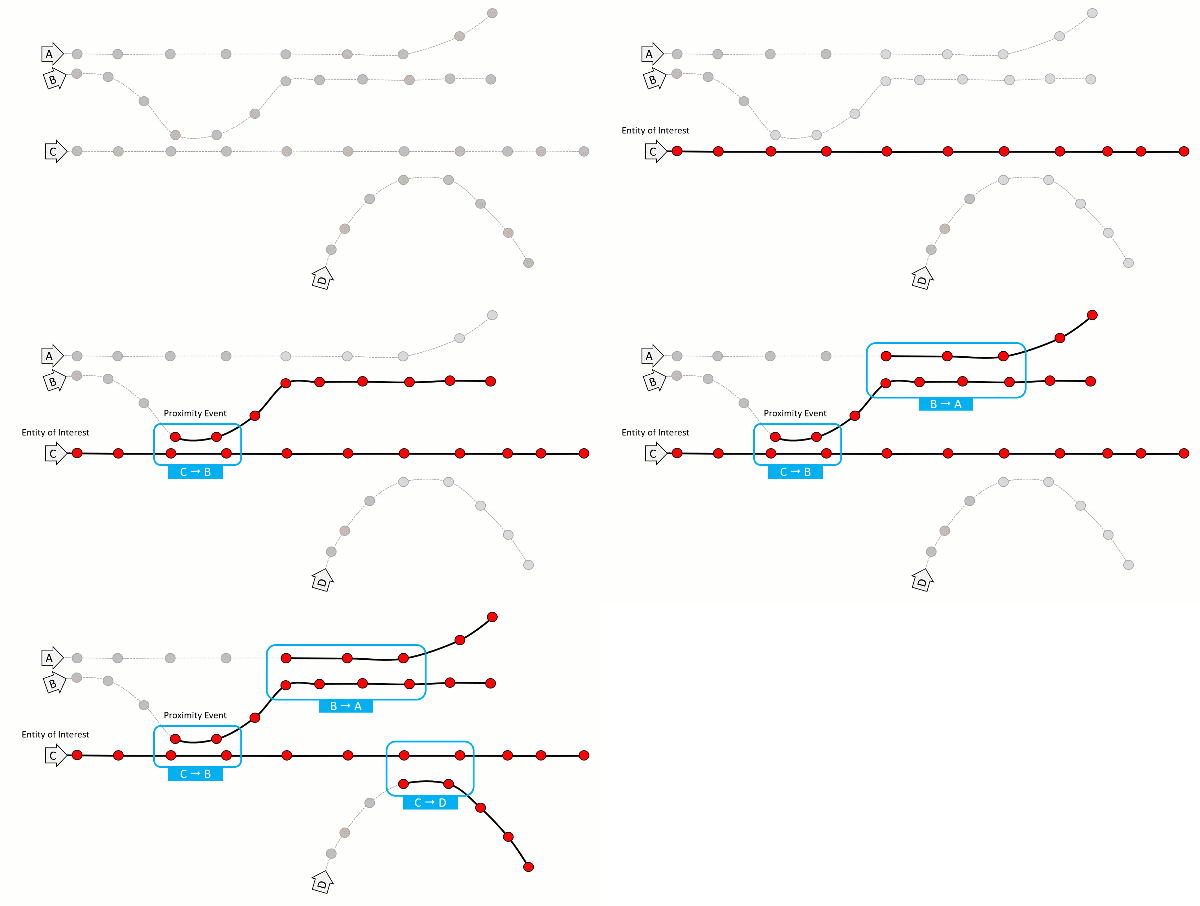
Microservices are a myriad of applications running parallel, and they work in conjunction to produce the desired results. Seeing how your request flows through these is essential. This is where tracing would help.
Tracing is one of the three pillars of observability. It provides a continuous view of how your application is working. It can track which services are running and where the latency occurred.
A span is the smallest unit in a trace and represents a piece of the workflow in a distributed landscape. It can be an HTTP request, call to a database, or execution of a message from a queue. A distributed trace is defined as a collection of spans.
With trace data analysis, you can measure overall system health, pinpoint bottlenecks, identify and resolve issues more quickly, and prioritize high-value areas for optimization and improvement.
Tracing is often the better choice while debugging and monitoring complex applications; tracing allows tracking the exact service you want data on.

Benefits:
- Pinpoints errors and failures; makes detection easier
- Works well for complex microarchitecture services
- Data can be collected in the form of semantics
- Latency tracking and Root cause analysis
Limitations:
- Unintended gaps; create problems in troubleshooting
- Complex layers
- Abundant implementation code
Monitoring Metrics
Metrics are a numerical representation of data. It includes values such as name, label, value, time of occurrence, etc., and conveys information about your application's components.
They represent a specific aspect of the system or application being monitored. They provide a means of measuring performance, health, and behavior of the system, and can be used to identify issues, trigger alerts, and measure the impact of changes.
Some common types of metrics that are typically monitored include:
- Resource utilization metrics: These metrics measure the utilization of various system resources such as CPU, memory, disk space, network bandwidth, etc.
- Performance metrics: These metrics measure the performance of the system, such as response time, latency, throughput, etc.
- Error rates metrics: These metrics measure the number of errors, exceptions, or failures that occur within the system.
- Saturation metrics: These metrics measure the extent to which a resource is being utilized, such as the number of active connections, open files, etc.
- Availability metrics: These metrics measure the availability of the system, such as the percentage of time the system is up and running, the number of times it was unavailable, etc.
Metrics can be collected using a variety of methods, including manual monitoring, system logs, and specialized monitoring tools. The choice of metric will depend on the system being monitored, and the goals of the monitoring effort.
Metrics serve the purpose of informing system administrators about their application health. How it is faring in various arenas, and what needs urgent attention.
It comes with alerting feature; whenever the threshold is breached for a certain metric, the admin receives the message. This allows him to act fast on a targeted issue.
Monitoring is more extensive and can be more costly compared to the other two concepts. However, monitoring is best in an ideal situation where funding isn’t an issue.
But we have a better option: Try our Application Performance Monitoring and Management.
It is an all-in-one integrated observability platform that makes application monitoring super easy with transaction monitoring, database monitoring, external requests monitoring, live performance data, smart notifications, compare releases, full-text search, and error tracking.
We provide a 14-day free trial option with access to all the premium features without registering your credit cards.

Benefits:
- Visualized data with pictorial graphs etc..
- Understanding and drawing inference becomes easier
- Real-time monitoring of web applications and APIs.
- Detailed performance metrics, including request traces and error logs.
- Customizable alerts and notifications.
- Easy integration with a wide range of web technologies and platforms.
- Scalability to accommodate the needs of organizations of all sizes.
- Advanced error tracking to quickly identify and resolve issues.
- Robust reporting capabilities to track performance over time.
- Collaboration features to enable teams to work together more effectively.
- User-friendly interface and intuitive navigation.
- 24/7 customer support and a robust knowledge base.
Limitations:
- Alerts are given out only when the threshold is breached
Implementing Observability
The world has grown out of its box, and monolithic applications are no longer made. Today, businesses work on communication and technology transfer. We are increasingly dependent on fellow developers to give out the best options for customers.
This means that we are experimenting with partnerships on the services front, and the system only gets bigger and bigger. Monitoring these entities becomes tiresome and energy-draining. That is why we have built targeted observability and monitoring platforms.
These platforms do a detailed job of analysis, making it easier for you to track the exact problem and work upon it then and there.
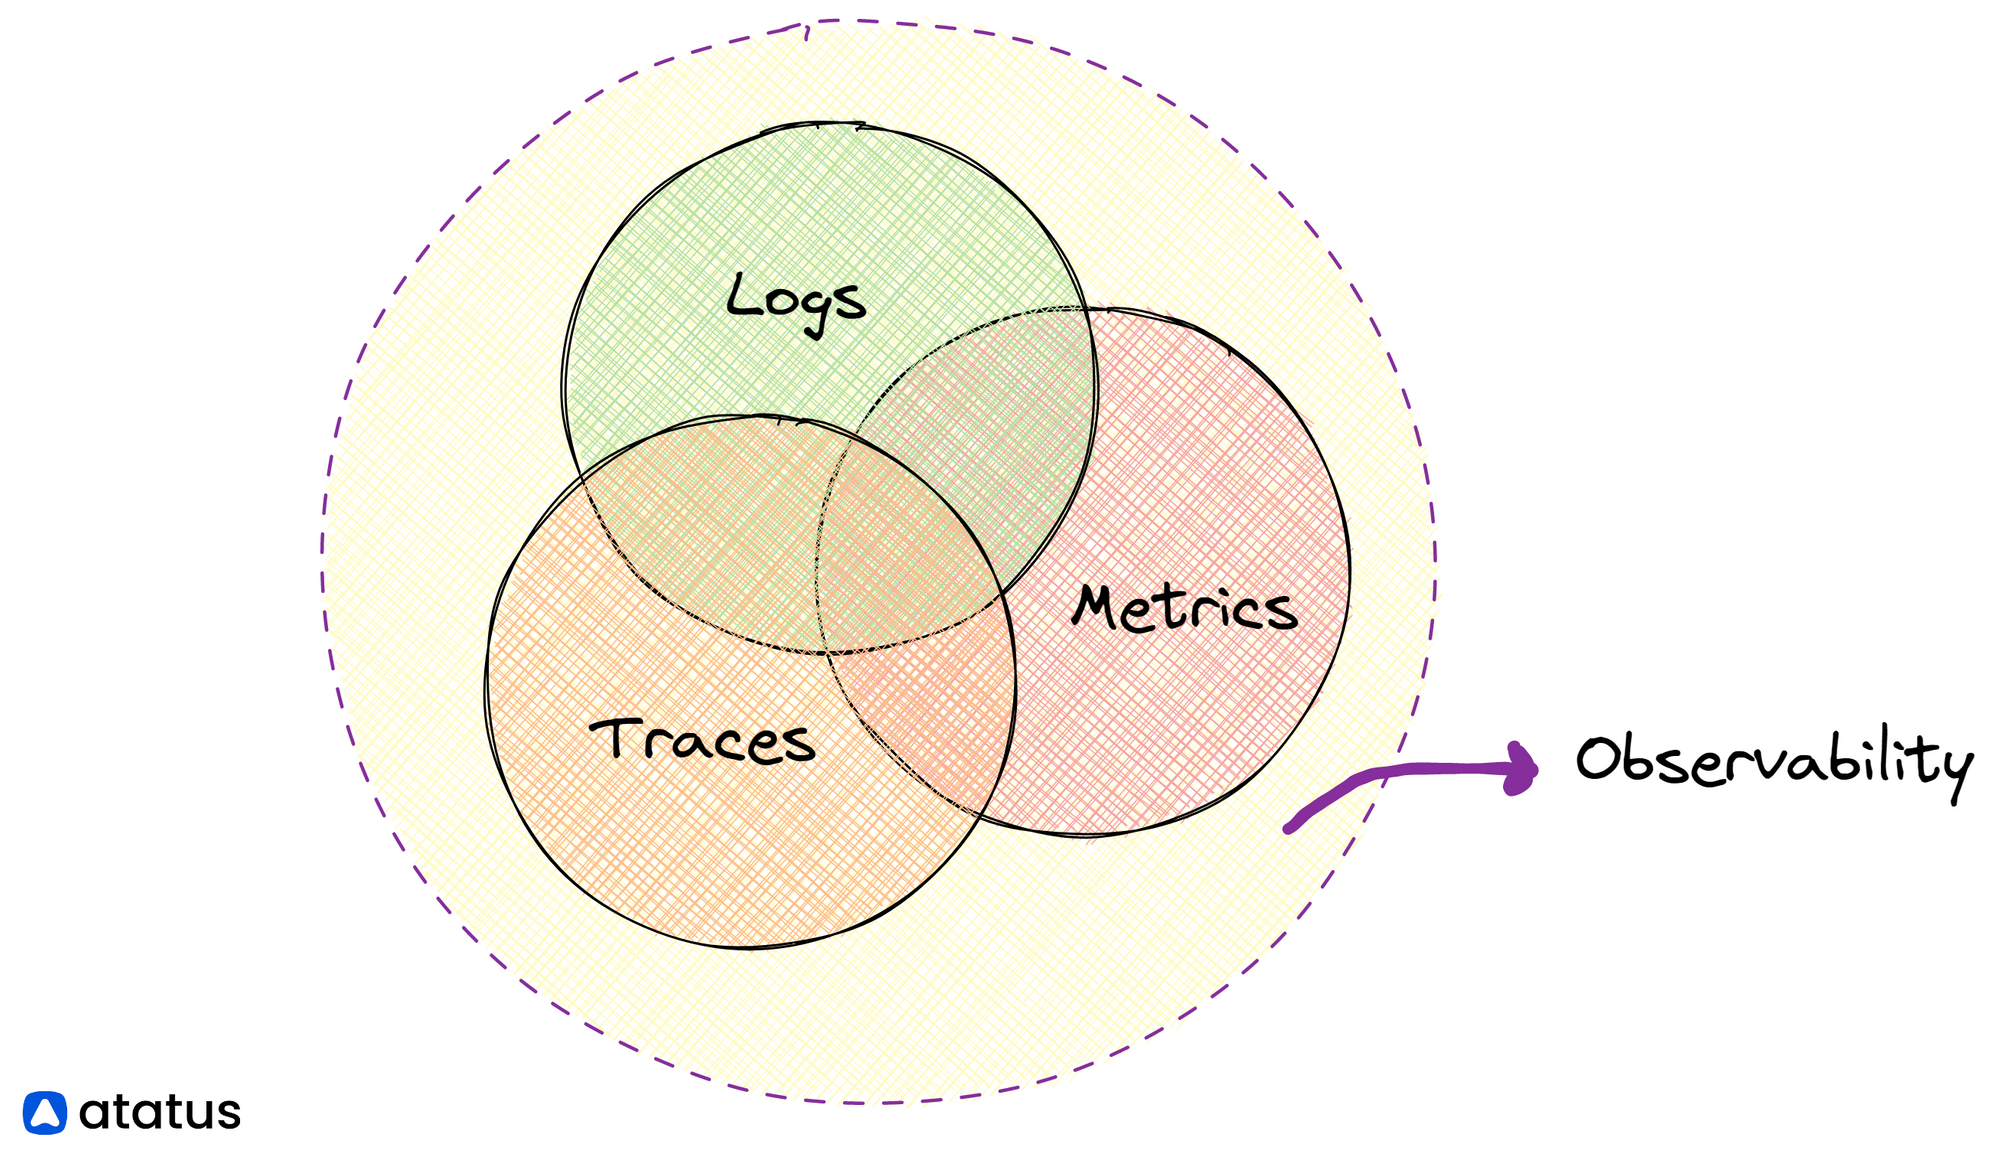
Observability stands on three pillars - Logs, Traces, and Metrics.

Adopting any one of these or a combination of these pillars of observability enables you to derive meaningful insights. Full-stack platforms that create visual, intuitive, and easy-to-understand dashboards from metrics, logs, and traces can be a good starting point (Make sure you don't pick a platform that locks you into a specific cloud platform).
The next step would be to set up a concerted team that looks into these data regularly. Even the most brilliant observability tooling falls short if not ladled with sound engineering intuition and instincts.
Always choose a tool whose dashboards are visually perceptible for you. Don't overestimate an extraneously striking dashboard to always give you the right results.
What should you choose?
Logging is often the first choice for developers and system admins. However, tracing and monitoring are suggested if they have a large data set or a company big enough to deal with several microservices.
One must understand that these are not exclusive entities. If tracing points out a specific service that faulted, again, you would have to go back to the log file to check the exact issue with the service and the time it occurred, and also the effect it had on other related services.
An organization that already uses microservices or serverless architectures, or plans to adopt containers and microservices, will be able to debug its systems using a combination of all the telemetry data. And thus, they would be deploying a comprehensive observability platform.
Here are some general guidelines for when to choose each:
- Logging: You can use logging to record events and messages in your application, such as error messages, debugging data, and status updates. It is also possible to use logs for auditing and compliance purposes.
- Traces: When you need to understand the flow of requests through your system and how individual components perform, choose traces. The use of trace is particularly useful for diagnosing performance issues and identifying bottlenecks.
- Metrics: The most appropriate time to use metrics is when you need to keep track of the performance of your system over time and identify trends and patterns. You can use metrics to set performance goals, measure progress, and optimize your application based on data.
In some cases, you may want to use a combination of these types of data to get a complete picture of the performance of your application.
For example, you might use logs to diagnose a specific problem, traces to understand the flow of requests that led to the problem, and metrics to monitor the overall performance of your system.
Trusted and tested personal options in this stead are Atatus, Datadog, Sematext, etc.
To wrap up
If you are a developer or system administrator, you might already know how important monitoring your applications are. Focussed monitoring tools help a long way in tackling performance bottlenecks.
They give you a concerted view on all the services running on your platform and provide a proper analysis of its health and performance.
We’ve tried to provide a comprehensive view on all monitoring possibilities here. For further knowledge, you might want to go through Observability - Software and Tools.
Atatus API Monitoring and Observability
Atatus provides Powerful API Observability to help you debug and prevent API issues. It monitors the consumer experience and is notified when abnormalities or issues arise. You can deeply understand who is using your APIs, how they are used, and the payloads they are sending.

Atatus's user-centric API observability tracks how your actual customers experience your APIs and applications. Customers may easily get metrics on their quota usage, SLAs, and more.
It monitors the functionality, availability, and performance data of your internal, external, and third-party APIs to see how your actual users interact with the API in your application. It also validates rest APIs and keeps track of metrics like latency, response time, and other performance indicators to ensure your application runs smoothly.
#1 Solution for Logs, Traces & Metrics
APM
Kubernetes
Logs
Synthetics
RUM
Serverless
Security
More


![New Relic vs Splunk - In-depth Comparison [2025]](/blog/content/images/size/w960/2024/10/Datadog-vs-sentry--19-.png)
![New Relic vs Sentry - Which Monitoring Tool to Choose? [2025]](/blog/content/images/size/w960/2024/10/VS--1-.png)
![Splunk vs Prometheus: A Side-by-Side Comparison [2025 Guide]](/blog/content/images/size/w960/2024/08/Datadog-vs-sentry--13-.png)