Lighthouse Performance Metrics: What They Are & How to Improve Them
Google research found more than half of the page visits are abandoned if a page takes more than 3 seconds to load
Google has made page speed a ranking factor in mobile searches for quite sometime now. Thus measuring performance has become a key part of any web development project. Performance, accessibility and general SEO best practices are major factors in search engine rankings. Your site's performance can have a big impact on how it is perceived. It can be stated as how fast a website is, or how good the user experience is with the site.
To make your product as seamless as possible in terms of user-experience one will lookout for tools that would allow the site owners to analyze the performance of their web application to detect the aspects that were dragging down the numbers. Google offers a set of free tools that detects and pinpoints all the issues within your application and helps you in improvising the website.
One such tool is Lighthouse, an automated tool with which you can quickly access any website URL and analyze the technical optimization to improve the performance such as page load time, page load speed, accessibility, web security etc..
Let's take a deep look into the Lighthouse tool and its performance metrics.
- What is Lighthouse?
- How to use lighthouse to measure the performance of your website?
- Lighthouse Audit Report
- Performance Metrics
#1 What is Lighthouse?
One of the most important things in the world of search engine optimization (SEO) is page speed. If your site takes too long to load, your users might bounce before they have a chance to take in your content. This is where the Google tool Lighthouse comes in. Lighthouse helps in analyzing your web pages and gives you a list of things to fix in order to have a faster site.
It is an open source performance auditing tool written in Javascript and runs in Node.js developed by Google available on GitHub, that allows you to run audits on the performance of your website or web app. Google uses Lighthouse as part of their auditing process for google web search. It can also spot performance regressions in real-world web applications running on Google Chrome.
It consists of a number of audits for performance, accessibility, progressive web apps, SEO and more and can run against any web page regardless of whether it's hosted on your own server or on a public service like Google or GitHub pages. Each audit contains reference docs with the explanation of why the audit is important and how to fix it. Lighthouse can be run as a web app from a GitHub repository, but also has a Chrome extension so it can be run on any website. It is used by a vast set of front-end developers to analyze numerous front-end performance metrics of web applications. Lighthouse is available in a different workflow which is easy to use and it's an essential tool for webmasters who care about the speed of the website.
#2 How to use lighthouse to measure the performance of your website?
There are four of the above 4 workflows of Lighthouse you will be able to run an audit of the web page. Here are the detailed steps with which you can measure the performance of your web page.
- Method 1: Chrome Dev Tools
- Method 2: CLI (Lighthouse Node Module)
- Method 3: Lighthouse API (Node Package)
- Method 4: Chrome Extension
Method 1: Chrome Dev Tools
- In Chrome, open the URL you need to audit and improve the performance.
- Right click anywhere in the page and open Chrome Dev Tools by selecting the Inspect element.
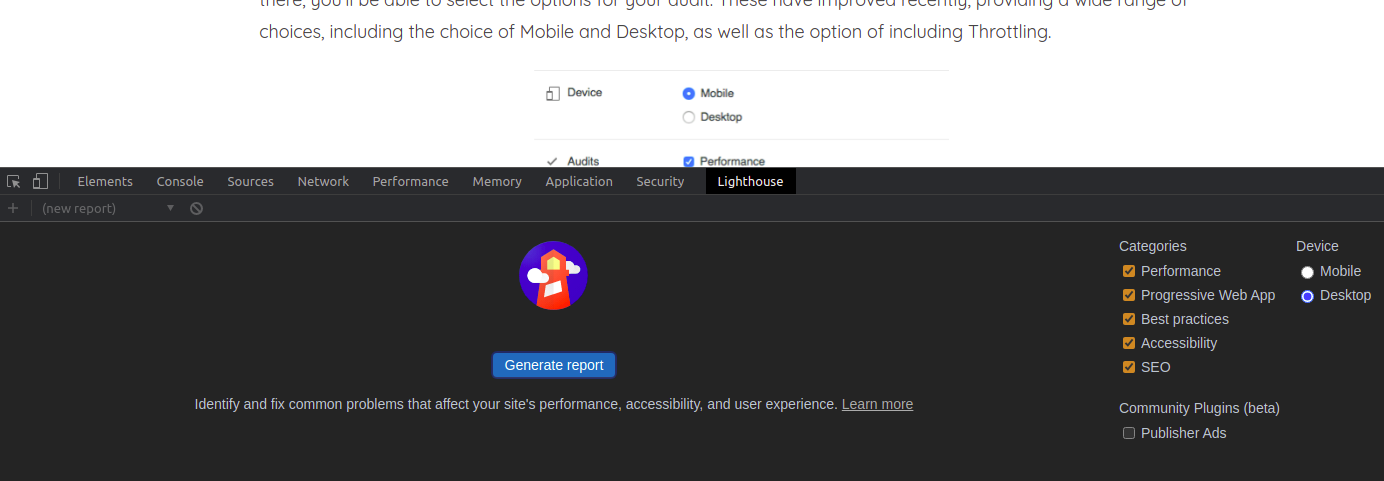
3. Click on the Lighthouse tab and select the audit categories and device that meets your needs.

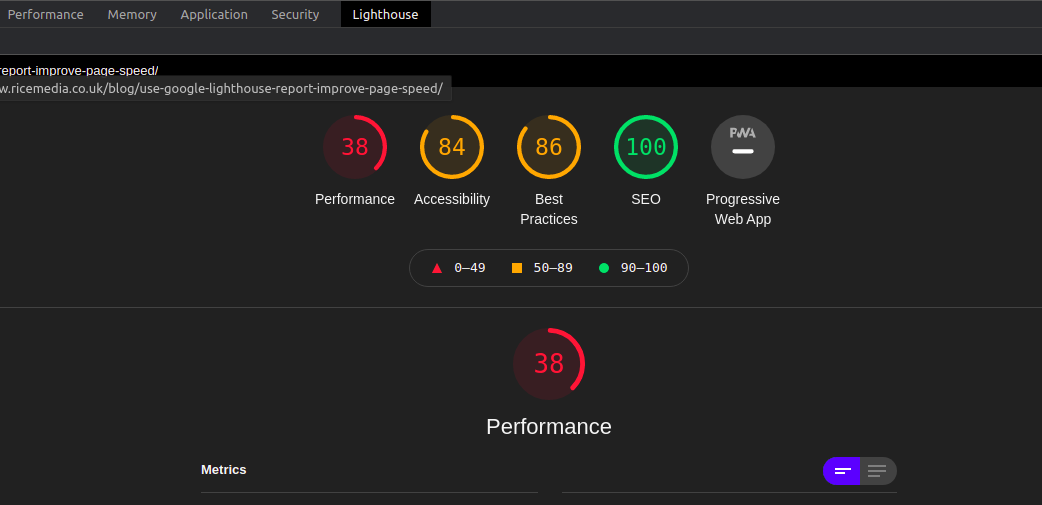
4. Click one the Generate Report button. In just a few seconds it will generate a report with all the performance metrics such as FCP, LCP, Speed Index, Total Blocking Time etc..
Method 2: CLI (Lighthouse Node Module)
To install the Node module:
- If you aren't using Google Chrome, download Google Chrome for Desktop.
- Install Node and check whether it is the current Long-Term Support version of Node.
- Install Lighthouse. The
-gflag installs it as a global module.
npm install -g lighthouseRun an audit by entering the following command in your command line
lighthouse <url>To see all the help options in Lighthouse enter the following command:
lighthouse --helpMethod 3: Lighthouse API (Node package)
Here is a sample code on how to run Lighthouse programmatically using the Node module.
const fs = require('fs');
const lighthouse = require('lighthouse');
const chromeLauncher = require('chrome-launcher');

(async () => {
  const chrome = await chromeLauncher.launch({chromeFlags: ['--headless']});
  const options = {logLevel: 'info', output: 'html', onlyCategories: ['performance'], port: chrome.port};
  const runnerResult = await lighthouse('https://example.com', options);

  // `.report` is the HTML report as a string
  const reportHtml = runnerResult.report;
  fs.writeFileSync('lhreport.html', reportHtml);

  // `.lhr` is the Lighthouse Result as a JS object
  console.log('Report is done for', runnerResult.lhr.finalUrl);
  console.log('Performance score was', runnerResult.lhr.categories.performance.score * 100);

  await chrome.kill();
})();
Method 4: Chrome Extension
Chrome Extension is an easier way to get started with Lighthouse. Chrome Dev Tools (Method 1), is more oriented towards JS developers, while Chrome Extension is easy to measure any given page that you visit. Follow the below steps to install the extension
- If you aren't using Google Chrome, download Google Chrome for Desktop.
- From the Chrome Web-store install the Lighthouse Chrome Extension.
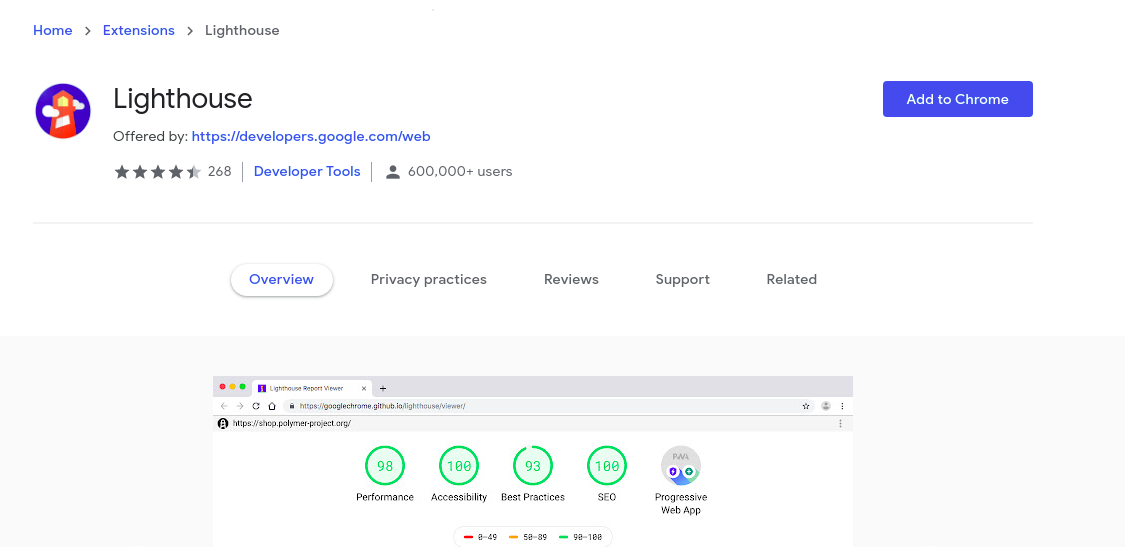
- Click the Add to Chrome button and Click on Add extension.

Run an Audit:
- In Chrome, navigate to the web page you want to audit.
- Click on the Lighthouse extension which is located next to the chrome address bar.

The Lighthouse menu expands as in the below screenshot.
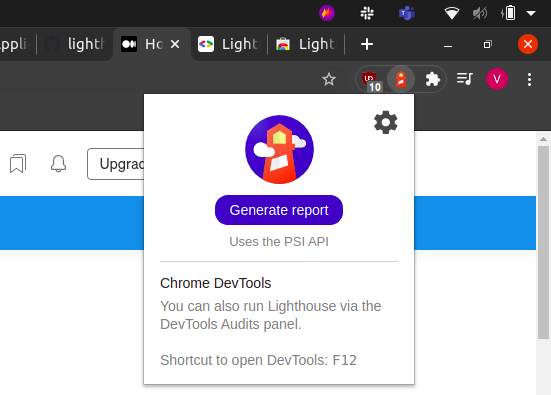
- Click on the Generate Report button. Lighthouse will perform an audit against the page and generates a report in the new tab. You can find out the report details in the below LightHouse Audit Report section.
#3 Lighthouse Audit Report
A visual representation of the report is presented in the form of a lighthouse diagram. The lighthouse diagram gets updated in real time as you interact with your web app or website. You can view the reports in the Lighthouse Report Viewer and share it online. The report contains 5 main categories: performance, accessibility, best practices, SEO, and progressive web app. To get the in-depth insights you can expand each section and view the metrics to see how you’re performing in these critical areas.
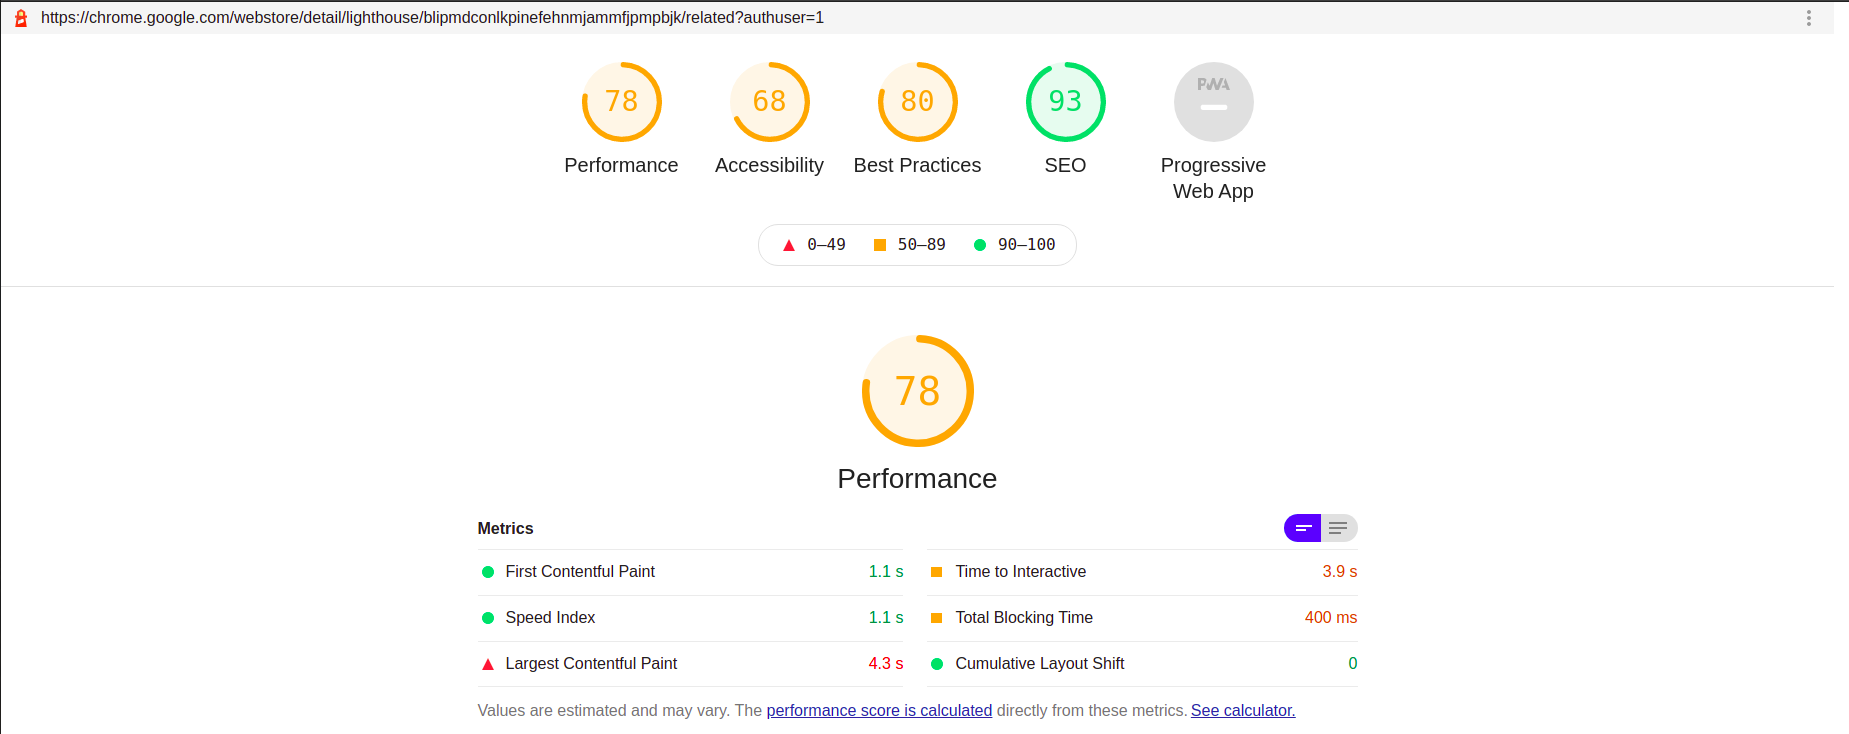
Fix all the errors and re-examine your web page with Lighthouse to ensure the quality of your web page. You can view the original stack trace inside the chrome Dev tools in a single click.
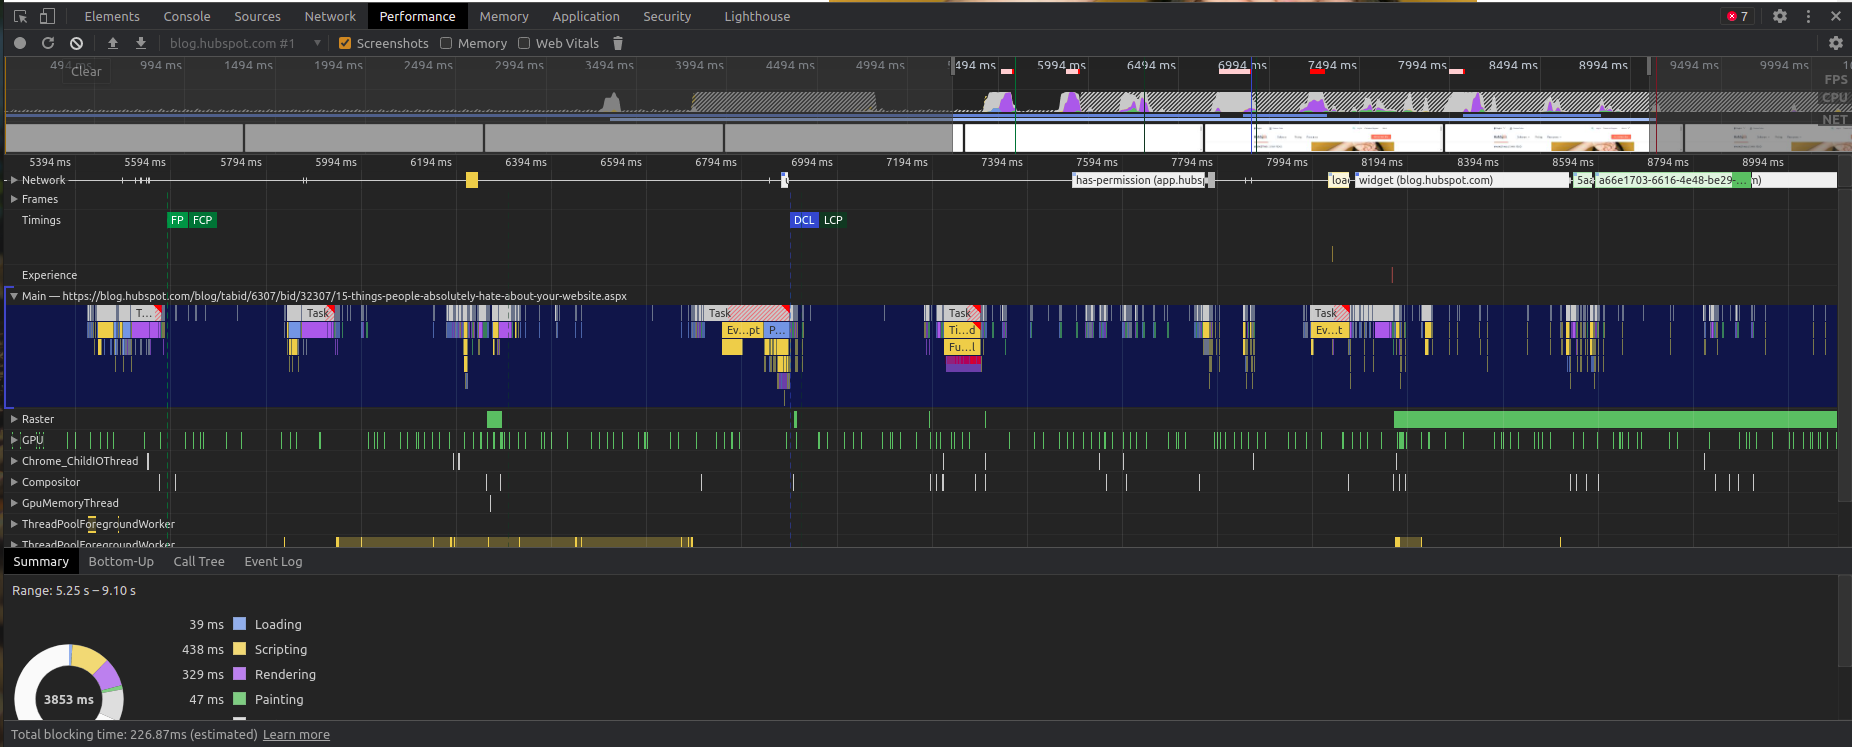
These insights give you a suggestion on how quick your entire web page loads and the report is more essential since the speed of page loading is most important.
As Neil Patel's statistics report says,
- 46% of people say waiting for pages to load is the worst part of their mobile browsing experience.
- 47% of consumers expect a web page to load in 2 seconds or less.
- 40% abandon a website that takes more than 3 seconds to load.
- 70% people spend time in loading their page more than 5 seconds.
With Lighthouse insights, you can avoid these issues and deliver an awesome end-user experience. It also gives the metrics on Core Web Vitals using which you can gain deep knowledge about the quality and performance of your web page.
#4 Performance Metrics
Lighthouse analyzes how quickly a website or app loads and how quickly users can access or view the content. Here, Lighthouse analyzes six speed metrics:
- First Contentful Paint: It is the time stamp when the browser first renders any text, images, non-white canvas or SVG. This excludes any content of iframes, but includes text with pending web fonts.

- First Meaningful Paint: It is the time taken for the primary content to load on the screen.
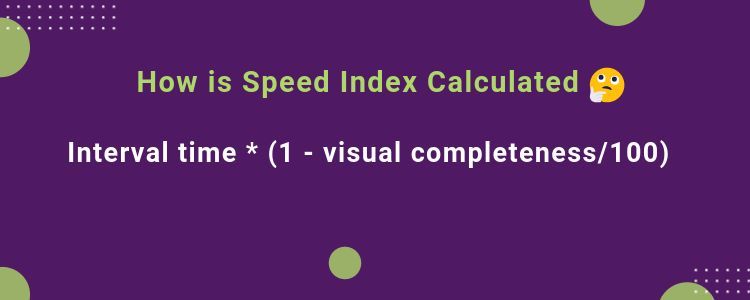
- Speed Index: This metric helps you in identifying how quickly the content in your page is visibly populated. It is the average time at which the visible parts are displayed. A score of <1000 is considered good.
- Time to Interactive: This is a non-standardized web performance 'progress' metric that measures how long it takes a page to become fully interactive.

- First CPU Idle: This metric measures how long it takes for a web page to become minimally interactive.
- Estimated Input Latency: This metric is measuring the amount of main thread activity from First meaningful paint until the end of page load. If the latency > 50ms, users may perceive an app or website to be too slow and the site owners need to take a look at it to fix the issue as soon as possible.
- Largest Contentful Paint: It is used to measure when the largest content element such as Heading text, hero image etc.. of the page has finished rendering on the screen.

Get Started With Lighthouse and Improve your Page Performance!!
Page experience has become the most important part in web application performance. With the Google Lighthouse audit report you can enhance the performance of your application and deliver the best for your customers. Customers expect a web page to load in 2 seconds or less if not they are less likely to visit the site again and move to your competitors. Make sure everything works perfectly, especially the page's interactiveness. Lighthouse provides various insights with which you will be able to make tangible improvements in your web page.
You can also monitor your front-end web application performance with Atatus. It is a simple, real-time effective and efficient monitoring tool which helps you in optimizing your application.
Sign up with Atatus!! No credit card required.
#1 Solution for Logs, Traces & Metrics
APM
Kubernetes
Logs
Synthetics
RUM
Serverless
Security
More


