Jaeger vs New Relic - Choosing Your Ideal Tool
If your application is as busy as a highway with multiple lanes, intersections, and exits, imagine trying to track the journey of a single car from start to finish. Sounds tricky, right? Well, that's what happens when you're dealing with modern, complex software systems.
Enter distributed tracing, your trusty GPS for navigating the intricate web of microservices and dependencies within your applications. It's like having a detailed map that shows you exactly how each component interacts and where potential bottlenecks might occur.
With distributed tracing, you can see how requests move across different databases, services, and external dependencies. This visibility is invaluable for understanding the performance of your application, identifying issues, and optimizing its efficiency.
Think of it as detective work for your code – ultimately solving the mystery of why your application might be slowing down or behaving unexpectedly.
Thus, bear in mind that distributed tracing is a vital tool for preserving the functionality and health of your software applications as we begin our comparison of Jaeger vs New Relic. It's not just about keeping things running smoothly; it's about empowering you to deliver the best possible experience for your users.
Now, let's explore how these two tools stack up in the world of monitoring and observability!
- Features of Jaeger
- Features of New Relic
- Metrics collection and visualization
- Alerting Capabilities
- Customization Options
- Pricing Models
- Integration with Other Monitoring Tools and Platforms
- Community Support and Ecosystem
- Key differences and similarities
- Why choose Atatus over Jaeger and Newrelic?
Features of Jaeger
-
Distributed Tracing: Jaeger offers complete distributed tracing capabilities. It allows you to track and visualize the flow of requests across complex microservices architectures and provides insights into the latency, errors, and dependencies within your system.
-
Open Source: Under the care of the Cloud Native Computing Foundation (CNCF), Jaeger is an open-source project. This means it's freely available for anyone to use and contribute to, fostering a vibrant community of developers and users.
-
Integration: Jaeger integrates with popular frameworks and platforms commonly used in modern application development, including Kubernetes, Docker, Istio, and more. This makes it easy to incorporate tracing into your existing infrastructure without significant overhead.
-
High Scalability: Jaeger is designed to handle large-scale distributed systems with ease. It supports high throughput and can scale horizontally to accommodate growing workloads, making it suitable for organizations of all sizes.
-
Rich Visualization: Jaeger provides intuitive visualization tools that allow you to explore and analyze trace data effectively. You can visualize the entire trace tree, drill down into individual spans, and easily identify performance bottlenecks or anomalies.
-
Sampling: Jaeger offers flexible sampling strategies to control the volume of trace data collected. You can adjust sampling rates dynamically based on various factors such as service, endpoint, or user-defined criteria, ensuring optimal resource utilization.
-
Context Propagation: Jaeger supports various propagation formats for distributing tracing context across different components of your system. This ensures the continuity and correlation of traces as requests traverse multiple services and layers.
-
Instrumentation Libraries: Popular programming languages are covered by Jaeger's libraries and SDKs, which make it simple to instrument your apps for tracing. These libraries offer integration with your codebase and require minimal configuration to get started.
-
Querying and Analysis: Jaeger offers powerful query and analysis capabilities, allowing you to search, filter, and aggregate trace data based on different criteria. You can perform ad-hoc queries, create custom dashboards, and extract valuable insights to optimize your system's performance.
-
Extensibility: Jaeger's modular architecture makes it highly extensible, allowing you to customize and extend its functionality to suit your specific requirements. Whether it's adding custom instrumentation, implementing new storage backends, or integrating with third-party tools, Jaeger provides the flexibility to adapt to your needs.
Features of New Relic
-
Application Performance Monitoring (APM): New Relic offers APM capabilities, allowing you to monitor the performance and behavior of your applications in real-time. It provides insights into response times, error rates, throughput, and resource utilization across different layers of your application stack.
-
Infrastructure Monitoring: You can keep an eye on the functionality and condition of your infrastructure, including servers, cloud environments, and containers, with New Relic. It offers visibility into key metrics such as CPU usage, memory consumption, disk I/O, and network traffic, helping you identify and troubleshoot issues proactively.
-
Browser Monitoring: With the browser monitoring features offered by New Relic, you can monitor and assess your web applications' performance from the viewpoint of the user. You can monitor page load times, JavaScript errors, and other metrics to optimize the user experience and ensure smooth operation across different browsers and devices.
-
Synthetic Monitoring: New Relic offers synthetic monitoring capabilities, allowing you to simulate user interactions and transactions within your applications. Scripted tests can be made to track the functionality, performance, and availability of an application from various geographical points. This will enable you to find and fix possible problems before they affect actual users.
-
Mobile Monitoring: You can keep tabs on the functionality and usage of your mobile applications with the help of New Relic's mobile monitoring tools. You can monitor app crashes, network requests, and user interactions across various devices and platforms, gaining valuable insights to optimize your mobile user experience.
-
Alerting and Notification: New Relic offers customizable alerting and notification features. You can set up alerts based on predefined thresholds or custom conditions. Ascertain that you are promptly informed of any possible problems or irregularities in your environment by making sure you have notifications sent to you by email, SMS, or integrations with major communication platforms.
-
Dashboards and Reporting: With the help of New Relic's user-friendly dashboards and reporting capabilities, you can efficiently see and examine your monitoring data. You can create custom dashboards, charts, and reports to track key metrics and KPIs, facilitating data-driven decision-making and performance optimization.
-
Integration Ecosystem: New Relic offers a rich ecosystem of integrations with third-party tools and services, allowing you to connect New Relic with your existing infrastructure and workflows. Whether it's integrating with CI/CD pipelines, collaboration platforms, or ticketing systems, New Relic provides flexible integration options to streamline your monitoring and operations processes.
-
Scalability and Reliability: New Relic is designed to scale with your business needs, easily supporting large-scale deployments and high-volume workloads. With its strong infrastructure and dependability features—such as data redundancy, high availability, and disaster recovery capabilities—it guarantees continuous monitoring and observability throughout your environment.
-
AI and Machine Learning: In order to offer anomaly detection and prediction insights, New Relic integrates AI and machine learning technology. In your monitoring data, it can spot patterns, trends, and anomalies, assisting you in foreseeing and resolving such problems before they have an influence on your company's operations.
Metrics collection and visualization
In Jaeger, the primary focus of metrics collection revolves around tracing and performance metrics specific to distributed tracing and spans. While it offers some metrics collection capabilities, its scope is more limited compared to New Relic. Jaeger integrates with monitoring systems such as Prometheus to expand its metrics collection capabilities, allowing users to gather additional metrics beyond tracing data. However, the visualization tools in Jaeger are relatively basic, primarily focused on visualizing trace data and distributed tracing. Customization options for visualization are also limited in Jaeger compared to New Relic.
New Relic provides complete metrics collection capabilities covering various aspects of application performance, infrastructure health, user experience, and more. It offers built-in monitoring features with extensive support for metrics visualization, including dashboards, charts, and reports. New Relic's visualization tools are robust and user-friendly, allowing users to create custom dashboards and charts tailored to their specific monitoring needs. Additionally, New Relic includes built-in alerting and notification features, enabling users to set up alerts based on predefined thresholds and receive notifications via various channels.
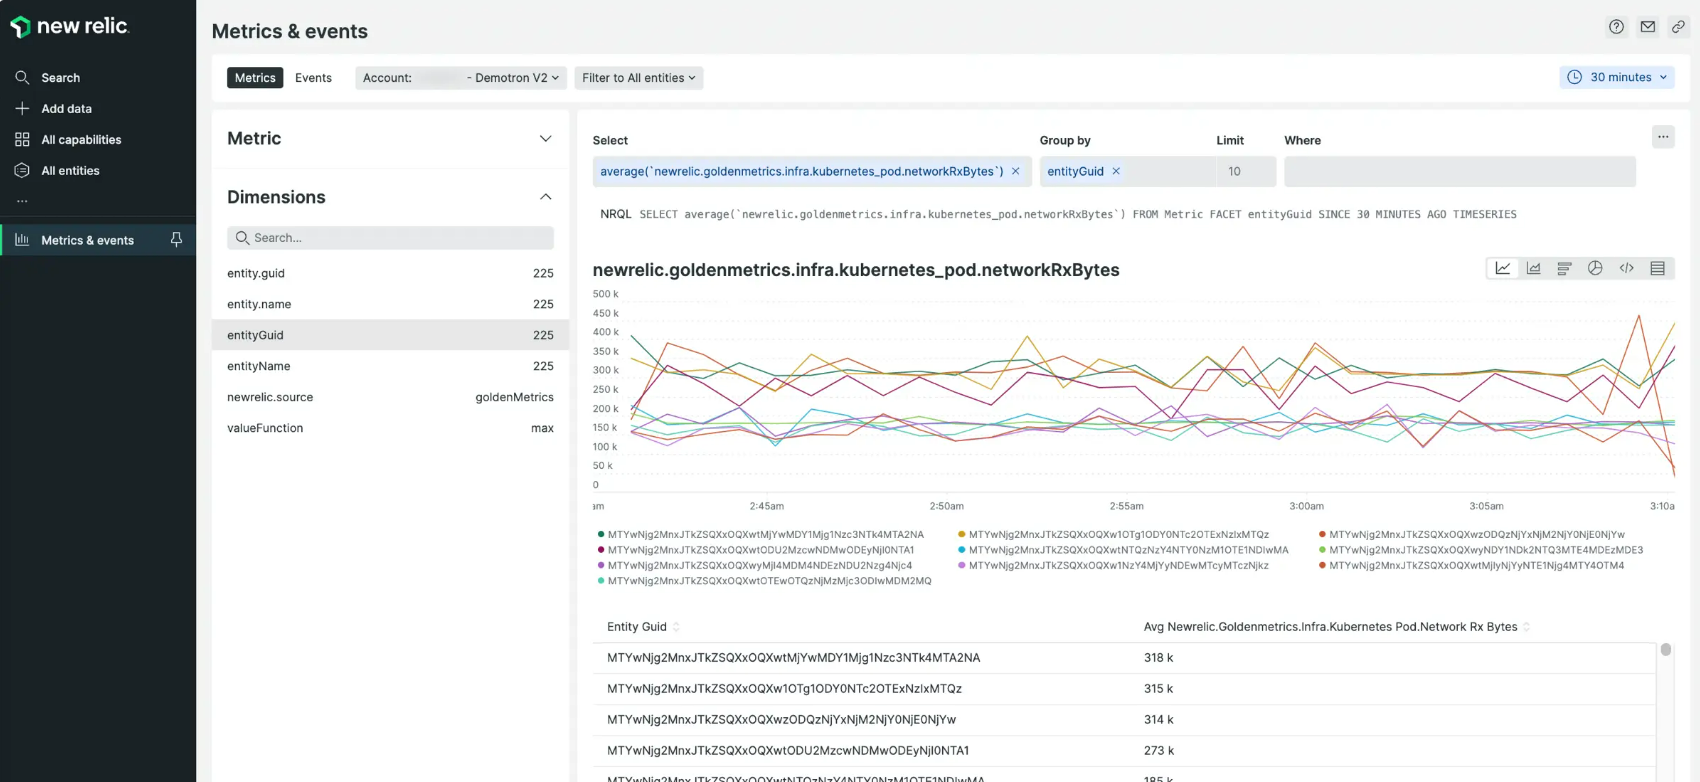
New Relic offers a more comprehensive and integrated solution for metrics collection and visualization than Jaeger.
Alerting Capabilities
Jaeger's alerting capabilities are more limited than those of New Relic. While Jaeger provides basic alerting functionality, it primarily focuses on tracing-specific metrics and may require additional tools or integrations for comprehensive alerting. Within the distributed tracing context, users can configure alerts based on predetermined thresholds for metrics like latency, error rates, or throughput. However, customization options for alerting are relatively constrained, and the flexibility to tailor alerts to specific use cases or environments is limited.
New Relic offers robust alerting capabilities as part of its integrated observability platform. A vast array of indicators, such as application performance, infrastructure health, user experience, and more, can be used by users to produce alerts. New Relic provides customizable alert thresholds, allowing users to define specific conditions that trigger alerts, such as response time exceeding a certain threshold or error rate exceeding a defined percentage. Additionally, New Relic offers flexible notification options, enabling users to receive alerts via email, SMS, or integration with communication platforms like Slack or PagerDuty. The platform also supports escalation policies and downtime scheduling, ensuring timely and efficient alert management.
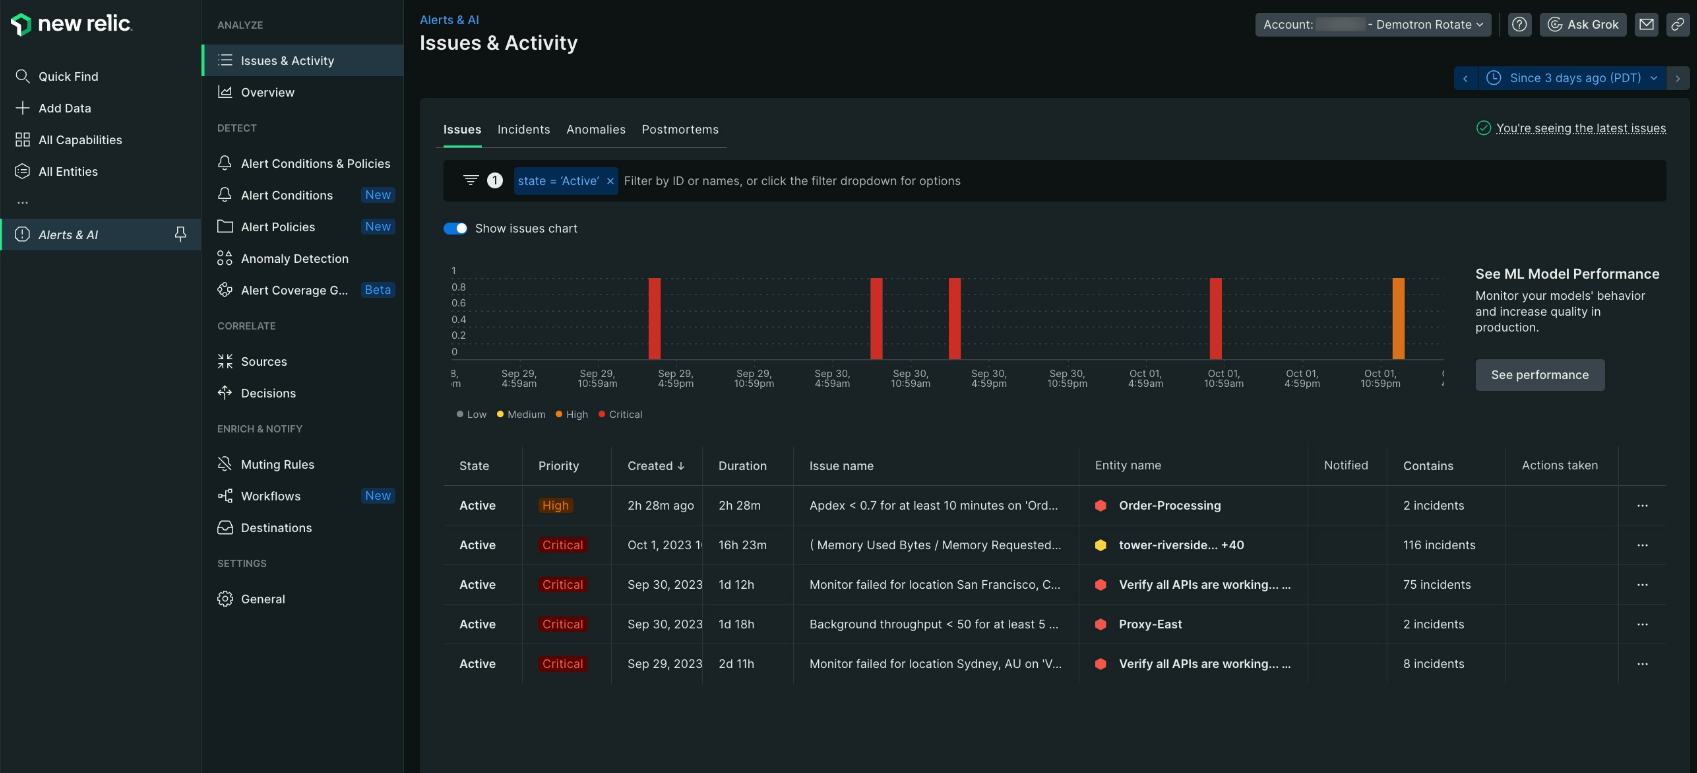
While Jaeger offers basic alerting functionality within the context of distributed tracing, New Relic provides more robust alerting capabilities as part of its integrated observability platform.
Customization Options
Jaeger's customization options for alerting are relatively limited compared to New Relic. Users can configure basic alerting rules based on predefined metrics and thresholds within the distributed tracing context. While Jaeger offers some flexibility in setting up alerts, customization options may be constrained, and you can rely on external tools or integrations for more advanced alerting requirements.
New Relic provides extensive customization options for alerting, allowing users to tailor alerts to specific use cases, environments, and business requirements. Users can define custom alert thresholds, configure complex alert conditions using NRQL (New Relic Query Language), and create alert policies tailored to different teams or applications. Additionally, New Relic offers integrations with third-party tools and services, enabling users to extend alerting capabilities and integrate with existing workflows. With New Relic, users have the flexibility to design and manage alerts according to their unique monitoring needs, ensuring proactive and efficient incident response.
New Relic offers extensive customization options, flexible notification channels, and integration with third-party tools, making it a comprehensive solution for alerting and incident management.
Pricing Models
Jaeger is an open-source project maintained by the Cloud Native Computing Foundation (CNCF), which means it is freely available for anyone to use. As an open-source solution, Jaeger does not have a direct pricing model, and there are no licensing fees associated with its usage. However, organizations implementing Jaeger may incur costs related to infrastructure, maintenance, and support, depending on their specific deployment requirements. These costs may include expenses for hosting Jaeger components, managing storage for trace data, and providing resources for ongoing maintenance and support.
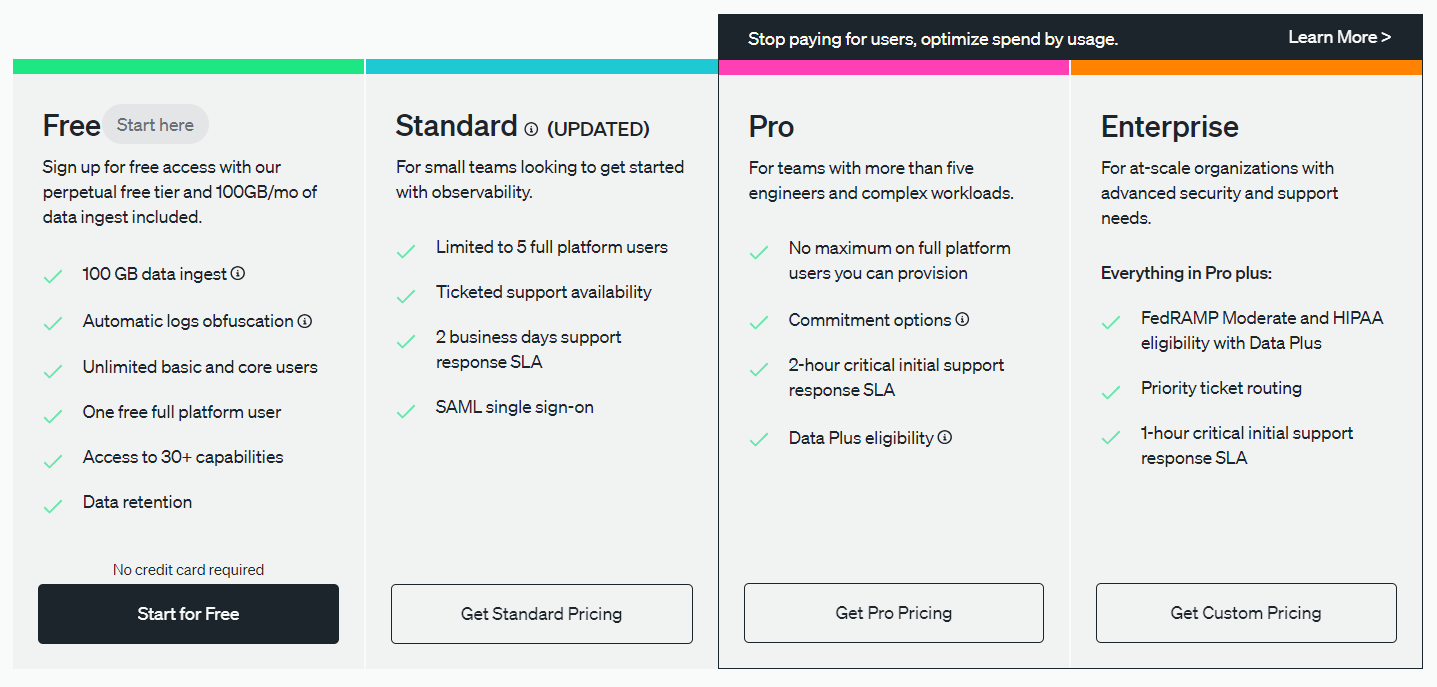
New Relic offers a subscription-based pricing model for its observability platform, which includes monitoring, troubleshooting, and optimization capabilities for applications, infrastructure, and the user experience. New Relic's pricing is typically based on factors such as the number of monitored hosts, user licenses, and the level of support required. It may vary based on the features and functionality included in each subscription plan, with options for small businesses, midsize enterprises, and large organizations. Customers can select the subscription plan from New Relic that best suits their requirements and budget thanks to its numerous pricing options. Additionally, New Relic provides a free tier with limited features for users to explore and evaluate the platform before paying.
Jaeger is an open-source project with no direct licensing costs, while New Relic operates on a subscription-based pricing model, offering various subscription plans tailored to different organizational requirements and budgets. While Jaeger may need organizations to pay for infrastructure and maintenance expenses, New Relic offers a complete observability solution with flexible price choices to suit various business requirements.
Integration with Other Monitoring Tools and Platforms
Jaeger provides integration capabilities with a variety of other monitoring tools and platforms commonly used in modern software development and operations environments. It supports integration with metrics and logging systems such as Prometheus, Grafana, Elasticsearch, and Fluentd, allowing users to leverage these tools alongside Jaeger for comprehensive observability. Jaeger's modular architecture and support for open standards like OpenTracing enable integration with third-party monitoring solutions, enabling users to customize and extend their observability stack according to their specific requirements.
New Relic offers a unified observability platform that includes monitoring, troubleshooting, and optimization capabilities for applications, infrastructure, and the user experience. While New Relic provides monitoring features out-of-the-box, it also offers integration capabilities with other monitoring tools and platforms to support hybrid or multi-cloud environments. New Relic provides integrations with popular DevOps and collaboration tools such as Slack, PagerDuty, Jira, and AWS CloudWatch, allowing users to streamline workflows and automate incident response. Additionally, New Relic offers APIs and SDKs for custom integrations, enabling users to integrate New Relic data with their existing monitoring stack or build custom applications on top of the New Relic platform.
Both Jaeger and New Relic offer integration capabilities with other monitoring tools and platforms, enabling you to take advantage of a broader ecosystem of observability solutions. Jaeger's open-source nature and support for open standards facilitate seamless integration with third-party monitoring tools, while New Relic provides a unified observability platform with built-in integrations and APIs for extending and customizing the platform according to specific requirements. Organizations evaluating integration options should consider factors such as compatibility, flexibility, and ease of implementation when choosing between Jaeger and New Relic.
Community Support and Ecosystem
Jaeger benefits from a vibrant and active open-source community supported by the Cloud Native Computing Foundation (CNCF). The community around Jaeger is diverse and includes developers, users, contributors, and enthusiasts passionate about observability and distributed tracing. Jaeger's open-source nature fosters collaboration, innovation, and knowledge-sharing within the community, leading to the development of new features, enhancements, and integrations. The Jaeger community is accessible through various channels, including mailing lists, forums, GitHub repositories, and community-driven events such as meetups and conferences. Additionally, Jaeger's adoption as a standard for distributed tracing in cloud-native environments has contributed to the growth of its ecosystem, with integrations, plugins, and extensions developed by both community members and third-party vendors to enhance its functionality and interoperability.
New Relic has built a robust ecosystem around its observability platform, supported by a combination of community engagement, partnerships, and developer advocacy initiatives. While New Relic is a commercial product, it maintains an active community presence through forums, user groups, and online communities where users can connect, share knowledge, and seek support from peers and experts. New Relic also collaborates with technology partners, cloud providers, and industry organizations to expand its ecosystem and integrate with complementary tools and services. Through its partnership program and marketplace, New Relic offers integrations, plugins, and extensions developed by third-party vendors to extend the platform's functionality and address specific use cases across diverse industries and domains.
Both Jaeger and New Relic benefit from strong community support and ecosystems that contribute to their growth, adoption, and innovation in the field of observability. Jaeger's open-source nature and support from the CNCF foster collaboration and contributions from a diverse community of developers and users, while New Relic's commercial offering and partnerships enable it to offer a comprehensive observability platform with a wide range of integrations and ecosystem offerings. Organizations evaluating observability solutions should consider factors such as community engagement, ecosystem support, and alignment with their specific requirements when choosing between Jaeger and New Relic.
Key differences and similarities
A summary of the key differences and similarities between Jaeger and New Relic:
| Aspect | Jaeger | New Relic |
|---|---|---|
| Licensing Model | Open-source; no direct licensing costs | Subscription-based pricing model |
| Primary Focus | Distributed tracing and observability | Comprehensive observability platform |
| Deployment Model | Self-hosted or cloud-based deployments | SaaS vendor deployment |
| Alerting Capabilities | Basic alerting; limited customization | Robust alerting with extensive customization |
| Metrics Collection | Limited focus on tracing metrics | Comprehensive metrics collection and monitoring |
| Visualization | Basic visualization tools for tracing data | Robust visualization capabilities |
| Integration | Integration with Prometheus and other monitoring systems | Integration with third-party tools and services |
| Community Support | Vibrant open-source community | Active user community and partnerships |
| Scalability | High scalability with horizontal scaling | Scalable architecture for large-scale deployments |
| Customization | Customizable but may require additional development | Extensive customization options and APIs |
Jaeger or New Relic?
When it comes to choosing between New Relic and Jaeger, New Relic often emerges as the preferred option. Its comprehensive observability platform, featuring a wide array of monitoring capabilities spanning application performance, infrastructure health, and user experience, offers a holistic solution for organizations. While Jaeger excels in distributed tracing, New Relic's versatility, comprehensive feature set, and scalability often position it as the better option for organizations seeking an observability solution that effectively addresses their diverse monitoring needs.
Why choose Atatus over Jaeger and Newrelic?
Atatus stands out as a top choice over Jaeger and Newrelic, offering a Full Stack Observability Platform that lets you review problems as if they happened in your application. Instead of guessing why errors happen or asking users for screenshots and log dumps, Atatus lets you replay the session to quickly understand what went wrong.
We offer Application Performance Monitoring, Real User Monitoring, Server Monitoring, Logs Monitoring, Synthetic Monitoring, Uptime Monitoring, and API Analytics. It works perfectly with any application, regardless of framework, and has plugins.
Atatus can be beneficial to your business because it provides a comprehensive view of your application, including how it works, where performance bottlenecks exist, which users are most impacted, and which errors break your code for your frontend, backend, and infrastructure.
Atatus offers competitive pricing plans, ensuring cost-effectiveness without compromising on quality.
Atatus API Monitoring and Observability
Atatus provides Powerful API Observability to help you debug and prevent API issues. It monitors the consumer experience and is notified when abnormalities or issues arise. You can deeply understand who is using your APIs, how they are used, and the payloads they are sending.
Atatus's user-centric API observability tracks how your actual customers experience your APIs and applications. Customers may easily get metrics on their quota usage, SLAs, and more.
It monitors the functionality, availability, and performance data of your internal, external, and third-party APIs to see how your actual users interact with the API in your application. It also validates rest APIs and keeps track of metrics like latency, response time, and other performance indicators to ensure your application runs smoothly.
#1 Solution for Logs, Traces & Metrics
![]() APM
APM
![]() Kubernetes
Kubernetes
![]() Logs
Logs
![]() Synthetics
Synthetics
![]() RUM
RUM
![]() Serverless
Serverless
![]() Security
Security
![]() More
More


![New Relic vs Splunk - In-depth Comparison [2025]](/blog/content/images/size/w960/2024/10/Datadog-vs-sentry--19-.png)
![New Relic vs Sentry - Which Monitoring Tool to Choose? [2025]](/blog/content/images/size/w960/2024/10/VS--1-.png)