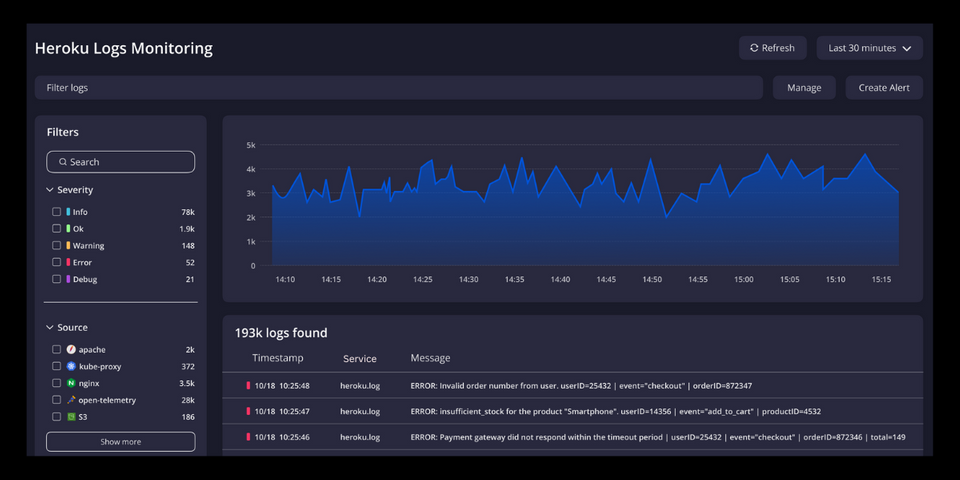
The Ultimate Guide to Heroku Logs Monitoring
Effective application monitoring is essential for developers, and Heroku, a popular Platform-as-a-Service (PaaS), provides a solid platform for deploying apps. However, monitoring logs is often an overlooked aspect of maintaining applications on Heroku.
Heroku logs provide valuable information to help find bottlenecks, fix issues, and improve application performance. In this guide, we will explore everything you need to know about Heroku logs, why monitoring them is essential, and how to set up efficient log monitoring practices.
Table of Contents:
- What are Heroku logs?
- Why monitor Heroku logs?
- How to access Heroku logs?
- Setting up Heroku log monitoring
- Best practices for Heroku log monitoring
What are Heroku logs?
Heroku logs are records that capture runtime events from the Heroku platform and your application. These events include:
- App Logs: Messages generated by your application, such as
console.logorstdoutoutput. - System Logs: Messages from Heroku about events like app crashes or deployment updates.
- API Logs: Messages related to the Heroku platform API, like scaling or restarting a dyno.
These logs are crucial for diagnosing errors, analysing app performance, and keeping track of deployment history.
Why monitor Heroku logs?
Monitoring Heroku logs provides key benefits:
- Error detection: Identify runtime errors or crashes before they escalate into downtime.
- Performance insights: Track application latency, request rates, and response times to optimize performance.
- Security monitoring: Detect unauthorized access or unusual activity in real-time.
- Audit and compliance: Maintain a detailed record of system activity for compliance purposes.
- Debugging: Quickly trace issues to their root causes by reviewing application and system logs.
How to access Heroku logs?
Heroku logs can be accessed via:
- Heroku CLI
Use theheroku logscommand to view recent logs directly in your terminal.
heroku logs --tail
- Dashboard
Access logs through the Heroku web interface under the “More” dropdown of your app. - Log Drains
Forward logs to external services for long-term storage and advanced monitoring.
Setting up Heroku log monitoring
1. Enable log drains
Log drains allow you to forward logs to third-party services for processing and analysis. Popular services include:
- Atatus
- Datadog
- LogDNA
- Papertrail
To set up a log drain:
- Choose a third-party logging service.
- Add the log drain URL to your app:
heroku drains:add [LOG_DRAIN_URL]
# For Atatus Logs
heroku drains:add "https://intake-logs.atatus.com/ingest/v1/logs?api_key=<ATATUS_API_KEY>&service=<SERVICE>&source=<SOURCE>" -a <HEROKU_APP_NAME>
2. Use a log management tool
Log management tools allow you to aggregate, analyse, and visualize logs in real-time. These tools often offer:
- Search and filtering: Quickly locate relevant logs.
- Alerts: Get notified about anomalies or errors.
- Dashboards: Monitor key metrics at a glance.
3. Implement structured logging
Structured logging outputs logs in a machine-readable format like JSON. This makes it easier to query and analyse logs in log management tools. For example:
{
  "timestamp": "2024-12-19T10:00:00Z",
  "level": "error",
  "message": "Database connection failed",
  "context": {
    "userId": "12345",
    "error": "Connection timeout"
  }
}
4. Set up alerts
Configure alerts for critical events, such as:
- High error rates
- Dyno restarts
- Memory or CPU spikes
Many tools like Atatus, Datadog, or Papertrail can notify you via email, Slack, or MS Teams when thresholds are breached.
5. Retain historical logs
By default, Heroku retains logs for only a short period. To analyse historical trends or troubleshoot past incidents, you must export logs to external storage like AWS S3 or a logging service.
Best practices for Heroku log monitoring
- Eliminate unnecessary logs: Avoid log overload by filtering out non-critical logs from your application.
- Log at the right levels: Use appropriate log levels (
DEBUG,INFO,WARN,ERROR) to prioritize key messages. - Monitor in real-time: Use tools to view logs as they are generated to catch issues early.
- Protect sensitive data: Avoid logging sensitive information like user passwords or API keys.
- Regularly review logs: Make it a habit to review logs periodically for anomalies or opportunities for optimization.
Conclusion
Heroku logs are more than just lines of text, they are a valuable resource for tracking and improving your application's performance.
By monitoring logs effectively and using log management tools, you can identify issues, optimize performance, and enhance your app's reliability and security.
Regular log analysis helps uncover bottlenecks, debug errors, and gain insights into user behaviour, making it an essential practice for maintaining a high quality application.
#1 Solution for Logs, Traces & Metrics
APM
Kubernetes
Logs
Synthetics
RUM
Serverless
Security
More


