Grok Parser in Go: A Detailed Guide for Log Parsing
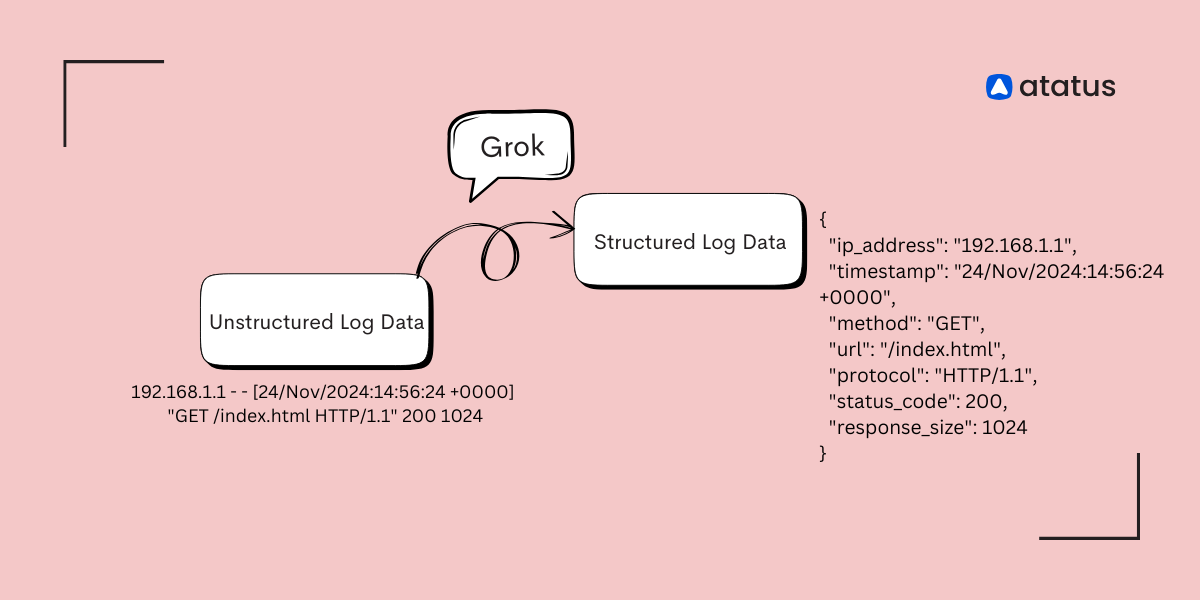
Logs play a vital role in understanding how applications and systems perform, but unstructured log data can be hard to analyse. The Grok parser helps by converting raw logs into structured, readable formats. It is widely used for extracting information such as timestamps, error codes, and IP addresses from logs, making them easier to analyse and query.
In this blog, lets understand how Grok works, why it is especially useful for Go developers, and how Atatus integrates Grok parsing to provide powerful centralized log monitoring. From basic concepts to practical implementation, this guide will help you know the potential of Grok in Go.
Lets get started!
In this blog post:
- What is Grok?
- What is a Grok Pattern?
- Why do we use Grok in Go?
- Key Concepts Behind Grok Parsing
- How Grok Parsing Works in Go?
- Performance Considerations
- Extending Grok Patterns in Go
- Common Grok Patterns
- How Atatus uses Grok Parser for Log Parsing?
What is Grok?
Grok is a pattern matching and extraction tool that allows you to parse unstructured log data into structured data. It is essentially a collection of regular expressions that match common log formats.
Originally used in Logstash, Grok enables developers to extract useful fields from logs like timestamps, error codes, IP addresses, and more, using predefined patterns or custom regular expressions.
What is a Grok Pattern?
A Grok Pattern is a predefined regular expression that simplifies the process of parsing and extracting fields from log data. It consists of predefined tokens, or regular expression shortcuts, that match common log components like IP addresses, dates, HTTP methods, and more.
Grok patterns are written in a specific format that helps match and extract data from unstructured logs. These patterns can be used for standard log formats (like Apache or NGINX logs) with built-in regular expressions.
You can also customize them by adjusting or creating new patterns to handle unique log formats, making Grok flexible for different types of log data.
Why do we use Grok in Go?
Log parsing is a common task when working with logs in distributed systems. Grok is preferred because:
- It simplifies complex regular expressions.
- It provides a rich set of predefined patterns.
- It is easy to use and extend with custom patterns.
Key Concepts Behind Grok Parsing
Patterns: Grok works by using patterns. Each pattern represents a specific piece of data in a log line. Examples include %{IP} to match an IP address, %{TIME} to match a time format, or %{NUMBER} to match numeric values. Patterns can be combined to match more complex structures.
Pattern Matching: Grok uses regular expressions behind the scenes, but abstracts them in a way that makes them easier to read and use. It’s highly efficient and can parse large log files quickly.
Named Captures: Grok patterns usually provide named captures for easy access to extracted values. For example, a log pattern might extract the timestamp, log level, and message into different fields, making it easier to query the structured log data.
How Grok Parsing Works in Go?
To use Grok in Go, you will rely on external libraries that implement Grok parsing, with the most common one being github.com/grokify/grok.
Let’s walk through the steps to implement a Grok parser in Go.
(i). Installing Grok Parser in Go
The first step is to install the Grok library. The Go library for Grok can be installed via go get:
go get github.com/grokify/grok
(ii). Define Your Grok Pattern
Before parsing logs, you need to define the Grok pattern that matches the structure of the log message you're dealing with.
A simple example of a log pattern:
%{IPV4:ip} - - \[%{HTTPDATE:timestamp}\] "%{WORD:method} %{URIPATH:request} HTTP/%{NUMBER:http_version}" %{NUMBER:status} %{NUMBER:bytes}
This pattern matches common Apache log formats. It extracts:
ip: The IP address of the client.timestamp: The timestamp of the request.method: The HTTP method (e.g., GET, POST).request: The requested URI.http_version: The HTTP version used.status: The HTTP response code.bytes: The number of bytes sent in the response.
(iii). Implementing the Grok Parser in Go
Here's an example of a Go program that uses the grokify library to parse logs using the above pattern:
package main

import (
    "fmt"
    "log"

    "github.com/grokify/grok"
)

func main() {
    // Define the Grok pattern
    pattern := `%{IPV4:ip} - - \[%{HTTPDATE:timestamp}\] "%{WORD:method} %{URIPATH:request} HTTP/%{NUMBER:http_version}" %{NUMBER:status} %{NUMBER:bytes}`

    // Sample log line to parse
    logLine := `192.168.1.1 - - [21/Nov/2024:14:20:00 +0000] "GET /home HTTP/1.1" 200 1024`

    // Create a new Grok object
    g, err := grok.NewWithPatterns(nil)
    if err != nil {
        log.Fatalf("Error initializing Grok: %v", err)
    }

    // Parse the log line using the Grok pattern
    match, err := g.Parse(pattern, logLine)
    if err != nil {
        log.Fatalf("Error parsing log line: %v", err)
    }

    // Display the matched result
    for key, value := range match {
        fmt.Printf("%s: %s\n", key, value)
    }
}
- Grok pattern: The Grok pattern we use matches the log structure and breaks it into named fields.
- grok.NewWithPatterns: This creates a new Grok object with the provided pattern.
- g.Parse: This parses the log line according to the pattern. The result is a map where the keys are the field names (like
ip,timestamp, etc.), and the values are the corresponding values from the log line.
(iv). Output of the Program
Running this Go program will output:
ip: 192.168.1.1
timestamp: 21/Nov/2024:14:20:00 +0000
method: GET
request: /home
http_version: 1.1
status: 200
bytes: 1024
(v). Handling Multiple Patterns
When you are parsing complex logs, it’s common to work with multiple patterns. Grok allows you to load multiple patterns and combine them for more comprehensive parsing.
Here’s how you can load custom patterns:
patterns := map[string]string{
    "MYCUSTOMPATTERN": `%{IPV4:ip} - - \[%{HTTPDATE:timestamp}\] "%{WORD:method} %{URIPATH:request} HTTP/%{NUMBER:http_version}" %{NUMBER:status} %{NUMBER:bytes}`,
}

g, err := grok.NewWithPatterns(patterns)
This way, you can define and reuse patterns across different log files.
Performance Considerations
Grok parsing uses regular expressions, which can be expensive in terms of CPU usage. To ensure that your Go program performs well when dealing with large log files:
- Precompile patterns: When possible, precompile regular expressions to avoid compiling them multiple times.
- Efficient Logging: Use efficient log management systems to aggregate and analyse logs rather than performing Grok parsing at scale directly in your Go application.
Extending Grok Patterns in Go
In some cases, the predefined Grok patterns may not be sufficient for your specific log format. You can extend Grok patterns by defining custom regular expressions. Here's an example of defining a custom pattern:
patterns := map[string]string{
    "MYIP":   `(\d{1,3}\.){3}\d{1,3}`,
    "MYDATE": `\d{2}/\w{3}/\d{4}`,
}
g, err := grok.NewWithPatterns(patterns)
This allows you to create patterns for specific formats that are not covered by standard Grok.
Common Grok Patterns
Grok provides a rich set of predefined patterns that you can use to match common log formats. Below is a list of some commonly used Grok patterns:
General Patterns
%{GREEDYDATA}: Matches any text (useful for capturing the entire message).%{DATA}: Matches any sequence of characters (except for whitespace).%{WORD}: Matches a single word or non-whitespace string.%{NUMBER}: Matches any number (integer or floating-point).%{BASE10NUM}: Matches a base-10 number.%{IP}: Matches any valid IP address (IPv4 or IPv6).%{IPV4}: Matches an IPv4 address.%{IPV6}: Matches an IPv6 address.%{MAC}: Matches a MAC address.

Date and Time Patterns
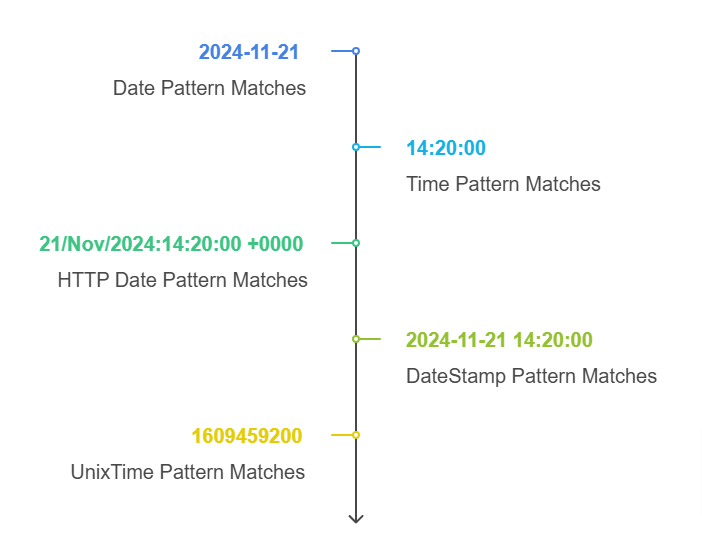
%{DATE}: Matches a date (e.g.,2024-11-21).%{TIME}: Matches a time (e.g.,14:20:00).%{HTTPDATE}: Matches HTTP date format (e.g.,21/Nov/2024:14:20:00 +0000).%{DATESTAMP}: Matches a full timestamp format (2024-11-21 14:20:00).%{UNIXTIME}: Matches a Unix timestamp (e.g.,1609459200).

Log and HTTP Specific Patterns
%{LOGLEVEL}: Matches a log level (e.g.,ERROR,INFO,DEBUG).%{HTTPSTATUS}: Matches an HTTP status code (e.g.,404,200).%{URIPATH}: Matches a URI path (e.g.,/home/index.html).%{URI}: Matches a full URI (e.g.,http://example.com/path).
How Atatus uses Grok Parser for Log Parsing?
Atatus, an observability and monitoring platform, integrates various tools and techniques to provide real-time insights into system performance and application logs.
One of the key features of Atatus is its centralized log monitoring, which aggregates logs from different services, applications, and servers into a unified platform for easy analysis and troubleshooting.
1. Grok Parser for Log Parsing in Atatus
Atatus uses the power of Grok parser to process and parse log files from various sources. Grok helps Atatus to break down complex, unstructured logs into structured data that can be easily queried and analysed. The Grok parser is instrumental in helping Atatus to identify and extract useful information from logs such as:
- Timestamps: Knowing when an event occurred.
- Error Codes: Identifying HTTP error responses, application errors, etc.
- Request Details: Extracting method types, response status codes, IP addresses, and URLs.
- User Information: Extracting usernames or other identifiers to understand which user is affected by a particular log entry.
2. Pattern Matching with Grok
By using predefined and custom Grok patterns, Atatus can efficiently match patterns in logs, which are crucial for creating structured records that can be visualized and analysed.
For instance, logs generated by web servers (like Apache or Nginx) or applications often contain valuable information such as request method, request path, response status, and processing time. Grok’s powerful pattern matching allows Atatus to extract this information in a readable and accessible format.
Once the logs are parsed, Atatus can index them based on different log levels (INFO, WARN, ERROR), timestamps, or even specific fields like request URLs or IP addresses, making it much easier to troubleshoot issues by narrowing down search queries to specific events.
Conclusion
The integration of Grok parsing into Atatus centralized log monitoring system plays a pivotal role in simplifying the log analysis process. By transforming raw, unstructured log data into structured, searchable records, Atatus enables developers and operations teams to gain deeper insights into system behaviour.
The ability to efficiently search, analyse, and visualize logs combined with powerful alerting capabilities ensures that potential problems are identified early, helping teams to reduce downtime and improve overall application performance.
With Grok patterns, Atatus makes log parsing more efficient and intuitive, enabling users to focus on what matters most: delivering reliable, high-performance applications.
#1 Solution for Logs, Traces & Metrics
APM
Kubernetes
Logs
Synthetics
RUM
Serverless
Security
More


![New Relic vs Splunk - In-depth Comparison [2025]](/blog/content/images/size/w960/2024/10/Datadog-vs-sentry--19-.png)
