ELK vs New Relic: Which Monitoring Tool Should You Choose in 2025?

Effective observability is crucial for maintaining system performance and reliability. ELK Stack and New Relic are two widely used solutions that offer distinct approaches to monitoring, tracing, and logging.
This comparison will help you understand their core features, use cases, and strengths, enabling you to make a more informed decision on which tool best aligns with your organizational goals.
Lets get started!
Table of Contents:
- What are ELK and New Relic?
- New Relic vs ELK Stack: Key Considerations
- Deployment and Maintenance: New Relic
- Metrics Monitoring: New Relic
- Log Management: ELK
- Distributed Tracing: New Relic
- Visualization & Dashboards: ELK
- Use Cases: When to Choose ELK Stack or New Relic?
- Advantages of using Atatus over ELK Stack and New Relic
What are ELK and New Relic?
ELK Stack is a collection of three tools, Elasticsearch, Logstash, and Kibana. They work together to provide a powerful logging and analytics platform. Elasticsearch is the search and analytics engine, Logstash handles data processing and ingestion, and Kibana offers visualization and dashboarding capabilities. ELK is commonly used for centralized log management and search-driven analytics.
New Relic, on the other hand, is a full-stack observability platform that provides real-time monitoring for applications, infrastructure, logs, and distributed tracing. It offers built-in instrumentation, AI-driven insights, and cloud-native observability, making it a robust choice for performance monitoring and troubleshooting.
Key differences between ELK and New Relic:
Purpose:
- ELK Stack is primarily designed for log management, indexing, and search-based analytics.
- New Relic is a full observability platform that provides deep insights into applications, infrastructure, and logs.
Scope:
- ELK Stack mainly focuses on log processing and visualization, though it can be extended to support other telemetry data.
- New Relic covers metrics, traces, logs, and APM (Application Performance Monitoring) in a single platform.
New Relic vs ELK Stack: Key Considerations
| Feature | New Relic | ELK Stack |
|---|---|---|
| Purpose | Full-stack observability (APM, logs, metrics, and traces) | Log management and analytics |
| Data Coverage | Metrics, traces, logs, and APM in one platform | Primarily logs, can extend to metrics and traces |
| Deployment | Fully managed (SaaS) | Self-hosted or cloud-hosted (requires setup) |
| Scalability | Auto-scales with cloud infrastructure | Requires manual scaling and resource allocation |
| Ease of Use | Minimal setup, out-of-the-box insights | Requires configuration and management |
| Cost Model | Pay-as-you-go with a free tier | Open-source, but infrastructure and maintenance add costs |
| Visualization & Insights | AI-driven dashboards, automated anomaly detection | Kibana provides customizable dashboards but lacks AI insights |
| Best For | Teams needing full observability with minimal management | Organizations needing an open-source log management solution |
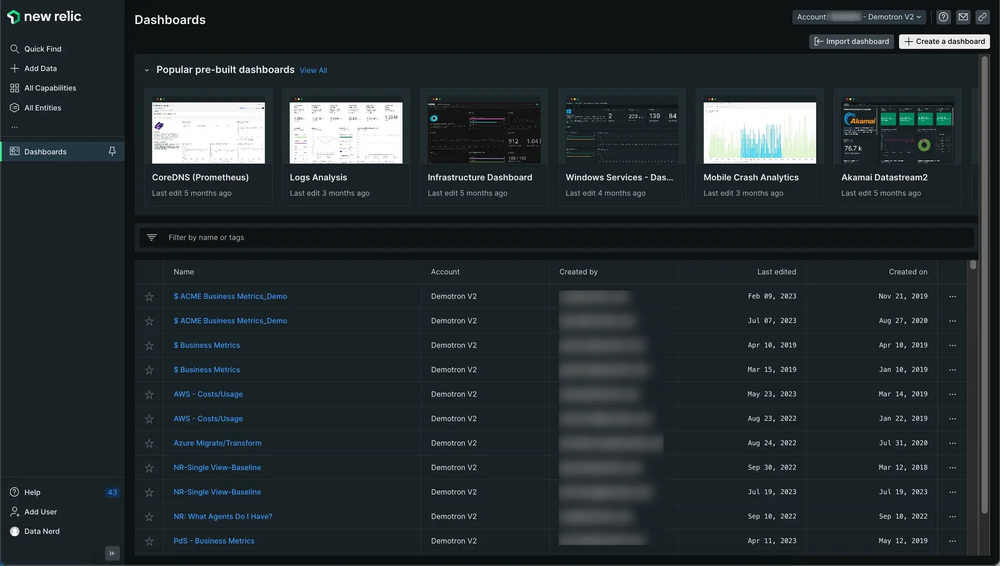
Deployment and Maintenance: New Relic
ELK Stack requires self-hosting and manual setup, involving configuration of each component and ongoing maintenance. Users are responsible for infrastructure management, scaling, and updates.
New Relic provides a fully managed, cloud-based solution, eliminating the need for infrastructure management. Users can quickly set up monitoring with minimal configuration and benefit from automatic updates.
ELK vs New Relic: New Relic is easier to use with automatic updates and no infrastructure management. ELK Stack gives more control but requires manual setup and ongoing maintenance.
Metrics Monitoring: New Relic
ELK Stack was not originally designed for metrics monitoring but can be extended with Metricbeat to collect system and application performance metrics. However, this requires additional setup, making it less convenient.
On the other hand, New Relic provides built-in real-time metrics monitoring for applications, cloud infrastructure, and user experience. It includes pre-configured dashboards, AI-powered insights, and automatic alerting, allowing teams to detect performance bottlenecks faster.
ELK vs New Relic: New Relic offers built-in, real-time metrics monitoring with easy setup and AI insights. ELK Stack requires extra setup for metrics, making it less convenient.
Log Management: ELK
ELK Stack is purpose-built for log collection, indexing, and analysis. It consists of Logstash for data ingestion, Elasticsearch for indexing and searching, and Kibana for visualization. It excels at handling structured and unstructured logs, providing advanced querying capabilities and real-time log analysis.
New Relic offers log management as part of a broader observability suite. Logs in New Relic are automatically correlated with metrics and traces, reducing the manual effort required for debugging. Additionally, New Relic’s AI-powered anomaly detection enhances troubleshooting, whereas ELK requires users to manually analyse log patterns.
ELK vs New Relic: ELK Stack is designed for log collection and analysis with advanced querying, but requires manual setup. New Relic offers integrated log management, automatically correlating logs with metrics and using AI for anomaly detection.
Distributed Tracing: New Relic
ELK Stack supports tracing via OpenTelemetry and Jaeger, but it requires separate configurations to work efficiently. Custom integrations are necessary to correlate traces with logs and metrics, which can be complex to set up.
New Relic, however, has built-in distributed tracing with automatic instrumentation, allowing seamless tracking of requests across different services. With its AI-driven anomaly detection and automatic correlation of traces with logs and metrics, New Relic provides a more integrated and effortless tracing experience compared to ELK.
ELK vs New Relic: ELK Stack needs extra setup for tracing and custom integrations. New Relic provides easy, built-in distributed tracing with automatic correlation of logs and metrics.
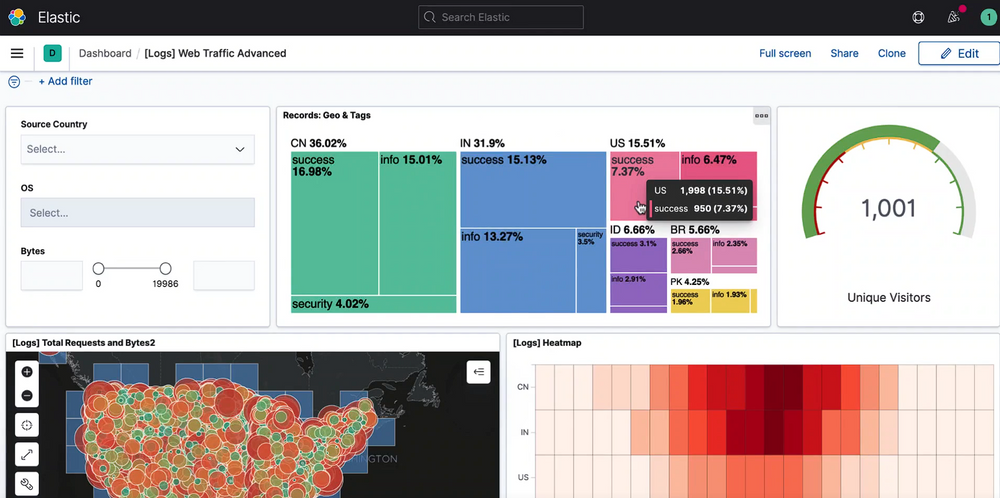
Visualization & Dashboards: ELK
ELK Stack uses Kibana, which provides powerful log and metric visualization. Users can create custom dashboards, apply query-based filtering, and perform real-time data exploration. However, Kibana dashboards require manual setup and configuration.
New Relic provides pre-built dashboards with automatic updates based on collected data. It also includes AI-driven insights and anomaly detection, reducing the need for manual monitoring. While ELK Stack’s visualization is more customizable, it requires advanced knowledge to configure effectively, whereas New Relic’s dashboards are ready to use with minimal setup.
ELK vs New Relic: ELK Stack offers customizable visualization through Kibana but requires manual setup. New Relic provides pre-built dashboards with AI insights and automatic updates, making it easier to use with minimal configuration.
Use Cases: When to Choose ELK Stack or New Relic?
Deciding between ELK Stack and New Relic depends on your observability goals, infrastructure setup, and monitoring needs. Here’s when each tool is the better choice:
Choose ELK Stack If:
- You need powerful log management – ELK Stack is best for collecting, storing, and analysing logs. It offers fast search, filtering, and custom log processing using Logstash and Elasticsearch.
- You prefer a self-hosted solution – If you want to manage your own infrastructure, ELK gives you complete control over deployment and configuration.
- You want a cost-effective option – ELK is open-source, so it’s free to use. But you will need to manage servers, storage, and scaling as your data grows.
- You have security & compliance needs – If your company requires on-premises log management for security or regulatory reasons, ELK is a solid choice.
- You need advanced querying & custom dashboards – ELK’s Kibana dashboards let you build highly custom log visualizations and queries for deep data analysis.
Choose New Relic If:
- You need full-stack monitoring – New Relic offers logs, metrics, traces, and application performance monitoring (APM) in a single platform.
- You prefer a cloud-based solution – No need to manage servers or scaling, New Relic automatically handles data ingestion, storage, and visualization.
- You want easy setup & automation – Unlike ELK, which requires manual setup, New Relic is ready to use with pre-built dashboards and automatic monitoring.
- You need AI-powered insights & alerts – New Relic uses machine learning to detect anomalies, find performance issues, and automatically correlate logs with traces and metrics.
- You Work in a Cloud or SaaS Environment – If your infrastructure is on AWS, Azure, or GCP, New Relic provides better integrations and automatic scaling than ELK.
Advantages of using Atatus over ELK Stack and New Relic
Atatus is the ultimate all-in-one observability platform that combines metrics monitoring, log management, and distributed tracing in a single, unified solution. Unlike relying on multiple tools like ELK Stack and New Relic, Atatus streamlines your observability processes by providing everything you need in one place.
With Atatus, you can monitor the health and performance of your entire infrastructure, from applications to cloud services, without switching between different platforms.
The platform automatically collects and correlates data across metrics, logs, and traces, enabling you to quickly identify and resolve performance issues. This seamless integration helps reduce complexity, manual configuration, and the overhead of managing multiple tools
Key features of Atatus include:
- Comprehensive Observability: Track your application's performance with end-to-end visibility into metrics, logs, and traces.
- Automatic Correlation: Atatus automatically correlates logs with traces and metrics, making troubleshooting faster and easier.
- Real-time Monitoring: Stay ahead of performance issues with real-time alerts and dashboards that give you actionable insights.
- Ease of Use: With pre-configured dashboards and minimal setup required, Atatus allows you to get up and running quickly.
- APM (Application Performance Monitoring): Delivers end-to-end APM with automatic instrumentation and distributed tracing. Monitor performance with minimal setup, allowing you to quickly identify and resolve bottlenecks.
Ready to see how Atatus can transform your monitoring experience? Sign up now and get started with a tool that makes observability easy and affordable!
#1 Solution for Logs, Traces & Metrics
![]() APM
APM
![]() Kubernetes
Kubernetes
![]() Logs
Logs
![]() Synthetics
Synthetics
![]() RUM
RUM
![]() Serverless
Serverless
![]() Security
Security
![]() More
More


![New Relic vs Splunk - In-depth Comparison [2025]](/blog/content/images/size/w960/2024/10/Datadog-vs-sentry--19-.png)
![New Relic vs Sentry - Which Monitoring Tool to Choose? [2025]](/blog/content/images/size/w960/2024/10/VS--1-.png)